41
2. Materials and Methods
2.1 Nanoparticles
In figure 2.1 are systematically shown the different procedures adopted for the synthesis of CdSe nanocrystals, which were prepared from the appropriate procedures. For the details the reader should refer to the relevant chapter of this thesis.
P3HT PAN CdSe S C C P OH O OH n C6H13 P O
a
b
c
d
P3HT PAN CdSe S C C P OH O OH n C6H13 P O P3HT PAN CdSe P3HT PAN CdSe S C C P OH O OH n C6H13 P O P C C S OH O OH n C6H13 P Oa
b
c
d
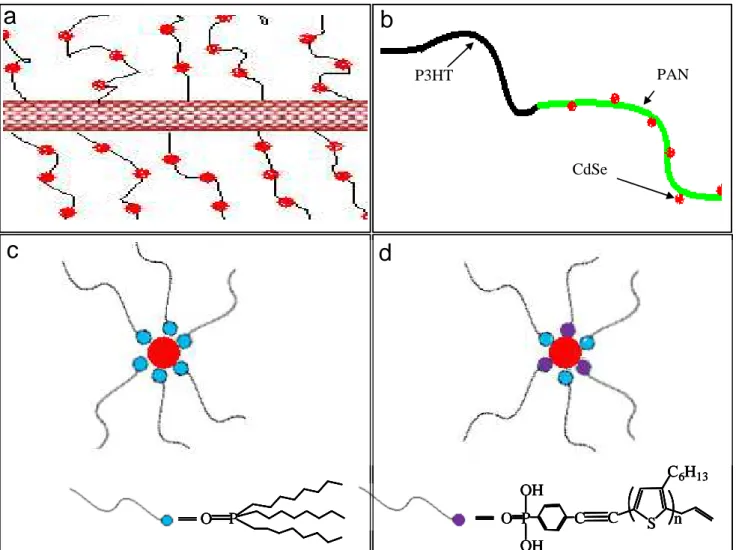
Figure 2.1 Schematic drawings of nanoparticles studied in this thesis: (a) CdSe NPs growth on
MWNT-g-PAN (b) CdSe NPs growth on P3HT-b-PAN (c) TOPO capped CdSe NPs (d) rr-P3HT-PA Capped CdSe NPs
2.2 Reagents
All synthetic operations were carried out using standard Schlenk-tube technique, under an atmosphere of nitrogen or argon. All glass vessels were dried either by heating gun under vacuum or oven dried at 150 °C prior to use. The reagents used in the growth of cadmium selenide
42
nanoparticles on polyacrylonitrile modified multiwall carbon nanotube is given below: Ethylene glycol, 2-bromoisobutyric acid, p-toluenesulfonic acid, CdSO4.2.67H2O, Se powder (∼100 mesh, 99.99%), and Na2SO3 were purchased from Aldrich and used as received. Multi-Wall Carbon Nanotubes (MWNT, baytubes): diameter 5 - 100 nm, purity ≥ 95, batch type- BLQ17968: MIV-05-182 was purchased from Bayer baytubes, 65% HNO3 from J.T. Baker. 2,2′-Azobis(isobutyronitrile) (AIBN) (from Fluka) was recrystallized from methanol and stored at 4 °C before use. Thionyl chloride (SOCl2) ≥99.0% was purchased from Fluka. Acrylonitrile (from Farmitalia Carle Erba) was distilled before use to remove inhibitors.
The reagents used in the preparation of poly(3-hexylthiophene-b-acrylonitrile) stabilized CdSe nanoparticles were 3-bromopropanol, sodium azide, α-bromoisobutyryl bromide, ethynyltrimethylsilane, 3-hexylthiophene, 2,2’-bipyridine, t-butyl magnesium chloride (1.0 M solution in THF) and allyl magnesium bromide (1.0 M solution in THF) and they all were purchased from Aldrich Chemical Co. and used as received. Ni(dppp)Cl2 catalyst was purchesded from Alfa Aser and used as received. Acrylonitrile monomer was purified by fractional distillation to remove t-butyl catechol inhibitor. N-bromo succinimide (NBS) was recrystallized prior to use. The other chemicals were used without further purification.
The reagents used in the synthesis of phosphonic acid terminated rr-P3HT were 3-hexylthiophene, ethynyltrimethylsilane, p-dibromobenzene, diethylchlorophosphate, magnesium turnings, copper iodide, PdCl2(PPh3)2, t-butyl magnesium chloride (1.0 M solution in THF) and allyl magnesium bromide (1.0 M solution in THF) and they all were purchased from Aldrich and used as received. NBS was purified as described before. The other materials were used without further purification
Commercial grade solvents used in the preparations were purified by employing conventional procedures, distilled and stored over activated molecular sieves under nitrogen atmosphere prior to their use. Ethylene carbonate (from Fluka) was distilled and stored in 3A molecular sieves before use. Tetrahdrofuran (THF) was distilled over sodium benzophenone ketyl prior to use. DMF and trimethyl amine (Et3N) were dried over K2CO3 and stored in 3A molecular sieves under nitrogen. Acetonitrile (Carlo Erba, RPE) was distilled by refluxing over K2CO3 under N2 atmosphere and stored in 4A molecular sieves. DMF (J. T. Baker) was reflux over CaH2 for 10 h and stored in 4A molecular sieves. Cyclohexane (J. T. Baker) was dried over P2O5. The following monomers and reagents were commercially available (Aldrich) and used without further purification: 3-Bromothiophene, 3-Hexylthiophene, Zinc powder.
43 2.3 Instruments and techniques
Fourier Transform Infrared Spectroscopy (FTIR)
Fourier transform infrared (FTIR) spectra were recorded using a Perkin-Elmer Spectrum One FTIR spectrometer with a resolution of 4 cm-1. Dried samples powder (1 mg) was mixed with KBr powder (100 mg) in an agate mortar. The mixture was pressed into a pellet under 10 tons load for 2-4 min, and the spectrum was recorded immediately. Sixteen accumulative scans were collected. The signal from a pure KBr pellet was subtracted as a background. Liquid samples spectra were recorded using NaCl window.
Nuclear Magnetic Resonance (NMR)
NMR spectra were recorded on Varian 200 and 300 MHz spectrophotometers in CDCl3 or deuterated DMSO. 1H NMR spectra are referenced to the residual protons in the deuterated solvent, data are reported as follows: chemical shift in the δ scale, multiplicity (s: singlet, d: doublet, t: triplet, q: quartet, m: multiplet, br: broad), coupling constants J, are reported in Hertz (Hz). 13C NMR spectra were referenced to the solvent chemical shift. The NMR spectrum of polyacrylonitrile was taken in deuterated DMSO. The 31 P NMR spectra were recorded at 40 °C in case of phosphonic acid terminated rr-P3HT.
Transmission Electron Microscopy
The measurement of the average diameter and the shape of the CdSe nanoparticles were carried out either in a JEOL-1200 transmission electron microscope using an acceleration voltage of 120 kV or in a Philips CM 200 electron microscope working at 200 kV. A single drop (10 µL) of a dilute aqueous dispersion (ca. 0.1 mg ml-1) was placed onto a copper grid coated with a carbon film. The grid was left to dry in air for several hours at room temperature. Size distributions of the nanoparticle cores were measured from enlarged TEM micrographs for at least 200 individual cluster core images.
Optical Spectroscopy (UV-VIS and PL)
Spectrophotometric measurements were carried out on a Perkin Elmer and Co. Gmbh (Überlingen, Germany) Lambda 35 spectrophotometer and fluorescence (photoluminescence, PL) measurements were performed on a Perkin Elmer and Co. Gmbh (Überlingen, Germany) LS55 spectro-fluormeter. Both apparatuses are equipped with jacketed cell holders, with temperature control to within ± 0.1°C. Knowing that any particle aggregation would lead to a red-shift and broadening of the plasmon absorption band, the stability state of nanoparticles was monitored by
44
UV-visible spectrophotometry since their surface plasmon absorption bands lie in the visible range. Absorbance spectra were collected using 1 cm quartz cuvettes. All samples were recorded at room temperature.
Size Exclusion Chromatography (SEC)
Size Exclusion Chromatography (SEC) (or Gel permeation chromatography, GPC) analyses were performed at room temperature with an equipment consisting in Jasco PU-2089 Plus pump, RI 2031 Plus refractive index detector, UV-2077 Plus UV detector, CO-2063 Plus column oven, interfaced with software Borwin 1.21.61 (JMBS DEVELOPMENT) for data elaboration. PL gel MIXED D colomns and PL gel guard column. The column temperature was set at 30°C and chloroform was used as eluent. The samples, near about 3 mg, were solubilized in 1 mL solvent and filtered by 0.2 µm PTFE filter. The elution of the filtered samples was monitored using simultaneous UV and refractive index detections. The elution times were converted to molar masses using a calibration curve based on low disperse (Mw/MN) polystyrene standards.
Atomic Force Microscopy (AFM)
All experiments were carried out at room temperature using a commercial stand-alone AFM (Bioscope; Veeco Instruments, Santa Barbara, CA) that was combined with an inverted optical microscope (Veeco nanoscope IIIa). The AFM was operated in tapping mode at a scan rate of 0.10 Hz using a standard triangular cantilevers of 0.5 -2 Ωcm phosphorus (n) doped silicon and 4 µm thickness from Veeco with a nominal spring constant of 0.06 N/m with tip radius of curvature (ROC) 2.5 nm. The cantilever spring constant was measured by using the Nanoscope 4.43 software calibration tool. Images were taken using a Veeco Multimode Nanoscope IIIa and data was manipulated using WSxM 4.0 SPMAGE07 software. All samples were grown on either glass substrate or ITO by laying a drop on substrate and dry under vacuum at ambient temperature. The Kelvin probe microscopy (KFM) was used for electric surface potential distribution study.
Scanning Electron Microscopy (SEM)
The surface morphology of MWNTs was characterized by JEOL JSM-T300 Scanning Electron Microscope (SEM). The MWNT-PAN stabilized CdSe NPs was also analyzed by EDX microanalysis.
45 Thermogravimetric Analysis (TGA)
Thermal gravimetric analyses (TGA) were performed on a Mettler-Toledo TGA/SDTA 851e instrument, using Al2O3 crucibles in an atmosphere of either nitrogen or air at a heating rate of 10 °C/ min using thermogravimetric analyzer.
Differential Scanning Calorimetry (DSC)
Differential scanning calorimetry (DSC) measurements were acquired using a 822e-METTLER TOLEDO calorimeter with STARe software version 6.10. Standard aluminum pan with 5 to 10 mg of sample were used. A first heating scan was carried out at 10°C/min from -20 to 300°C, followed by a cooling scan at the same rate from 300 to -20 °C and a final heating scan again up to 300°C.
Gas chromatograph (GC)
Gas chromatography was performed on Perkin Elmer auto system XL instrument equipped with a split/splitless injector and DB1 columns. The following method was used: injector 0.5 µL, temperature from 35 to 180 °C, at the rate 30 °C/min.
Cyclic Voltammetry (CV)
Cyclic voltammetry measurements were performed using an Autolab potentiostat 20 (Eco Chemie, Utrecht, The Netherlands) in a classical three-electrode configuration. The copper working electrode (A ≈0.10 cm2) was sealed against the bottom of a single-compartment electrochemical cell by means of a rubber O-ring. The electrical contact was made to a copper plate through the bottom of the copper substrate. Platinum and Ag/AgCl electrodes were used as counter and reference electrodes, respectively. CVs were recorded in acetonitrile/LiClO4 (0.1 M) solutions and after coating of 200 µL solution of polymer and polymer−stabilized nanoparticles on working electrode, which was suspended in 0.1M acetonitrile (1 mg/mL) and scanned at a scan rate of 50 mV s-1.