energy (ΔES1-S0). The error bar associated with the excitation energies predicted as the average of 185
the ΔES1-S0 of the 10 replicas has been estimated to be 4.0 kcal mol-1. See details in Refs 9,26-28. 186
187
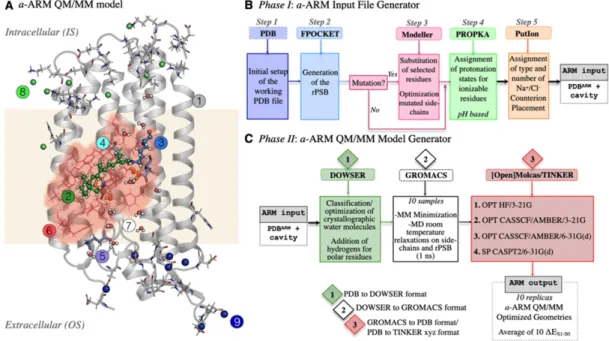
Figure 2. Structure of a-ARM. (A) (left) General scheme of a QM/MM model for the wild-type KR2 188
rhodopsin, generated by the a-ARM rhodopsin model building protocol. This is composed of: (1) 189
environment subsystem (silver cartoon), (2) retinal chromophore (green tubes), (3) Lys side-chain 190
covalently linked to the retinal chromophore (blue tubes), (4) main counter-ion MC (cyan tubes), (5) 191
protonated residues, (6) residues of the chromophore cavity subsystem (red tubes), (7) water molecules, 192
and external (8) Cl− (green balls) and (9) Na+ (blue balls) counterions. The external OS and IS charged 193
residues are shown in frame representation. The residue P219 is presented as orange tubes. (right) General 194
workflow of the a-ARM rhodopsin model building protocol for the generation of QM/MM models of 195
wild-type and mutant rhodopsins. (B) (right, top) The a-ARM protocol comprises two phases: input file 196
generator phase and (C) (right, bottom) QM/MM model generator phase. 197
198
The WT-KR2 and mutant inputs were prepared from the KR2 X-ray crystallographic structure 199
(PDB ID 6REW)33, of the corresponding pentameric form resolved at 2.2 , following an 200
a-ARMcustomized approach (see Ref. 9). More specifically, the automatically (i.e. default) produced 201
WT-KR2 model was modified (see below) to more closely replicate the observed λmax value. 202
Notice that all KR2 mutant models presented here were built starting from the input setup of the 203
achieved customized WT-KR2 model. As detailed below, some of those mutant models had to be 204
customized to more closely replicate the observed λmax value. 205
Automatic default model. The following parameters/choices were specified during the
206
automated WT-KR2 building procedure: Chain A of the X-ray crystallographic structure; 207
rotamer N84 with occupancy number of 0.50 (step 1 in Figure 2B); 24 chromophore cavity 208
residues defined based on Voronoi tessellation and alpha spheres theory, and including the K255 209
residue covalently linked to the chromophore, plus the D116 main (MC), D251 secondary (SC) 210
counter-ion residues and 3 molecules of water (step 2 in Figure 2B); protonation states predicted 211
at pH 5.2, as: neutral E160 (step 4 in Figure 2B); and the inclusion of 8 Cl− inner (IS) 7 Na+ outer 212
(OS) external counter-ions, with positions optimized with respect to an electrostatic potential 213
grid constructed around each charged target residue. The Na+ ion present in the X-ray structure 214
was kept, for a total of 8 Na+ ions in the model (step 5 in Figure 2B). Such default parameters, 215
summarized in Table S1, were used for λmax calculation as mentioned above (i.e. in terms of the 216
average vertical excitation energy of 10 replicas). 217
Model customization. As anticipated above, the default WT-KR2 model yielded a ΔES1-S0 218
value about 15 kcal mol-1 blue-shifted with respect to experimental data (see Figure S3), 219
therefore a customized model was (a-ARMcustomized approach) though a computer-aided 220
modification (i.e. via command line) of certain protonation states in step 4 of the input generator 221
(see Figure 2B). To this aim, we rely on the reported fact (see ref. 9) that the default approach 222
does not always yield models that correctly describe the electrostatics of the Schiff base 223
counterion complex in ion-pumping rhodopsins. The customization consisted in the 224
neutralization of one counterion to mitigate the overstabilization of the S0 positive charge in the 225
Schiff base region. Accordingly, in WT-KR2, the secondary D251 counterion was neutralized, 226
whereas the D116 counterion remained charged yielding a model that reproduced the observed 227
ΔES1-S0 within an error of 1.4 kcal mol-1 (Figure S3). 228
As anticipated above, the WT-KR2 customized model was successfully employed as a 229
template for the construction of the QM/MM models of 16 out of 19 mutants, obtaining ΔES1-S0 230
values with an overall error lower than 3.0 kcal mol-1. The only exceptions were P219R, P219K 231
and P219H. As shown in Figure S3, the default P219R model features a 14 kcal mol-1 blue 232
shifted ΔES1-S0 with respect to the observed value. This indicates that the inclusion of a positively 233
charged arginine side-chain in the proximity of the β-ionone ring of rPSBAT leads to a too 234
strong destabilization of the positive charge in the β-ionone region (a positively charge β-ionone 235
region is typical of the S1 state of the chromophore). In order to moderate such an effect, the 236
E160 residue in the R219 region, assigned to be neutral by step 4 of the default protocol (see 237
Figure 2B), was deprotonated assuming that the positive charge in position 219 increases the 238
group pKa. Such customization yields a model just 1.8 kcal mol-1 blue shifted (see Figure S3). In 239
the case of P219K, the lysine residue had to be assigned as neutral since the protonated lysine 240
selected by the default protocol yielded a strongly blue-shifted ΔES1-S0 value with respect to the 241
experiment. Finally, for P219H, the histidine residue had to be modeled with the neutral 242
tautomer having the δ nitrogen unprotonated (contrary to the default selection) based on a 243
comparison with the observed ΔES1-S0 the later was selected. 244
According with the discussion above, the protonation states setup of the twenty QM/MM 245
customized models is: neutral D251, E160 for WT and P219X with X=A, C, F, G, I, L, M, N, Q, 246
S, T, V, W, Y, neutral E116 for P219R, neutral D251, E160, H219 (with hydrogen in the ε 247
nitrogen) for P219H, neutral D251, E160, K219 for P219K, neutral D251, E160, E219 for 248
P219E, and neutral D251, E160, D219 for P219D. These changes led to a different charge 249
distribution of the overall systems, with respect to the default model and, thus, in each case the 250
external counter-ions were automatically updated in step 5 (see Figure 2B), where an additional 251
Na+ was included in the OS. The other parameters for the customized inputs (i.e., chain, rotamers, 252
cavity) remain the same as the described for the default model. 253
Automation of the mutant rotamer selection. The QM/MM modeling of the mutants
254
required a second step of experimentally-driven customization dealing with the residue 255
side-chain conformation (i.e. rotamer selection). That procedure consisted in evaluating the 256
model performance for a set of automatically chosen rotamers (see Figure S2) and select the one 257
that better reproduces the observed ΔES1-S0 value. To this aim, an update version of the mutation 258
routine of the input generator (see step 3 in Figure B), that uses Modeller34instead of the default 259
rotamer library SCWRL435, is proposed as part of the present work. A detailed description of the 260
new approach is provided in Section S2 of the SI (see Figure S1). Briefly, in order to explore the 261
performance of different rotamers of the mutated side-chain, three QM/MM models featuring the 262
three highest scored mutated side-chain rotamers selected by Modeller34, are produced and their 263
ΔES1-S0 evaluated (see Figure S2). Then, the model that better reproduces the observed ΔES1-S0 is 264
selected. To perform such selection, we use, as a baseline, the difference between the computed 265
and observed ΔES1-S0 of the WT-KR2, hereafter referred to as ΔΔEExp,WTS1-S0. The equivalent 266
quantity calculated for each rotamer (ΔΔEExp,rotXS1-S0, with X=1, 2, 3) is then contrasted with the 267
ΔΔEExp,WT
S1-S0 via the equation rotX = (ΔΔEExp,rotXS1-S0 - ΔΔEExp,WTS1-S0). The rotamer that 268
features the lower rotX value (preferring blue-shifted values) is chosen as the representative 269
QM/MM model. The python-based code employed for the selection is provided as SI file. 270
Although this approach relies on experimental information and does not represent a predictive 271
tool, it automates the side-chain conformation selection during the construction of mutant 272
QM/MM models. 273
274
RESULTS and DISCUSSION
275
Absorption Spectra of P219X Mutants of KR2. We attempted to express the 19 different
276
P219X mutants of KR2 in E. coli where all-trans retinal was added at the induction period to 277
produce the rPSBAT chromophore. Figure S6 shows pictures of WT and 19 P219 mutants. As is 278
seen from the color, expression was much lower for basic amino acids such as His, Lys and Arg. 279
The expression levels are quantitatively compared in Figure S7, where all the P219X mutants are 280
enough expressed to test their absorption maxima. 281
To quantify the absorption properties of each mutant, the sample was illuminated in the 282
presence of hydroxylamine. This process converts protein-bound retinal chromophore into retinal 283
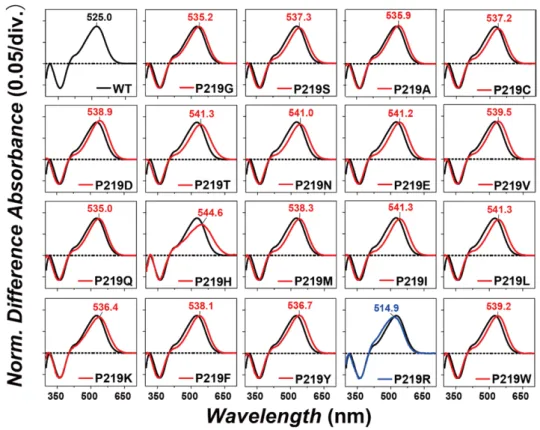
oxime by light, so that one can easily obtain the λmax of each protein without purification. Figure 284
3 shows the change in absorption (before-minus-after illumination) representing the 285
photobleaching of WT and 19 mutants in the presence of 500 mM hydroxylamine. In WT (black 286
curve), positive and negative peaks appeared at 525 and 361 nm, corresponding to the 287
unphotolyzed protein and retinal oxime, respectively. The mutant spectra were normalized to the 288
WT spectrum by use of a negative peak at 361 nm. 289
290
Figure 3. Light-induced difference absorption spectra of the WT (black curves) and 19 mutants (colored 291
curves) of KR2 in the presence of 500 mM hydroxylamine. Positive and negative signals show the spectra 292
before and after illumination corresponding to those of the rhodopsin and retinal oxime, respectively. 293
Mutant and WT spectra were normalized by use of a negative peak at 361 nm. 294
295
Blue and red curves in Figure 3 show light-induced difference absorption spectra 296
(before-minus-after illumination) of mutants, which exhibit spectral blue and red shifts, 297
respectively. While negative peaks due to retinal oxime were identical for WT and mutants, all 298
mutants showed spectral red-shifts, corresponding to λmax in the 535-541 nm range. The only 299
exception was P219R, whose λmax is located at 515 nm. It is likely that Arg is positively charged 300
even in the hydrophobic environment surrounding position 219. Consistently with the color 301
tuning theory mentioned above, such positive charge, placed near the β-ionone ring of rPSBAT, 302
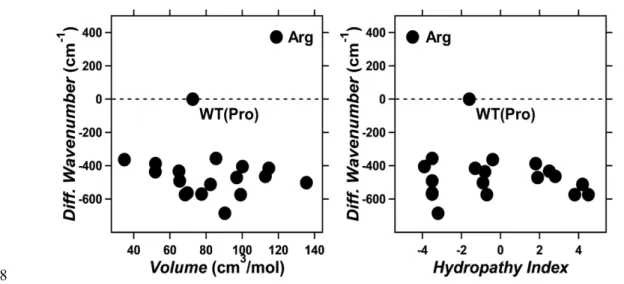
would cause a spectral blue shift. On the other hand, in Figure 4 we report the observed spectral 303
shift in energy (in wavenumber) versus volume (left) and hydropathy (right) of amino acids. The 304
figure shows that for 18 mutants the λmax correlate with neither volume nor hydropathy, whereas 305
the blue-shifted Arg is unique as it has both higher volume and lower hydropathy than Pro. The 306
higher volume of Arg would suggest that the observed blue-shift is related to a steric effect. 307
Below we show that, according to our computational analysis, this effect alone would not explain 308
the observed P219R spectral change. 309
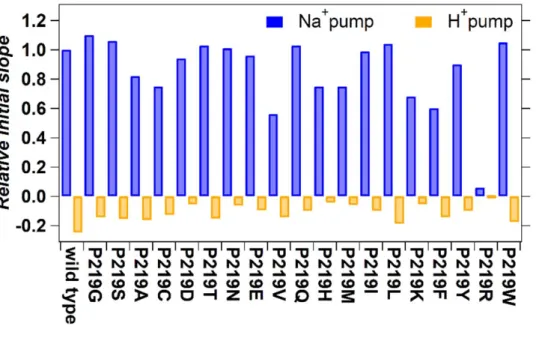
Figure 5 compares ion-transport activity using a pH electrode. The sodium and proton pump 310
activities of the WT is maintained except for P219R. This fact suggests that the addition of a 311
positive charge at that specific position is responsible for the lack of ion transport. Both 312
absorption spectra (Figure 3) and transport activity (Figure 5) suggest that other amino acid 313
replacements lead to neutral side-chain. In fact, it is reasonable for Asp, Glu, and His to be 314
neutral in the hydrophobic environment. In addition, Lys may also be neutral in the P219K 315
mutant. All these assigned protonation states are consistent with those of the constructed 316
QM/MM models (see also the Method section). 317
318
Figure 4. Correlation between the absorption light energy and the volume (left) or hydropathy index 319
(right) of the amino acid residue at position 219 in KR2. The y-axis represents the difference in 320
wavenumber from that of the wild type (reciprocal λmax; cm−1), where positive and negative values 321
correspond to the spectral blue- and red-shifts, respectively. 322
323
Figure 5. Quantitative comparison of pump activities of the WT and mutant KR2. The numbers of 324
protons taken in or released from the cells by the pump activity of KR2 and each mutant per one protein 325
molecule in one second are shown. The values were estimated from the initial slope of light-induced pH 326
changes and the expression levels of the proteins. E. coli cells suspensions expressing KR2 mutants are 327
illuminated at >520 nm light, and quantified proton release and uptake are measured in the solution 328
containing 100 mM NaCl (blue bars) and CsCl (orange bars). Positive values indicate the numbers of 329
protons which are taken into cells by one protein molecule per second, which originates from outward 330
Na+ pump. Negative values indicate the numbers of protons which are released from cells by one protein 331
molecule per second, which originates from outward proton pump. 332
333
Modeling the λmax trend via vertical excitation energy computations. The customized 334
QM/MM model of WT-KR2 (see above) has been selected as a suitable template for mutant 335
modeling. Indeed, it reproduces the observed λmax (525 nm) equivalent to a vertical excitation 336
energy ΔES1-S0Exp ⁄λmaxa,Exp = 54.5 kcal mol-121 with a discrepancy falling within the 4.0 kcal 337
mol-1 error bar established for the a-ARM protocol9,26-28. This result is reported in Table 1 where
both computed (ΔES1-S0a-ARM) and observed (ΔES1-S0Exp ) vertical excitation energies are given along 339
with the difference between them. This is calculated as ΔΔES1-S0Exp,a-ARM= ΔES1-S0a-ARM− ΔES1-S0Exp . The 340
WT-KR2 ΔES1-S0a-ARM value is 56.0 ± 0.1 kcal mol-1 (511 nm) and thus differs from the 341
experimental data of just 1.4 kcal mol-1 (-14 nm). 342
The result above point to WT-KR2 model as a suitable template for the construction of P219X 343
mutant models. Indeed, as displayed in Figure 6A, the 219 position appears to be well suited for 344
color tuning due to its closeness to the β-ionone ring of rPSBAT, so it is expected that the 345
replacement of Pro by residues with different steric hindrance and/or polarity can affect the 346
vertical excitation energy. The numerical values of the computed and observed vertical 347
excitation energy for the wild type and 19 constructed point mutant models (see Section S1 in the 348
SI for details) including the computed transition oscillator strength (fOsc) and ΔΔES1-S0Exp,a-ARM, are 349
listed in Table 1. 350
351
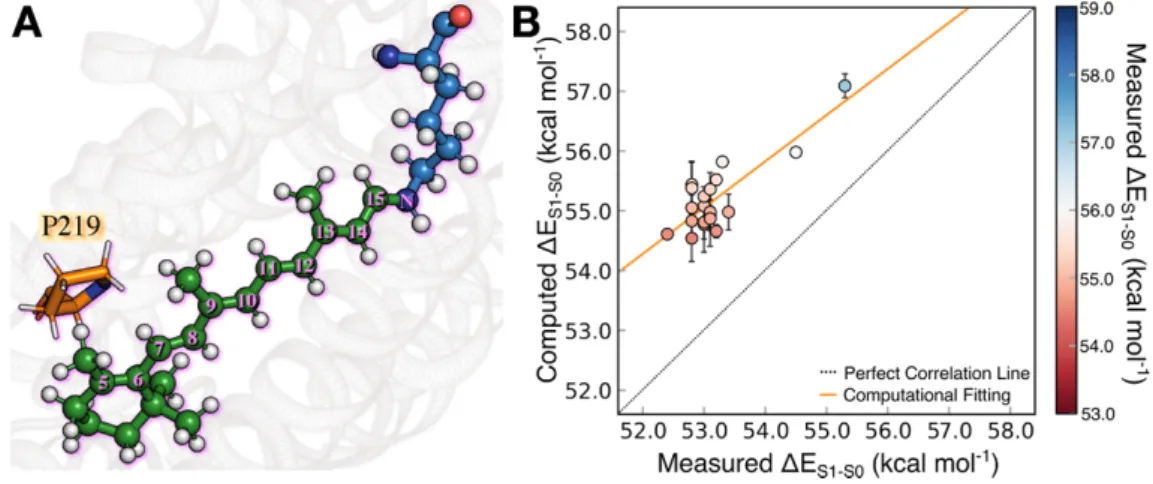
Figure 6. Scheme of the retinal proton Schiff base of WT- KR2. The residue P219 is located near the 352
β-ionone ring. In the right panel we display the correlation plot between computed (ΔES1-S0a-ARM) and 353
measured (ΔES1-S0Exp ) vertical excitation energy for WT-KR2 rhodopsin and 19 of its mutants (P219X, 354
with X = A, C, D, E, F, G, H, I, K, L, M, N, Q, R, S, T, V, W, Y). 355
Table 1. a-ARM QM/MM models for the wild-type KR2 (WT-KR2) rhodopsin and 19 of its mutants 357
(P219X, with X = A, C, D, E, F, G, H, I, K, L, M, N, Q, R, S, T, V, W, Y). First vertical excitation energy 358
(∆ES1−S0), maximum absorption wavelength (λamax), transition oscillator strength (fOsc), and difference 359
between calculated and experimental data (ΔΔES1-S0Exp,a-ARM). Standard deviation for the N = 10 replicas (σN) is 360 presented as subindex. 361 Variant
Experimental a-ARM (N = 10) a-ARM (N = 1)a
ΔES1-S0Exp λmaxa,Exp ΔES1-S0a-ARM λmaxa,a-ARM fOsc ΔΔES1-S0Exp,a-ARM ΔES1-S0a-ARM λmaxa,a-ARM fOsc ΔΔES1-S0Exp,a-ARM
(kcal
mol-1) (nm) mol(kcal -1) (nm) (kcal mol-1) mol(kcal -1) (nm) (kcal mol-1)
362
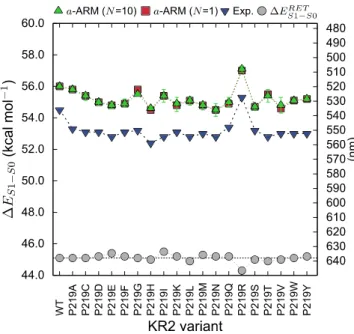
We begin the analysis of the experimental data by comparing the ΔES1-S0Exp trend (see definition 363
above) with the corresponding computed ΔES1-S0a-ARM values in the hope to learn how the P219X 364
mutants shift their colors with respect to WT-KR2 (see blue down-triangles in Figure 7). As 365
shown in Figure 6B and reported in Table 1, the observed values vary from 546 nm (52.4 kcal 366
mol-1) to 517 nm (55.3 kcal mol-1). Remarkably, the P219R is the only variant that exhibit a 367
blue-shifted effect with respect to the WT-KR2 of c.a. 0.8 kcal mol-1, whereas the other 18 368
mutants exhibit a red-shifted effect raging from -1.1 to -2.1 kcal mol-1 suggesting that an 369 P219A 53.3 536 55.80.1 512 1.16 2.5 55.8 513 1.16 2.5 P219C 53.1 538 55.40.3 516 1.20 2.3 55.4 516 1.20 2.3 P219D 53.1 538 55.00.2 520 1.21 1.9 55.0 520 1.22 1.9 P219E 52.8 541 54.80.2 521 1.22 2.0 54.8 522 1.24 2.0 P219F 53.1 538 54.90.3 520 1.23 1.8 54.9 520 1.22 1.8 P219G 53.2 537 55.50.1 515 1.17 2.3 55.8 513 1.17 2.6 P219H 52.4 546 54.60.1 524 1.22 2.2 54.5 524 1.22 2.1 P219I 52.8 542 55.30.2 517 1.17 2.5 55.4 516 1.22 2.6 P219K 53.1 538 54.90.5 521 1.25 1.8 54.8 521 1.22 1.7 P219L 52.8 541 55.10.2 519 1.22 2.3 55.1 519 1.20 2.3 P219M 53.0 539 54.80.2 522 1.21 1.8 54.8 522 1.21 1.8 P219N 52.8 541 54.50.4 524 1.20 1.7 54.5 524 1.21 1.7 P219Q 53.4 535 55.00.3 520 1.24 1.6 54.9 521 1.23 1.5 P219R 55.3 517 57.10.2 501 1.12 1.8 57.0 501 1.12 1.7 P219S 53.2 537 54.70.1 523 1.24 1.5 54.7 523 1.24 1.5 P219T 52.8 542 55.40.4 516 1.20 2.6 55.5 516 1.19 2.7 P219V 53.0 539 54.80.5 522 1.24 1.8 54.6 523 1.31 1.6 P219W 53.0 539 55.10.1 519 1.22 2.1 55.1 519 1.22 2.1 P219Y 53.0 539 55.20.2 518 1.19 2.2 55.2 518 1.19 2.2 MAE 2.0 MAE 2.0 ADmax 2.6 ADmax 2.7 MAD 0.3 MAD 0.3
aReplica with ΔE S1-S0 a-ARM
closest to the average.
electrostatic destabilization of the chromophore positive charge near its β-ionone is a key factor 370
in the observed color tuning. 371
As apparent from inspection of Figure 6B and Figure 7, the computed ΔES1-S0a-ARMvalues 372
correlate well with the experimental data. For instance, for each mutant, the blue-shifted or 373
red-shifted effect relative to WT-KR2, shows that, in line with the observations, P219R is the 374
only mutant presenting a blue-shifted effect and P219H is one of the most red-shifted mutants. 375
The comparison of the orange and black lines in Figure 6B, shows that the computed values 376
exhibit a systematic blue-shifted error with a ΔΔES1-S0Exp,a-ARM value ranging from 1.5 to 2.6 kcal 377
mol-1 (see Table 1). In addition, the mean absolute error (MAE) and the mean absolute deviation 378
(MAD) are 2.0 and 0.3 kcal mol-1 respectively, consistently with the a-ARM protocol error 379
bar9,27,28. The above presented results suggest that all 20 models can be employed for 380
investigating the color tuning mechanism operating in KR2. For instance, a first question to be 381
answered is: why R is the only residue, out of the three canonical positively charged residue (K, 382
H and R), causing a blue-shift in spite of its not dramatically larger volume? 383
385
Figure 7. Vertical excitation energy (ΔEa-ARM
S1-S0,kcal mol-1) and maximum absorption wavelength (λamax, 386
nm) for wild-type KR2 and 19 of its P219X (X = A, C, D, E, F, G, H, I, K, L, M, N, Q, R, S, T, V, W, Y) 387
variants. The experimental values (blue down triangles) are presented along with the a-ARM values 388
predicted by using the average of 10 replicas (green triangles), and the representative replica (red squares). 389
The values for the retinal chromophore (gray circles) calculated in vacuum (ΔERET
S1-S0), outside the protein 390
environment, are also presented. 391
392
Color tuning analysis in terms of steric and electrostatic effects. In order to gain insight into
393
the color tuning mechanism observed for the 19 single point mutations of the P219 residue, we 394
looked at the steric and/or electrostatic effects that modulate the energy of either the S0 or the S1 395
states and, consequently, the λmax (see Figure S4). In Scheme 1, we give a visual representation of 396
three fundamental quantities (ΔΔETOT
S1-S0, ΔΔESTRS1-S0, ΔΔETOTS1-S0 - ΔΔEELE(d)S1-S0) that we will 397
consider in the excitation energy analysis and whose values are a function of the structural changes 398
(both at the chromophore and protein cavity levels) of each mutant with respect to WT-KR2. As 399
we will see below, using these quantities we can also compute the two additional quantities 400
ΔΔEELE(i)
S1-S0 = ΔΔETOTS1-S0 - ΔΔEELE(d)S1-S0 - ΔΔESTRS1-S0, and ΔΔEELE(t)S1-S0 = ΔΔEELE(d)S1-S0 + 401
ΔΔEELE(i)
S1-S0. ΔΔETOTS1-S0 (see Scheme 1A) is defined as the difference between the mutant and 402
WT-KR2 excitation energies (ΔES1-S0a-ARM). ΔΔESTR
S1-S0, is defined as the difference between the 403
excitation energies of the isolated chromophore (ΔΔERET
S1-S0) of the mutant and WT-KR2. 404
Finally, the third is defined as the difference between the excitation energies obtained from the 405
QM/MM mutant model and WT-KR2 model after having switches off the charges of the residue 406
in position 219. Such last quantity corresponds to the total excitation energy change (ΔΔETOT S1-S0) 407
minus the direct electrostatic effect due to the amino acid replacement (ΔΔEELE(d) S1-S0). 408
409
Scheme 1. Excitation energy analysis. A. Difference between the a-ARM models excitation energies of a 410
P219X mutant with respect to the wild-type due to (i) structural deformation (see curly arrows) and (ii) 411
structural deformation of the cavity residues (see dashed lines indicating the hydrogen bond network) and 412
(iii) rPSBAT reorientation. B. Difference between the excitation energies of the mutant and isolated 413
chromophores taken with their protein equilibrium structures. C. Difference between the a-ARM models 414 WTKR2 reference KR2 mutant ∆∆ESTRS1-S0 ∆∆ETOTS1-S0
-
=
=
-219 219 KR2 mutant 219=
219∆∆ETOTS1-S0 - ∆∆EELE(d)S1-S0
WTKR2 reference charge off charge off
A
B
C
-iii i iiexcitation energies of a P219X mutant with respect to the wild-type due to difference between the 415
excitation energies of the isolated chromophores taken with their protein equilibrium structure. 416
417
Steric effects. We begin the discussion on steric effects by investigating how the retinal
418
chromophore is structurally modified by the mutations (i) near the β-ionone and (ii) near the 419
Schiff base linkage (see S2). Notice that we evaluated steric effect through an "atomistic" 420
approach focused on the changes in rPSBAT geometrical and electronic structure and therefore 421
not directly related to steric effects evaluated on the basis of the changes in residue volume 422
addressed above. To do so, we select a representative QM/MM structure for each mutant model 423
(i.e., the replica with ΔES1-S0a-ARM closest to the average, see Table 1) and compute the difference 424
between the magnitude of its most relevant structural parameters (e.g., torsional dihedral angles 425
and bond lengths) with respect to those corresponding to the representative structure of the 426
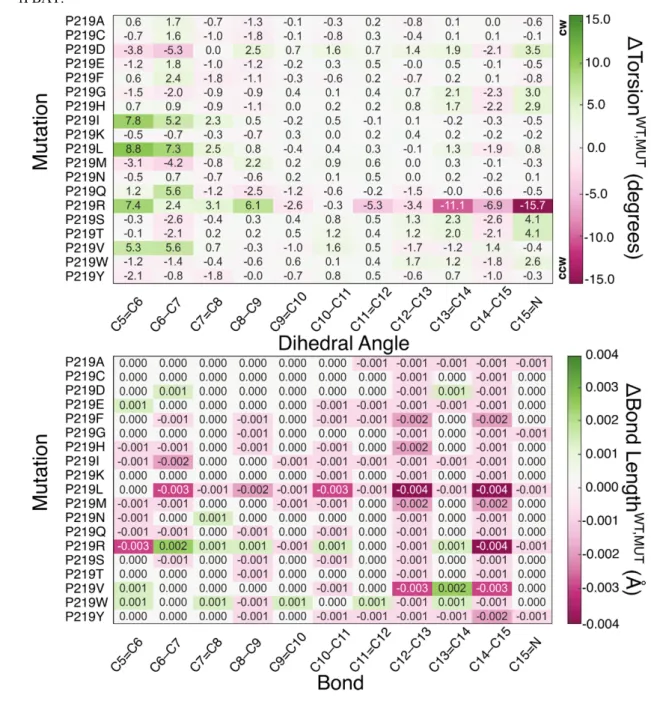
WT-KR2 model. In Table 2 we report a heatmap visualization of such differences in terms of 427
skeletal dihedral angles ( ΔTorsion , ) and carbon-carbon bond lengths 428
(ΔBond Length , ). Based on the range in which the latest quantities change, we establish 429
an arbitrary threshold of 2.0 degrees and 0.01 Å, respectively, as meaningful variations. The 430
dihedrals with the largest variation are C5=C6 and C6-C7 that, as shown in Figure A, belong to 431
the rPSBAT framowrk geometrically closer to the 219 residue. In addition, for specific cases the 432
"reactive" C13=C14 dihedral as well as the C14-C15 and C15=N dihedrals show variability. 433
More specifically, P219I, P219L, P219M, P219V, P219F, P219Y (i.e., featuring large 434
hydrophobic side-chain) and P219Q (i.e., featuring large polar uncharged side chain) present the 435
largest structural effect near the β-ionone ring but do not exhibit a structural change in the 436
C15=N bond region. On the other hand, the mutants P219G, P219H and P219W show a limited 437
change in the C15=N region but not in other regions. However, there are three cases, P219D (in 438
its neutral form), P219S and P219T (i.e., polar uncharged side-chains) that present changes in 439
both regions. As expected, the largely blue shifted P219R mutant featuring a positively charged 440
side-chain induces a significant, more than 2.0 degrees change of its dihedral angles. Such 441
change must contribute to the ΔES1-S0a-ARM change with respect to WT-KR2 and the other mutants. 442
On the other hand, as observed in 443
444
, none of the bond lengths are significantly altered with respect to the WT-KR2 reference. 445
We now look at impact of the described geometrical changes on the vertical excitation energy 446
and, therefore, on the λa
max value. To this aim, we compare the computed ΔES1-S0RET,MUT values 447
with the corresponding wild-type ΔES1-S0RET,WT for the isolated chromophore. This analysis consists 448
in extracting, for WT-KR2 and for each variant, the rPSBAT structure from the protein and 449
computing its vertical excitation energy without relaxing. A small ΔΔES1-S0STR = 450
ΔES1-S0RET,MUT-ΔES1-S0RET,WT value indicates that the geometrical distortion of the retinal due to the 451
point mutation has only a limited effect on the excitation energy change. Consistently with the 452
small variations in ΔES1-S0RET,WT reported in Figure 7, the ΔΔES1-S0STR values reported in Figure 8A 453
shows that the impact of the rPSBAT geometrical deformation on the change in excitation 454
energy is very limited. The only exception is, consistently with the geometrical data, P219R 455
featuring a red-shifting contribution of only ca. -1 kcal mol-1. 456
458
Table 2 Heatmap representation of the variation of structural parameters of P219X (X= A, C, D, E, F, G, 459
H, I, K, L, M, N, Q, R, S, T, V, W, Y) mutants with respect to the wild-type KR2 (WT-KR2). Difference 460
between WT-KR2 and mutant dihedral angles, ΔTorsion , (top) and bond lengths, 461
ΔBond Length , (bottom). Counterclockwise (CCW) and clockwise (CW) orientation of the 462
rPBAT. 463
Electrostatic effects. The QM/MM models also allow to investigate the electrostatic effects.
465
The total electrostatic effect can be decomposed in two parts: (i) the first can be considered as a 466
direct component due to the variation in number, magnitude, and position of the point charges of
467
residue 219 caused by the P to X replacement and (ii) a more indirect component produced from 468
the reorganization of the local environment and hydrogen bond network induced by the same 469
replacement and due to the fact that conserved residues and water molecules change in position 470
or orientation. The indirect component ΔΔES1-S0ELE(i) can be evaluated in two steps by first 471
computing the differences between the vertical excitation energy of the P219X mutant and 472
WT-KR2 obtained after setting the 219 residue charges to zero (ΔES1-S0MUT,OFF− ΔES1-S0WT,OFF) and then 473
by subtracting from such difference the steric effect ΔΔES1-S0STR defined above. The direct 474
component is then simply defined as (ΔΔES1-S0TOT - ΔΔES1-S0STR ) - ΔΔES1-S0ELE(i)where ΔΔES1-S0TOT and 475
ΔΔES1-S0STR are the full protein and chromophore excitation energies. The total electrostatic effect 476
is defined as ΔΔEELE(t)S1-S0 = ΔΔEELE(d)S1-S0 + ΔΔEELE(i)S1-S0 = ΔΔES1-S0
TOT - ΔΔE S1-S0 STR .
478
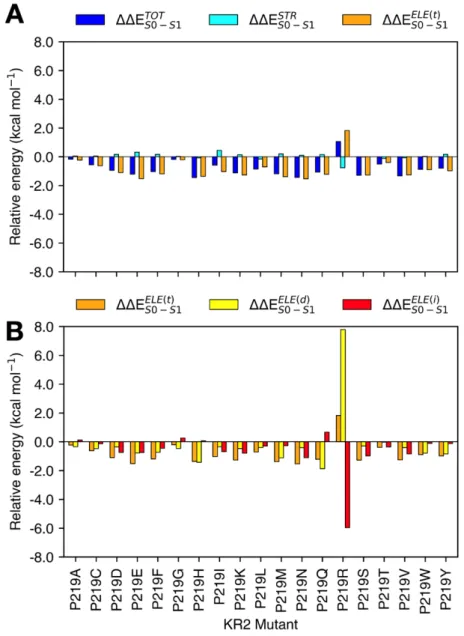
Figure 8. (A) Total steric (ΔΔES1-S0STR ) and electrostatic (ΔΔES1-S0ELE(t)) contributions of the interaction of the 479
retinal with the protein environment for the P219X (X = A, C, D, E, F, G, H, I, K, L, M, N, Q, R, S, T, V, W, 480
Y). (B) Decomposition of the total ΔΔES1-S0( ) electrostatic effects on its indirect (ΔΔES1-S0( )) and direct 481
(ΔΔES1-S0( )). 482
483
Figure8 presents the relative vertical excitation energy for each mutant with respect to 484
WT-KR2 value ( ΔΔES1-S0TOT ), and its steric ( ΔΔES1-S0STR ) and total electrostatic ( ΔΔES1-S0ELE(t)) 485
contributions. Again, it is apparent that steric effects due to the variation in geometry of the 486
retinal chromophore (see cyan bars in Figure 8A), are limited and do not compete with the 487
electrostatic effect except for P219R. In general it can be claimed that, on the basis of the 488
a-ARM QM/MM models the electrostatic effect is the one driving the changes in the computed
489
and, therefore, observed (i.e. when considering the similar trends in computed and observed 490
values seen in Figure ) vertical excitation energy and therefore λmax values. 491
We now discuss the role of the two components of the electrostatic effects that are calculated 492
using the definitions given above (see Figure 8B). The obtained values for ΔES1-S0ELE(d) components 493
range from -1 to 7 kcal mol-1. When the charges for the R219 residue in the mutant P219R are 494
turned off, a large 7 kcal mol-1 component is obtained consistently with the disappearance of a S1 495
destabilizing Arg positive charge at position 219. 496
A comparison of the contribution of both direct and indirect electrostatic components is 497
plotted in Figure 8B. Here we only discuss in detail four selected cases representing different 498
responses to the mutation referring to absolute magnitudes: P219E, negative indirect ≈ negative 499
direct effects (Figure 9A); P219H, negative direct and ≈ zero indirect effects (Figure 9B); 500
P219Q, negative direct > positive indirect effects (Figure 9C); and P219R, positive direct > 501
negative indirect effects (Figure 9D). Figure 9A-D display the corresponding chromophore and 502
most important cavity changes for these four mutants. The comparison of Figure 9D with Figure 503
9A-C shows that the QM/MM model of P219R, where a full positive charge is introduced, gets 504
naturally counterbalance by the deprotonation of the Glu residue in position 160 even if this 505
residue is located c.a. 11 Å away from the β-ionone ring (see Figure S4). This change is also 506
accompanied by a substantial rearrangement of the molecules of water near the chromophore 507
protonated Schiff base group and therefore a variation of the hydrogen bond network. 508
Furthermore, the same model indicates that, in contrast to WT-KR2 and the other 18 mutants, the 509
P219R model can only reproduce the observed λmax value after changing the protonation states of 510
the rPSBAT counterion complex making D116 neutral and D251 positively charged. (see Figure 511
and Figure S5) We hypothesize that this rearrangement of the protonation states is connected to 512
the observed lack of sodium pumping activity in this mutant. This relatively important alterations 513
appear reasonable when considering, as also stressed above, that a full localized charge is 514
introduced in the KR2 cavity upon mutation. In fact, such large changes, including the changes 515
in protonation states, are found to be not necessary in the mutant models P219K and P219H as 516
the residues Lys and His are in their deprotonated (i.e. neutral) forms and, thus, the general 517
arrangement of the charges in the cavity is not altered with respect to WT-KR2. 518
519
Figure 9 Comparison between the QM/MM models of the P219[E, H, Q, R] mutants (orange sticks) and 520
the WT-KR2 (gold outline). A. P219E replacement displaying changes in residue 251. B. P219H shows 521
limited changes in the chromophore and protein environment with the exception of a water relocation 522
that, however, seem not to impact the excitation energy value. C the P219Q cavity response to the residue 523
replacement is minimal. D Vast chromophore and cavity relocations in P219R. The circled residue 524
corresponds to the ones where it is found that a ionization state modification after residue replacement is 525
necessary for reproducing the observed excitation energy change. 526
527
CONCLUSIONS
Above we have presented a combined experimental and computational investigation of the 529
entire set of P219X mutants of KR2 which provides support for the existence of a G/P switch in 530
microbial rhodopsins. We have also reported on an original computational analysis of the mutant 531
vertical excitation energy indicating that G/P is, essentially, an electrostatic switch. More 532
specifically, the simulation and decomposition of the observed excitation energies using 20 533
multiconfigurational quantum chemistry based QM/MM models, suggests that the switch 534
operates by inducing variations in the electrostatic interaction of the chromophore with its 535
environment while replacement-induced geometrical distortions do not appear to play a major 536
role. We have also shown that both direct (the change in the electrostatic field due to the residue 537
replacement) and indirect (the changes due to all other cavity reorganization induced by the 538
replacement and including chromophore reorientation, side-chain and water relocations and the 539
modification of the hydrogen bond network) effects contribute to determine the color change. 540
Such a result cast doubts on the possibility to extract simple rules or formulate theories for 541
predicting how a switch operates without understanding the molecular-level details of the side 542
chain replacement. In other words, the analysis indicates that the color tuning mechanism seen in 543
KR2 has a complex origin involving changes in protonation state and hydrogen bond networks 544
that require atomistic simulations to be satisfactorily understood. 545
The possibility to carry out, for the first-time, a systematic modeling of mutants (i.e. 546
comprising all 19 possible replacements) underscores the importance of automated 547
computational tools for the fast building of congruous (i.e. comparable) QM/MM models. In 548
fact, our study indicates that the use of models constructed through a-ARM-like protocols, to 549
avoid errors and biases likely to impact the quality of manually built models, can help 550
researchers to propose more quantitative color tuning mechanisms whose validity goes beyond 551
the present qualitative theory of the origin of λmax variations. 552
553 554
Acknowledgements
555
We thank Dr. M.O. is grateful for partial support provided by grants NSF CHE-CLP-1710191, 556
NIH 1R15GM126627 01, Banca D’Italia and MIUR, Dipartimento di Eccellenza, 2017-2022. 557
We also thank the financial supports by JSPS KAKENHI grants 18H03986, 19H04959 (H.K.), 558
and 17H03007 (K.I.), and by JST PRESTO (JPMJPR15P2) and CREST (JPMJCR1753 and 559
JPMJCR17N5). 560
561 562
References
563
1 Ernst, O. P. et al. Microbial and animal rhodopsins: Structures, functions, and molecular 564
mechanisms. Chem. Rev. 114, 126-163 (2014). 565
2 Devine, E. L., Oprian, D. D. & Theobald, D. L. Relocating the active-site lysine in 566
rhodopsin and implications for evolution of retinylidene proteins. Proc. Natl. Acad. Sci. 567
USA 110, 13351-13355 (2013).
568
3 Shimono, K., Ikeura, Y., Sudo, Y., Iwamoto, M. & Kamo, N. Environment around the 569
chromophore in pharaonis phoborhodopsin: Mutation analysis of the retinal binding site. 570
Biochim. Biophys. Acta 1515, 92-100 (2001).
571
4 Yokoyama, S. Evolution of dim-light and color vision pigments. Annu. Rev. Genomics 572
Hum. Genet. 9, 259-282 (2008).
573
5 Sudo, Y. et al. A blue-shifted light-driven proton pump for neural silencing. J. Biol. 574
Chem. 288, 20624-20632 (2013).
575
6 Engqvist, M. K. et al. Directed evolution of Gloeobacter violaceus rhodopsin spectral 576
properties. J. Mol. Biol. 427, 205-220 (2015). 577
7 Hayashi, S. et al. Structural determinants of spectral tuning in retinal 578
proteins-bacteriorhodopsin vs sensory rhodopsin II. J. Phys. Chem. B 105, 10124-10131 579
(2001). 580
8 Fujimoto, K., Hayashi, S., Hasegawa, J. Y. & Nakatsuji, H. Theoretical studies on the 581
color-tuning mechanism in retinal proteins. J. Chem. Theory Comput. 3, 605-618 (2007). 582
9 Pedraza-González, L., De Vico, L., Marı, N. M., Fanelli, F. & Olivucci, M. a-ARM: 583
Automatic rhodopsin modeling with chromophore cavity generation, ionization state 584
selection, and external counterion placement. J. Chem. Theory Comput. 15, 3134-3152 585
(2019). 586
10 Béjà, O., Spudich, E. N., Spudich, J. L., Leclerc, M. & DeLong, E. F. Proteorhodopsin 587
phototrophy in the ocean. Nature 411, 786-789 (2001). 588
11 Katayama, K. & Sekharan, S. S., Y. in Optogenetics (eds H. Yawo, H. Kandori, & A. 589
Koizumi) Ch. 7, 89-107 (Springer, 2015). 590
12 Inoue, K., Tsukamoto, T. & Sudo, Y. Molecular and evolutionary aspects of microbial 591
sensory rhodopsins. Biochim. Biophys. Acta 1837, 562-577 (2013). 592
13 Broser, M. et al. Neor, a near-infrared absorbing rhodopsin. Nat. Commun. 11, 5682 593
(2020). 594
14 Kato, H. E. et al. Atomistic design of microbial opsin-based blue-shifted optogenetics 595
tools. Nat. Commun. 6, 7177 (2015) 10.1038/ncomms8177. 596
15 Lin, J. Y., Knutsen, P. M., Muller, A., Kleinfeld, D. & Tsien, R. Y. Reachr: A red-shifted 597
variant of channelrhodopsin enables deep transcranial optogenetic excitation. Nat. 598
Neurosci. 16, 1499-1508 (2013).
599
16 Oda, K. et al. Crystal structure of the red light-activated channelrhodopsin Chrimson. 600
Nat. Commun. 9, 3949 (2018) 10.1038/s41467-018-06421-9.
601
17 Man, D. et al. Diversification and spectral tuning in marine proteorhodopsins. EMBO J. 602
22, 1725-1731 (2003).
603
18 Bielawski, J. P., Dunn, K. A., Sabehi, G. & Beja, O. Darwinian adaptation of 604
proteorhodopsin to different light intensities in the marine environment. Proc. Natl. Acad. 605
Sci. U S A 101, 14824-14829 (2004).
606
19 Ozaki, Y., Kawashima, T., Abe-Yoshizumi, R. & Kandori, H. A color-determining amino 607
acid residue of proteorhodopsin. Biochemistry 53, 6032-6040 (2014). 608
20 Sudo, Y. et al. A microbial rhodopsin with a unique retinal composition shows both 609
sensory rhodopsin II and bacteriorhodopsin-like properties. J Biol Chem 286, 5967-5976 610
(2011). 611
21 Inoue, K. et al. Red-shifting mutation of light-driven sodium-pump rhodopsin. Nat. 612
Commun. 10, 1993 (2019).
613
22 Tang, K., Lin, D., Liu, K. & Jiao, N. Draft genome sequence of Parvularcula oceani 614
JLT2013T, a rhodopsin-containing bacterium isolated from deep-sea water of the 615
southeastern Pacific. Mar. Genomics 24, 211-213 (2015). 616
23 Choi, D. H., Yi, H., Chun, J. & Cho, B. C. Jannaschia seosinensis sp. Nov., isolated from 617
hypersaline water of a solar saltern in Korea. Int J Syst Evol Microbiol 56, 45-49 (2006). 618
24 Inoue, K. et al. A natural light-driven inward proton pump. Nat. Commun. 7, 13415 619
(2016). 620
25 Inoue, K. et al. A light-driven sodium ion pump in marine bacteria. Nat. Commun. 4, 621
1678 (2013). 622
26 Melaccio, F. et al. Toward automatic rhodopsin modeling as a tool for high-throughput 623
computational photobiology. J. Chem. Theory Comput. 12, 6020-6034 (2016). 624
27 Pedraza-González, L. et al. Web-arm: A web-based interface for the automatic 625
construction of qm/mm models of rhodopsins. J. Chem. Inf. Model. 60, 1481-1493 626
(2020). 627
28 Aquilante, F. et al. Modern quantum chemistry with [open]molcas. J. Chem. Phys. 152, 628
214117 (2020). 629
29 Zhang, L. & Hermans, J. Hydrophilicity of cavities in proteins. Proteins 24, 433-438 630
(1996). 631
30 Pronk, S. et al. Gromacs 4.5: A high-throughput and highly parallel open source 632
molecular simulation toolkit. Bioinformatics 29, 845-854 (2013). 633
31 Aquilante, F. et al. Molcas 8: New capabilities for multiconfigurational quantum 634
chemical calculations across the periodic table. J. Comput. Chem. 37, 506-541 (2016). 635
32 Rackers, J. A. et al. Tinker 8: Software tools for molecular design. J. Chem. Theory 636
Comput. 14, 5273-5289 (2018).
637
33 Kovalev, K. et al. Structure and mechanisms of sodium-pumping KR2 rhodopsin. Sci. 638
Adv. 5, eaav2671 (2019).
639
34 Webb, B. & Sali, A. Comparative protein structure modeling using modeller. Curr. 640
Protoc. Bioinformatics 54, 5-6 (2016).
641
35 Krivov, G. G., Shapovalov, M. V. & Dunbrack, R. L., Jr. Improved prediction of protein 642
side-chain conformations with SCWRL4. Proteins 77, 778-795 (2009). 643
![Figure 9 Comparison between the QM/MM models of the P219[E, H, Q, R] mutants (orange sticks) and 520](https://thumb-eu.123doks.com/thumbv2/123dokorg/4691391.44267/25.892.137.753.456.763/figure-comparison-qm-mm-models-mutants-orange-sticks.webp)
