COMMUNICATION
1
Enhanced N2 fixation activity by converting Ti3C2 MXenes
nanosheets to nanoribbons
Hua Wei
[a, c], #, Qian Jiang
[b], #,
Claudio Ampelli
[a],
Shiming Chen
[b], Siglinda Perathoner
[a], Yuefeng Liu
[b],* and Gabriele Centi
[a],*
[a] Dr. H. Wei, prof. C. Ampelli, prof. S. Perathoner, prof. G. Centi Dept.s ChimBioFarAm and MIFT,
V.le F. Stagno D’Alcontres 31, 98166 Messina, Italy. E-mail: [email protected]
[b] Dr. Q. Jiang, Dr. S. Chen, prof. Y. Liu
Dalian National Laboratory for Clean Energy, Dalian Institute of Chemical Physics, Chinese Academy of Sciences, 457 Zhongshan Road, Dalian 116023, China.
E-mail: [email protected] [c] Dr. H. Wei
University of Lyon, Institut de Chimie de Lyon, UMR 5265 – CNRS – Université Lyon 1, ESCPE Lyon, Laboratoire de Chimie, Catalyse, Polymères et Procédés (C2P2), Equipe Chimie Organométallique de Surface, Villeurbanne, France
[#] These authors contributed equally to this work.
Supporting information for this article is given via a link at the end of the document.
Abstract: Metal carbides M2C (MXenes) with two-dimensional (2D)
structure have been indicated as promising materials for N2 fixation,
with the activity related to edge planes. We demonstrate instead here that the transformation from a 2D (nanosheets) to a 3D-type nanostructure (nanoribbons), leads to a significant enhancement of the N2 fixation activity, due to the formation of exposed Ti-OH sites. A
linear relationship is observed between ammonia formation rate and amount of oxygen on the surface of Ti3C2 MXene.
MXenes are metal carbide or nitride materials with a two-dimensional (2D) structure, which attracted a large interest recently for a broad range of applications such as materials for energy and environmental applications,1-4and catalysis.5-7In the
latter area, several papers deal on N2 fixation (NRR),8-18a topic of
current large interest to directly produce ammonia from nitrogen.19
Mxene presents the unusual electronic property of the 2D structure and also the unique property of transition metal carbides, such as metallic conductivity, and the hydrophilic nature of their hydroxyl or oxygen terminated surfaces. For these properties there is a large interest on the use of Mxenes as novel NRR electrocatalysts, as emerges also from the state-of-the-art comparison of NRR electrocatalysts (see Supplementary Info). They have properties well comparable with those of the best reported NRR electrocatalysts, with the advantage of a flexible way to tune further their properties, and thus a large potential for further improvement.
Most of studies on MXenes as NRR materials indicated the need to have a 2D nanostructure, with the activity in N2 fixation
attributed generally to edge sites of the nanosheets. Luo et al.,16
for example, indicate the middle Ti at the edge sites as the active sites for NRR. The mechanism proposed involved hydrogenation of undissociated N2 molecules. Gouveia et al.6 considered instead
that N2 dissociation occurs easily on the MXene (0001) surface.
The top site above the metal ions on the surface of MXene nanosheets was also indicated by Wang et al.8 as the sites for
end-on adsorption of N2 which is then hydrogenated, rather than
dissociated. Johnson et al.15 indicated that edge sites of MXene
are involved in NRR reaction and that F functional groups enhance the NRR performance in comparison to O functional groups. Xia et al.,11 on the contrary, indicated that exposed Ti
sites in Ti3C2OH facilitate the electron transfer and promote the
adsorption and activation of dinitrogen. Guo et al.12 suggested
that OH terminal groups of MXene are inactive, indicating thus that a modification of the surface chemical states by introducing Fe heteroatoms is necessary to increase the activity.
Most of the studies based their conclusions mainly on theoretical modelling. However, notwithstanding the discordances in the nature of the active MXene materials for NRR reaction, a common agreement is that a 2D configuration is needed.
2D-type materials are an area of intense research interest for a number of applications in the field of materials for energy, including catalysis.20 On the other hand, it is possible to assemble
and master 2D materials to form other type of 3D-like nanomaterials.21 MXenes nanosheets can be subjected to a
transformation from a 2D to a 3D-like nanostructures.22 This will
allow to clarify the relationship between performances and type of nanostructure. In the specific case of NRR, this method of manipulating nanostructures allows to understand the role and relevance of the presence of a 2D nanostructure on edge or planar bases, by comparing the behaviour of very analogous materials, but having a different nanoshape.
We have thus investigated how the conversion of Ti3C2
nanosheets to 3D-like nanoribbons influence the properties and NRR reactivity to obtain insights about the role of the nanostructure in this reaction providing therefore elements for theoretical modelling to overcome the present discordances on the nature of the active materials and thus allow their better design.
Ti3C2 MXene nanosheets (MNSs) were prepared by HF
etching (in 40% HF solution for 72h) of Ti3AlC2 starting precursor,
followed by centrifugation, washing and drying at 60°C. The obtained MNSs are then treated in 6 M KOH for 72h (sealed container under Ar atmosphere), followed by steps as above.
https://chemistry-europe.onlinelibrary.wiley.com/doi/full/10.1002/cssc.202001719
https://doi.org/10.1002/cssc.202001719
COMMUNICATION
2 Ti3C2 MXene nanoribbons (MNRs) are obtained in this way. The
method of preparation is analogous to that used by Lian et al.23
MNSs and MNRs were dispersed in ethanol containing 10% Nafion (ultrasonic mixing for 90 min), obtaining an homogenous ink which is then deposited by spray drying onto a gas-diffusion layer (GDL). The GDL with the deposited electrocatalyst is then hot pressed to a Nafion membrane. The electrocatalyst is located at the interface between the Nafion membrane and the GDL. The loading of the electrocatalyst resulted 0.2 mg/cm-2.
The electrodes were tested in an electrocatalytic flow reactor, where the hemi-cell for NRR reaction operates without a liquid electrolyte. This type of electrocatalytic reactor is different from the conventional electrocatalytic reactors operating with the electrodes immersed in a liquid electrolyte. The reason is to avoid issues related to low N2 solubility in the electrolyte, and to allow
an easier recovery of the ammonia produced. In fact, NH3 is
recovered directly from the gas outlet of the flow reactor. Details on the preparation of the electrodes, although by using different type of electrocatalysts, and on the characteristics of the electrocatalytic reactor were reported earlier.24-26 Supplementary
Info reports also details about the flow electrocatalytic reactor, the
experimental procedure of testing, the determination of ammonia and other possible products, and the series of control experiments made to verify that ammonia derives effectively from the electrocatalytic reduction of N2.
The scanning electron microscopy (SEM) images (Figure 1a) for Ti3C2Tx (where T= F, OH) after the HF etching, show a
MXene loosely layered 2D structure, indicating the successful exfoliation of Al from the MAX phase (Ti3C2Al). The transparency
of the nanosheet presented in Figure 1b suggests that the likely presence of single layer sheet having a thickness of around 200 nm.27 It is present a monocrystal as shown by diffraction pots of
the selected area electron diffraction (SAED) reported in the inset
of Figure 1b. The HRTEM image (Figure 1c) shows the interlayer
spacing of 1.00 nm corresponding to the (002) plane,28 which is
consistent with the value measured by XRD and with results obtained by Ghidiu et al.29 After Ti
3C2 nanosheets treatment by
KOH, nanoribbons could be well evidenced (Figure 1d). The nanoribbons have a diameter around 16 nm, in agreement also with HRTEM images (Figures 1e and 1f).
Figure 2 Structural characterization of Ti3C2 MNRs, Ti3C2 MNSs, and pristine Ti3AlC2. (a)XRD patterns of Ti3C2 MNRs, Ti3C2 MNSs, and pristine Ti3AlC2. (b-d) XPS spectra of Ti3C2 MNRs and Ti3C2 MNSs in the (b) C 1s, (c) O1s (d) Ti 2p, regions
Figure 1 (a) SEM images of Ti3C2 MNSs (b) Top-view TEM images and electron diffraction patterns of Ti3C2 MNSs. (c) Cross-sectional TEM images of Ti3C2 MNSs. (d) SEM images of Ti3C2 MNRs. (e) TEM images of Ti3C2 MNRs and electron diffraction patterns of Ti3C2 MNRs. (f) HRTEM images of Ti3C2 MNRs, a single MNR with a width of ~ 16 nm, taken from the A position.
528 530 532 534 O 1s 531.7eV 529.7eV Ti3C2 MNSs Ti3C2 MNRs Intens ity (a .u.) Ti-O OH Background Row 531.6eV 530eV x 3
Binding Energy (eV)
280 284 288 292 296 C1 s K2p 1/2 K2p 3/2 C1s Ti3C2 MNSs Ti 3C2 MNRs Inten sity (a.u.)
Binding Energy (eV)
452 454 456 458 460 462 464 466 468 Ti 3C2 MNRs Ti-C Ti2+ Ti3+ TiO2 Ti-F
Binding Energy (eV)
Ti 2p Intens ity (a .u.) Ti 3C2 MNSs x 1.6 a b 10 20 30 40 50 60 (110) (107) (105) (103) (104) (101) (004 ) (002) (002) (002) Ti3AlC2 Ti3C2 MNSs Ti3C2 MNRs Inten sity (a.u .) 2 Theta (degree) c d
COMMUNICATION
3 The conversion of Ti3AlC2 (MAX phase) to Ti3C2 MNSs and MNRs
is confirmed by X-ray diffraction (XRD) (Figure 2a). Compared with the pattern of Ti3AlC2, the most intense peak (104) of Ti3AlC2
disappears and the (002) reflection of MXene shifts from 9.7° to 9.1° broadening at the same time. This is consistent with the expected interlayer spacing expansion in passing from Ti3AlC2 to
Ti3C2 MNSs.30 When the Ti3C2 MNSs is further treated in KOH
solution, the (002) reflection shifts to 7.1° and further broaden, consistently with the further expansion of interlayer spacing.23
The full spectrum XPS and associated elemental analysis
(Supplementary Info, Figure S3) confirm the existence of C, K, O
and F in Ti3C2 MNRs. It also evidenced the large enhancement of
the O content which becomes over twice the initial value after the KOH treatment, indicating that the nanoribbon edges are rich in OH groups.
In the C 1s region (Figure 2b), the characteristic peaks of K2p3/2 at 292.4 eV and K2p1/2 at 295.2 eV are present only in Ti3C2
MNRs, but K presence was not detected in Ti3C2 MNSs neither in
Ti3AlC2.This is consistent with XPS elemental analysis
(Supplementary Info, Figure S3b). This accounts for the
alkalization of MNRs, consistent with XRD measurement. However, the K atoms do not enter in the Ti3C2 MNRs structure to
occupy the anion sites, as confirmed by analysis of the lattice spacing of (002) plane in XRD diffractograms.
After the treatment by KOH, the intensity of the XPS Ti-F peaks decreased markedly (Supplementary Info, Figure S3), while the contents of -OH on the surface increases significantly, indicating that a large amount of -F terminal groups were replaced by hydroxyl groups and consequently the formation of O-terminated Ti3C2 MNRs.31EDX analysis of Ti3C2 MNSs and Ti3C2
MNR samples confirm this indication (Supplementary Info, Figure S4). The comparison of the elemental composition by XPS and EDX (SEM) (Supplementary Info, Figures S3 and S4, respectively) show that after the treatment by KOH, the Ti/C ratio increases owing to the carbon corrosion by KOH. Being XPS detecting the surface composition with a depth less than about 5 nm while the detection depth for SEM is up to about 1μm, the comparison of Ti/C ratios measured by XPS and EDX indicates a preferential surface carbon removal by the KOH treatment. The EDX of MAX phase (Ti3AlC2) and Ti3C2 MNSs (Supplementary
Info, Table S1) indicates also that the oxygen content is similar in
these two samples.
Figure 2c and 2d report the XPS Ti2p and O1s regions for the
Ti3C2 MNRs (top) and MNSs (bottom) samples, respectively.
Deconvolution of the spectra is also reported according to Lian et al.[23] and Halim et al.[32] For Ti
2p region, spectra were
deconvoluted for Ti-C, Ti2+, Ti3+ and TiO
2 components, while for
O1s region spectra were deconvoluted in Ti-O and -OH
components. Figure 2c well indicates that the relative content of TiC decreased after KOH treatment with part of TiC transformed into Ti2+ and Ti3+. This result is well consistent with the increase
of O content commented before. Ti-F component also disappears after the MNSs to MNRs conversion. Figure 2d evidences that the conversion leads to a significant increase in the Ti-O component (note that the spectra of Ti3C2 MNSs are multiplied by a factor
three in intensity).
The electrocatalytic measurements (at room temperature and ambient pressure) were performed in the flow reactor described before operating without a liquid electrolyte in the hemicell where the NRR reaction occurs. The flow of highly pure N2 (further
purified by passing through filters to capture eventual presence of NOx, NH3 and other possible contaminants) is passed through the
electrocatalytic hemicell with the ammonia formed being then recovered from the gas outlet stream by absorption in a 0.001 M H2SO4 solution. The amount of ammonia formed was detected by
a spectrophotometric method reported in detail in the
Supplementary Info. This method is highly sensitive and we
consider preferable and more reliable with respect to alternative methods such as NMR, ion-selective electrodes or mass spectrometry (see Supplementary Info). Supplementary Info also describes the tests made to exclude the formation of hydrazine (N2H4) under our experimental conditions. The protons/electrons
for the NRR reactions derive from water electrolysis occurring in the other hemicell of the electrocatalytic reactor. A Nafion membrane separates the two hemicells (see Supplementary Info).
A series of control tests were made to verify that ammonia forms from the N2 present in the flowing gas-phase and not from
other N-contaminants (see Supplementary Info). These tests include monitoring the change in ammonia formation by switching from N2 to Ar or using labelled nitrogen. By feeding N2 + H2 at
open circuit conditions, it was also verified that the catalytic activity (i.e. not related to electrocatalysis) was negligible. Figure
S2 in the Supplementary Info reports the experimental protocol
for NRR tests used in these experiments, to demonstrate that the detected NH3 derives from the electrocatalytic reduction of N2.
Based on cyclic voltammetry (CV) tests (Figure S6 in the
Supplementary Info), we selected three voltages (in the range
from -0.2V to -0.8V vs RHE) to screen the behaviour of Ti3C2
MNRs. Results are reported in Figure S7 and S8 (Supplementary Info). The highest NH3yield was obtained at −0.5 V vs RHE.
Current density at this voltage is about -1.5 A and remain stable for at least 3h of continuous tests. The current density remains stable also in longer term tests (up to about 10h), showing that the electrocatalyst is stable under these experimental conditions. This result was also in well agreement with CV tests (see
Supplementary Info). At more negative voltage (-0.8 V), the
current density instead decreases from the initial -3.5 A value to about -4.5 A (after 2h), indicating thus an in-situ transformation during the electrocatalytic tests. At a voltage of -0.2 V, the current density (about -0.5 A) is instead low, indicating low catalytic activity. Further tests were thus made at -0.5 V. Data reported refer to the behaviour determined after 3h of continuous tests.
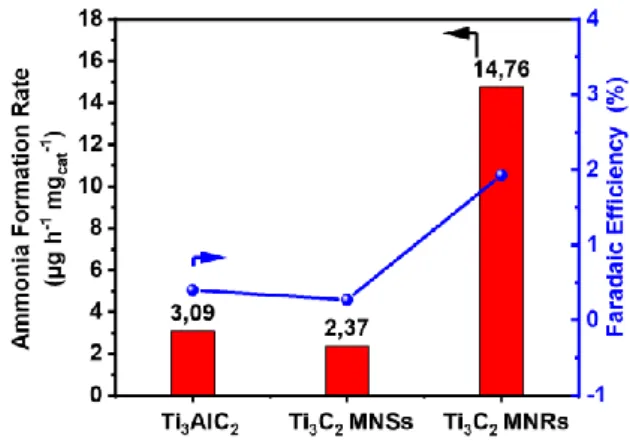
Figure 3 Ammonia formation rate and Faradaic efficiency with different electrodes at −0.5 V vs. RHE after 3 h of electrocatalytic tests at room temperature and ambient pressure.
Figure 3 reports the comparison of the rate of ammonia formation per mg of electrocatalysts for the pristine Ti3AlC2 sample, and
COMMUNICATION
4 MNSs have a quite comparable low activity in NRR, while Ti3C2
MNRs show a more than 5 times higher activity. Faradaic efficiency also increases to about 2% after transformation to nanoribbon. A stable current density was shown for all samples, indicating a stable behaviour at the applied voltage at least for 3h of continuous tests. No significant changes in the sample characteristics were also observed by electron microscopy, XPS and XRD characterization of these materials after the electrocatalytic tests (see Supplementary Info, Figure S7 and S8). The constant CV data during extended cycles also confirm this stability. These results thus show that morphological, structural, surface and reactivity characteristics of Ti3C2 MNRs remain
unchanged at least for 10h of continuous electrocatalytic tests at -0.5V vs. RHE.
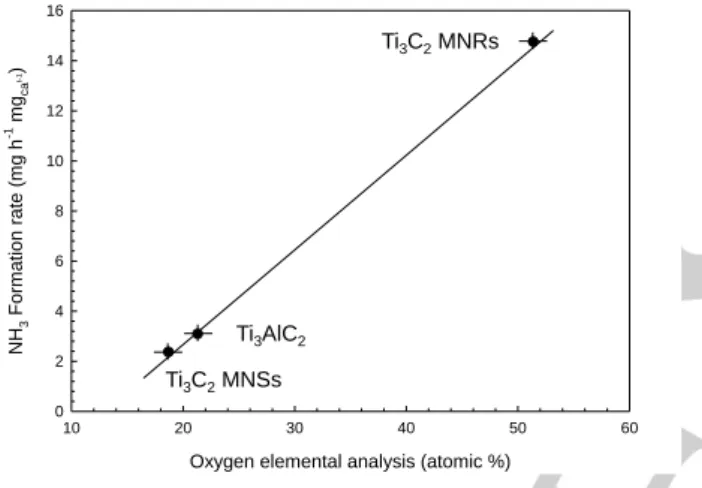
A linear relationship could be observed between the rate of ammonia formation in the three samples reported in Figure 3 and the amount of oxygen on the surface (atomic %) as detected by XPS measurements (Figure 4), suggesting a relationship between these two aspects.
Figure 4 Relationship between ammonia formation rate at −0.5 V vs. RHE and atomic % of oxygen in the surface as measured by XPS.
The relationship presented in Figure 4 agrees (among others) with (i) Xia et al.[11] indications that exposed Ti sites (Ti
3C2OH) are
responsible for the improved electron transfer, adsorption and activation of dinitrogen, (ii) theoretical results of Tang et al.[33] that
exposed Ti atom close to extra oxygen vacancy are responsible for activity in (defective) MXenes electrocatalysts, (iii) Jin et al.[34]
indications that OH-rich MXenes (Ti3C2OH) show high NRR
performances and (iv) Xia et al.[35] result that surface hydroxyl
modification of MXene Ti3C2 facilitates the electron transfer and
the adsorption and activation of dinitrogen. Therefore, this work shows that the transformation from a 2D-like morphology (nanosheets) to a 3D-like morphology (nanoribbons) leads to a large improvement in the NRR activity, due to an enhanced formation of active sites (likely Ti3C2OH) not blocked by F atoms.
To compare these data with literature, Table S2 in
Supplementary Info reports a comparison of reaction conditions,
ammonia formation rate and Faradaic selectivity of selected state-of-the-art literature results on NRR, organized in four classes of electrocatalytic materials: (a) MXenes, (b) modified and composite electrocatalysts based on MXenes, and electrocatalysts based on (c) noble metals or (d) transition metal oxides/sulphide. The comparison shows that particularly with respect to MXenes electrocatalysts, the electrocatalysts reported
here well compares with other published, taking into account of the differences in the operative conditions, and the use here of an electrocatalytic reactor without liquid electrolyte differently from the other cases. Note, in addition, that the scope in this work is not to show record performances, but instead to analyse the role of the conversion from 2D (nanosheet) to 3D-like (nanoribbon) morphology in Ti3C2 MXenes.
For a further comparison, some selected results will be compared here. Luo et al.[16] reported for MXene (Ti
3C2Tx)
nanosheets a maximum Faradic efficiency of 4.62% and a NH3
yield rate of 2.7 μg·h−1·mg
CAT−1 at a best potential of -0.1 vs. RHE.
Xia et al. [11] indicated as best performances (Ti
3C2 with an
increased amount of surface hydroxyl moieties) a yield rate of NH3
of 1.71 μg·h-1·cm-2 with a Faradaic efficiency of about 7%. These
performances were in line with those indicated for analogous samples in the reviews by Sun et al.[36] and Li and Wu.[37] We may
thus conclude that data reported in Figures 3 and 4 are in line with those earlier reported for Ti3C2 nanosheet-type materials, and
thus the results reported here evidence a significant enhancement in NRR activity passing from nanosheet to nanoribbon-type morphology. This is related to the formation of OH-rich Ti3C2 MXene. This is in agreement with previous literature
indications and theoretical studies, but here is for the first time demonstrated the presence of a linear relationship between ammonia formation rate and amount of oxygen on the surface of Ti3C2 MXene.
Conclusions
This result evidences that a 2D (nanosheet) morphology is not necessary in MXene materials to show NRR activity, and a different morphology (nanoribbon), not having the same basal planes and type of edges, show instead an about five-time higher NRR activity. Characterization data indicate that in nanoribbon morphology, there is a preferential formation of exposed Ti-O sites, which various studies have indicated as responsible for improved electron transfer, adsorption, and activation of dinitrogen.[11,34,35] Present data agree with this interpretation, and
evidence for the first time the presence of a linear relationship between ammonia formation rate and amount of oxygen on the surface of Ti3C2 MXene.
Acknowledgements
This work was made in the frame of the ERC Synergy SCOPE (project 810182), NSFC of China (21972140, 91645117 and 21872144), and PRIN 2017 MULTI-e project nr. 20179337R7, which are gratefully acknowledged. The work was also co-funded through a SINCHEM Grant. SINCHEM is a Joint Doctorate programme selected under the Erasmus Mundus Action 1 Programme (FPA 2013-0037). YL acknowledges the finical supports from LiaoNing Revitalization Talents Program (XLYC1907053) and CAS Youth Innovation Promotion Association (2018220).
Keywords: MXenes • N2 fixation • Metal carbides • Nanosheets
• Nanoribbons
Oxygen elemental analysis (atomic %)
10 20 30 40 50 60 NH 3 For m ation rate (m g h -1 m gca t-1) 0 2 4 6 8 10 12 14 16 Ti3C2MNRs Ti3C2MNSs Ti3AlC2
COMMUNICATION
5
References
[1] J. Li, C. Guo, C. M. Li, ChemSusChem 2020,13, 1047.
[2] R. Fang, C. Lu, A. Chen, K. Wang, H. Huang, Y. Gan, C. Liang, J. Zhang, X. Tao, Y. Xia, W. Zhang, ChemSusChem 2020, 13, 1409.
[3] X. Zhan, C. Si, J. Zhou, Z. Sun, Nanoscale Horizons 2020, 5, 235. [4] J. Pang, R. G. Mendes, A. Bachmatiuk, L. Zhao, H. Q. Ta, T. Gemming,
H. Liu, Z. Liu, M. H. Rummeli, Chem. Soc. Rev. 2019, 48, 72.
[5] T. A. Le, N. Q. Tran, Y. Hong, M. Kim, H. Lee, ChemSusChem 2020, 13, 945.
[6] J. D. Gouveia, A. Morales-Garcia, F. Vines, F. Illas, J. R. B. Gomes, Appl.
Catal. B, 2020, 260, 118191.
[7] Z. Fu, N. Wang, D. Legut, C. Si, Q. Zhang, S. Du, T. C. Germann, J. S. Francisco, R. Zhang, Chem. Rev., 2019, 119, 11980.
[8] A. Liu, Y. Yang, X. Ren, Q. Zhao, M. Gao, W. Guan, F. Meng, L. Gao, Q.
Yang, T. Ma, X. Liang, ChemSusChem 2020. Accepted
DOI:10.1002/cssc.202000487.
[9] (a) S. Wang, B. Li, L. Li, Z. Tian, Q. Zhang, L. Chen, X. C. Zeng,
Nanoscale, 2020, 12, 538Y. (b) Cheng, J. Dai, Y. Song, Y. Zhang, Nanoscale, 2019, 11, 18132.
[10] J. D. Gouveia, A. Morales-Garcia, F. Vines, J. R. B. Gomes, F. Illas, ACS
Catal., 2020, 10, 5049.
[11] J. Xia, S.-Z. Yang, B. Wang, P. Wu, I. Popovs, H. Li, S. Irle, S. Dai, H. Zhu,
Nano Energy, 2020, 72, 104681,
[12] Y. Guo, T. Wang, Q. Yang, X. Li, H. Li, Y. Wang, T. Jiao, Z. Huang, B. Dong, W. Zhang, J. Fan, C. Zhi, ACS Nano 2020, DOI: 10.1021/acsnano.0c04284
[13] L. Huang, X. Gu, G. Zheng, Chem, 2019, 5, 15.
[14] Y. Gao, Y. Cao, H. Zhuo, X. Sun, Y. Gu, G. Zhuang, S. Deng, X. Zhong, Z. Wei, X. Li, J.-g. Wang, Catal. Today, 2020, 339, 120.
[15] L. R. Johnson, S. Sridhar, L. Zhang, K. D. Fredrickson, A. S. Raman, J. Jang, C. Leach, A. Padmanabhan, C. C. Price, N. C. Frey, A. Raizada, V. Rajaraman, S. A. Saiprasad, X. Tang, Al. Vojvodic, ACS Catal., 2020, 10, 253.
[16] Y. Luo, G.-F. Chen, L. Ding, X. Chen, L.-X. Ding, H. Wang, Joule, 2019,
3, 279.
[17] J. Zhao, L. Zhang, X.-Y. Xie, X. Li, Y. Ma, Q. Liu, W.-H. Fang, X. Shi, G. Cui, X. Sun, J. Mater. Chem. A, 2018, 6, 24031.
[18] X. Wen, J. Guan, Nanoscale, 2020,12, 8065.
[19] M. Shao, Y. Shao, W. Chen, K. L. Ao, R. Tong, Q. Zhu, I. N. Chan, W. F. Ip, X. Shi, H. Pan, Phys. Chem. Chem. Phys., 2018, 20, 14504. [20] C. J. Heard, J. Čejka, M. Opanasenko, P. Nachtigall, G. Centi, S.
Perathoner, Adv. Mater., 2019, 31, 1801712.
[21] G. Centi, S. Perathoner, Coord. Chem. Rev., 2011, 255, 1480-1498. [22] Z. Wu, T. Shang, Y. Deng, Y. Tao, Q.-H. Yang, Adv. Sci., 2020, 7,
1903077.
[23] P. Lian, Y. Dong, Z.-S. Wu, S. Zheng, X. Wang, S. Wang, C. Sun, J. Qin, X. Shi, X. Bao, Nano Energy, 2017, 40, 1.
[24] S. Chen, S. Perathoner, C. Ampelli, C. Mebrahtu, D. Su, G. Centi, Angew.
Chemie Int. Ed., 2017, 56, 2699.
[25] S. Chen, S. Perathoner, C. Ampelli, C. Mebrahtu, D. Su, G. Centi, ACS
Sustainable Chem. & Eng., 2017, 5, 7393.
[26] (a) S. Chen, S. Perathoner, C. Ampelli, H. Wei, S. Abate, B. Zhang, G. Centi, J. Energy Chem., 2020, 49, 22. (b) S. Chen, S. Perathoner, C. Ampelli, H. Wei, S. Abate, B. Zhang, G. Centi, ChemElectroChem, 2020, DOI:10.1002/celc.202000741
[27] M. Alhabeb, K. Maleski, T. S. Mathis, A. Sarycheva, C. B. Hatter, S. Uzun, A. Levitt, Y. Gogotsi, Angew. Chem. Int. Ed., 2018, 57, 5444. [28] J. B. Li, D. Yan, S. J. Hou, Y. Q. Li, T. Lu, Y. F. Yao, L. K. Pan, J. Mater.
Chem. A, 2018, 6, 1234.
[29] M. Ghidiu, M. R. Lukatskaya, M. Q. Zhao, Y. Gogotsi, M. W. Barsoum,
Nature, 2014, 516, 78.
[30] O. Mashtalir, M. Naguib, V, N. Mochalin, Y. Dall’Agnese, M. Heon, M. W. Barsoum, Y. Gogotsi, Nature Comm., 2013, 4, 1716.
[31] J. Li, X. Yuan, C. Lin, Y. Yang, L. Xu, X. Du, J. Xie. J. Lin, J. Sun, Adv.
Energy Mat., 2017, 7, 1602725.
[32] J, Halim, K. M. Cook, M. Naguib, P. Eklund, Y. Gogotsi, J. Rosen, M.W. Barsoum, Applied Surface Science 2016, 362, 406.
[33] S. Tang, T. Liu, Q. Dang, X. Zhou, X. Li, T. Yang, Y. Luo, E. Sharman, J. Jiang, J. Phys. Chem. Lett. 2020, 11, 5051.
[34] Z. Jin, C. Liu, Z. Liu, J. Han, Y. Fang, Y. Han, Y. Niu, Y. Wu, C. Sun, Y. Xu, Adv. Energy Mater. 2020, 10, 2000797.
[35] J. Xia, S.-Z. Yang, B. Wang, P. Wu, I. Popovs, H. Li, S. Irle, S. Dai, H. Zhu,
Nano Energy 2020, 72, 104681.
[36] J. Sun, W. Kong, Z. Jin, Y. Han, L. Ma, X. Ding, Y. Niu, Y. Xu, Chinese
Chem. Lett., 2020, 31, 953
COMMUNICATION
6
Entry for the Table of Contents
Transformation of Ti3C2 MXenes from 2D (nanosheets) to 3D (nanoribbon) enhances significantly the N2 electrocatalytic conversion