Chapter 7: Durability problems in r.c. structures
7-1
7.
DURABILITY PROBLEMS IN R.C. STRUCTURES
In the previous Chapters the evaluation of the effective seismic demand and capacity of steel reinforcing bars, both in terms of deformation and dissipated energy, was executed allowing the elaboration of a protocol for the production control of the seismic behaviour of reinforcing steels.
According to what already discussed in the Introduction of the present work, many studies in the current literature evidenced the durability problems of r.c. structures, mainly affecting the ductile behaviour of steel reinforcing bars and usually leading to the decrease of their mechanical properties, both in terms of strenght and, in particular, ductility.
In order to assess the ability of corroded steel reinforcing bars to still sustain the ductility demand imposed by earthquakes, experimental tensile and low-cycle fatigue tests were executed on a set of representative steel reinforcements, opportunely pre-corroded in order to represent the effective condition due to the presence of aggressive environmental conditions. In particular, a specific protocol for accelerated corrosion tests was elaborated in the framework of Rusteel project. The results obtained from mechanical tests were elaborated in comparison with the behaviour of uncorroded (reference) steel bars, evidencing the effects of combined seismic action and corrosion phenomena on the ductile properties of reinforcements.
Further investigations are required in order to directly correlate the mechanical capacity of steel bars, evaluated through the execution of experimental tests on corroded specimens, and the seismic ductility demand on reinforcements evaluated using numerical non linear analyses.
7.1
Summary of durability problems and objectives
The durability problems in reinforced concrete structures, as widely presented in the current scientific literature, were generally related to the development of unexpected circumstances not directly taken into account during the design process and leading the structure to premature degradation and failures of structural elements.
According to Apostolopoulos and Papadakis [15], the deterioration of concrete and steel reinforcements was, usually, the result of different physical, chemical and biological processes, globally leading to the cracking of the concrete cover, due to the over passing of the concrete tensile strain capacity, and to the following initiation and propagation of corrosion process.
The most dangerous consequences of corrosion problems in r.c. structures were summarized into four different aspects, i.e. the cracking and spalling of the concrete cover with the following possible buckling of steel reinforcements, the rapid decrease of mechanical properties of concrete and steel reinforcements (in terms of strenght and ductility) leading to the deterioration of the global bearing capacity of the structure and, finally, the loss of the relative bond between steel reinforcement and concrete, due to the opening and the development of concrete cracks [94, 17].
Chapter 7: Durability problems in r.c. structures
7-2
The underestimation of durability problems of r.c. structures was generally due to the fact that, in ordinary environmental conditions, the presence of a correctly sized concrete cover, opportunely defined according to the exposure classes defined by standards [6, 21], was able to provide protection against corrosion. In fact, if the pH of the concrete pore solution ranges around 12.8-13.0, steel bars are generally covered by a thin passive layer protecting them from corrosion attack; afterwards, if the pH of the solution drops below those values, the passive layer breaks, corrosion initiates and propagates allowing the progressive decrease of strength and ductility [14].
As already widely discussed in Chapter 1, two main corrosion processes were individuated as main causes of r.c. structures’ deterioration, i.e. corrosion due to chlorides and corrosion due to carbonation. In the first case, the entry in the concrete cover of chloride ions is responsible for the progressive decrease of the alkalinity of the pore solution, with the following depassivation of the protective layer and the initiation and propagation of corrosion phenomena; generally, the presence of chlorides is connected to localized “pitting” phenomena, and corrosion starts for a ratio free chlorides/hydroxyl concentration (Cl- /OH-) higher than 0.63 [94]. Carbonation process, mainly related to the development of calcium carbonates in presence of CO2, are able to lower the pH of the solution to values
around 9, with the following cracking of the passive layer and development of corrosion phenomena. On the other hand, differently from the case of chloride corrosion, corrosion due to carbonation begins in localized areas of the surface and progressively becomes more uniform mainly depending on crack width.
In any case, the propagation of corrosion phenomena was connected to a visible decrease of the mechanical properties of steel reinforcing bars, revealed by the execution of many experimental monotonic and low-cycle fatigue tests on opportunely corroded specimens [14, 16], as shows by the figure 7.1.
According to what presented by Simioni [94], in the case of pitting corrosion, the reduction of cross area was mainly localized in limited regions of the bar surface, as generally individuated in presence of chloride ions penetration; afterwards, uniformly distributed attack on the bar surface with a relatively limited reduction of bar cross section was the typical effect of a carbonation process. In both cases, the main consequence of corrosion consisted, again, in the reduction of the strenght and of the load bearing capacity of structural elements.
In addition to the problems already presented, several studies in the current literature evidenced unexpected rupture of reinforcing bars, both in the case of samples tested in laboratory [18], and in the case of existing r.c. buildings and infrastructures. In particular, in the case of existing buildings, those effects were often related to the degradation of the mechanical properties of structural components due to time and, in some cases, the brittle cracking was directly related to Hydrogen Embrittlement Stress Cracking (HESC) process. HSEC was
defined as “a damaging mechanism due to the concomitance of tensile stresses and corrosion processes producing atomic hydrogen” and, according to the Institute for Building Materials and Building Structures, HESC was responsible for approximately the 35% of all brittle failures. In particular, sudden collapses became more and more frequent in presence of higher working stresses, because of the ageing and increasing exposure of bridges and multi-storey buildings to chloride environmental conditions or during cyclic loadings and deformations imposed by seismic actions.
Chapter 7: Durability problems in r.c. structures
7-3
a) b)
Figure 7. 1: a) Stress-strain curves for B500St rebars (Apostolopoulos 2006), b) relationship between exposure period and dissipated energy (Apostolopoulos and Michalopoulos 2006).
Moersch [95] evidenced that the hydrogen evolution in the reinforcing steel surface and the following absorption under practical exposure conditions, generally developed during a corrosion reaction. As an example, hydrogen absorption was revealed in the case of carbonation corrosion process, when the pH of the concrete pore solution decreased to values around 9, initiating deterioration process of reinforcements as a consequence of the breaking of the passive protective layer. Moreover, also in the case of the reaching or over-passing of the critical chloride content in correspondence of the surface, an absorption of hydrogen was generally possible. Therefore, the influence of corrosion attacks on mechanical properties of steel reinforcing bars and in particular the effects of Hydrogen needed to be consequently taken into account
According to Moersch [95], the degree of hydrogen absorption depended on the pH value and oxygen content in the concrete pore solution; for oxygen poverty the critical chloride content was between 10 and 100 mol Cl-/mol OH-, for oxygen saturation between 0.1 and 1 mol Cl-/mol OH-. The appropriate hydrogen activities, defined in accordance with the available results of measurement dependently of the oxygen content and pH value, was between 1 and 40. A more exact differentiation was given in the table 7.1.
Table 7. 1: Examples for hydrogen activities, pore solutions and conditions.
Conditions in the concrete pore solution Hydrogen activity Exposure conditions pH-value ≥ 12.6
Maximum content of chlorides in raw materials not exceeded, No additional corrosive substances, no extreme oxygen poverty
0 X0
pH-value ≥ 12.6
extreme oxygen poverty; no oxygen
Maximum content of chlorides in raw materials not exceeded, 0-5 XC1 but only submerged in water 700 600 500 400 300 200 100 0 0.00 0.02 0.04 0.06 0.08 0.10 0.12 0.14 0.16 0.18 0.20 S tr e s s ( M P a ) Strain Uncorroded 10 Days acc. corrosion 45 Days acc. corrosion 90 Days acc. corrosion
2400
ε = ±1.0%
ε = ±2.5%
ε = ±4.0%
Duration of accelerated salt spray exposure (Days)
T o ta l d is s ip a te d e n e rg y d e n s it y ( M P a ) 2200 2000 1800 1600 1400 1200 1000 800 600 400 200 0 10 20 30 40 50 60 70 80 100
Chapter 7: Durability problems in r.c. structures
7-4
No additional corrosive substances pH-value < 12.6
all oxygen contents
Maximum content of chlorides in raw materials not exceeded, No additional corrosive substances
1-10 XC1, XC2, XC3, XC4
pH-value ≥ 12.6
critical chloride content for corrosion exceeded: oxygen poverty: 10-100 mol Cl-/mol OH -oxygen saturation: 0.1-1 mol Cl-/mol OH
-1-15 1-5 XS2 XD1, XD2, XD3, XS3 pH-value < 12.6
critical chloride content for corrosion exceeded: oxygen poverty: 10-100 mol Cl-/mol OH
-oxygen saturation: 0.1-1 mol Cl-/mol OH
-5-45 1-15
XS2
XD1, XD2, XD3, XS3
In the present work, the problems related to the durability of steel reinforcements exposed to corrosion phenomena were deeply considered and investigated in order to individuate the residual mechanical characteristics of corroded steel reinforcing bars (in terms of strength and ductility) and to analyze their ability to withstand the required level of design seismic action.
In order to evaluate the influence of the corrosion phenomena on the mechanical monotonic and cyclic (seismic) behaviour of steel reinforcing bars, experimental tensile and LCF tests were executed on a representative set of steel rebars, opportunely treated in order to reproduce the effective situation due to aggressive environmental conditions. Starting from the analysis of the most common techniques for accelerated corrosion tests, a specific protocol was developed inside Rusteel project for the execution of corrosion laboratory tests on reinforcements.
The experimental results of monotonic and LCF tests on corroded rebars, opportunely elaborated in terms of mass loss and decrease of the mechanical properties, were used in order to assess the ability of corroded rebars to sustain the deformation demand due to seismic action.
Chapter 7: Durability problems in r.c. structures
7-5
7.2
Overview of accelerated corrosion testing procedures
Different methodologies and techniques for the execution of accelerated corrosion tests on steel reinforcing bars are provided by standards and deeply presented in the scientific literature.
The testing conditions artificially reproduced in laboratory are strictly related to the effective environmental situation that wants to be obtained; consequently, a lot of attention shall be used not to over (or under) estimate the reality of external ambient and, in particular, to provide a reliable interpretation of the experimental results derived.
Most common accelerated corrosion techniques, in the following briefly presented, are electrochemical corrosion methods, immersion tests and salt spray chamber tests.
Electrochemical corrosion methods (figure 7.2) were widely used in the past for the
study of uniform, galvanic and localized corrosion, for the analysis of environmental cracking, for the evaluation of protective coatings and films and for many different other aims. The large diffusion of electrochemical techniques was related to their simplicity of application: the corrosion process consisted in an electron flow between anodic and cathodic areas whose speed was directly related to the rates of the oxidation and reduction reactions occurring in correspondence of the surface of the specimen. The monitoring of the electron flow provided the assessment of the kinetics of corrosion process, the thermodynamic tendency to occur spontaneously and the accumulated metal loss registered after the test. Despite their large applicability both for laboratory and in situ applications, some limitations were individuated, mainly related to the representation of relevant environmental conditions, the preparation of alloy and surface and the presence of mechanical perturbations, affecting the possibility to correctly reproduce the desired situation and the execution of the test.
Figure 7. 2: Simplified scheme for electrochemical tests.
Immersion test (including complete, partial and intermittent immersion tests) were
often used for reproducing specific external environmental conditions; despite the apparently simplicity, a lot of parameters need to be opportunely controlled in order to ensure adequate reproducibility of test results (solution composition, temperature, aeration, volume, velocity, and waterline effects, specimen surface preparation, method of immersion of specimens, duration of test, and method of cleaning specimens at conclusion of the exposure).
Potentiostat Apply Potential Measure Current Reference Electrode Working Electrode
(sample) Polarization cell
Electrolyte solution Counter Electrode
Chapter 7: Durability problems in r.c. structures
7-6
In the case of Impressed Current Density tests, reinforced concrete prisms (of dimensions generally equal to 150x250x300 mm, figure 7.3) with embedded steel reinforcing bars are used; a 5.0% of NaCl by weight of cement is generally added to the concrete mix in order to exceed the chloride threshold. The level of impressed current density generally varies between 100 and 500 µA/cm2. The corrosion rate is measured from strains at the faces of the prisms using Digital Image Correlation.
The Impressed Current Density test is a relatively simple and cheap method, able to provide useful information related to the spalling of the concrete cover, the mass loss and the mechanical properties of embedded rebars after extraction from the prisms. On the other hand, no specific codes for the execution of the test are provided, the interpretation of results is mainly optical, the depassivation rate of rebars cannot be evaluated and, moreover, the mass loss is the only parameter that can be directly related to the effective environmental conditions. Several studies, on the other hand, were presented in the current literature dealing with the investigation of the efficiency of impressed current density tests for the artificial reproduction of aggressive environmental conditions, taking into account parameters such as, for example, the variation of the intensity of impressed current [96].
Figure 7. 3: Specimens used for impressed current density tests (El Maaddawy T.A. et al. 2003). American standard ASTM G109 [97], on the other hand, provides a specific protocol for the execution of corrosion tests on steel reinforcements embedded in concrete. The test specimen consists of a small r.c. beam provided by two layers of steel reinforcements, a top layer with only one bar and a bottom layer with two rebars (figure 7.4). The layers are connected electrically with a 10-ohm resistor and the sides of the concrete are sealed with epoxy; a reservoir is secured to the beam to retain liquid on the upper surface. The solution in the reservoir ranges from 3.5-5% NaCl.
The half-cell corrosion potentials for the top and bottom layers are preliminarily measured as an indicator for the onset of corrosion. At the initiation of corrosion, concrete powder samples are obtained by impact-drilling at the level of the top reinforcement to estimate the chloride-ion concentration required for corrosion initiation. Additionally, corrosion current and the corresponding corrosion rates are determined by measuring the voltage drop across the resistor.
100 100 3 0 1 0 0 2 5 0 300 2-No. 10 Rebars (Anode) 6mm Stainless Steel Bar (Cathode) 90 50 150 50 2 Demec Points Each Side
Chapter 7: Durability problems in r.c. structures
7-7
a) b)
Figure 7. 4: Testing samples for accelerated corrosion tests [97, 98].
The main advantages in the application of this methodology for the execution of accelerated corrosion tests consist in the standardization of the testing procedure, the possibility of using steel reinforcements for further mechanical tests and to evaluate the chlorides’ content; afterwards, generally long times of exposure are required and the rate of hydrogen diffusion remains unknown.
As an example, Al Hashemi [18] executed artificial corrosion tests on steel reinforcing bars applying an electric current through the concrete between the reinforcing bars and two stainless steel grids (figure 7.5); the direction of the electric current inside the concrete blocks was applied in order to use the reinforcing bars as an anode and the two stainless steel grids as a cathode. The concrete blocks, characterized by dimensions equal to 200 mm long with a cross section of 200 x56 mm, were reinforced using four bars B450C (Tempcore) and two stainless steel grids, as presented in the figure 7.5. Tests were executed following the procedure provided by ASTM G109 [97].
Figure 7. 5: Testing set up for accelerated corrosion tests following ASTM G109 [18].
Rapid Macrocell procedure is another possible methodology for the execution of
accelerated corrosion tests on both bare or embedded steel reinforcements. The contact surface between the mortar and the bar is used for simulating the effective interface steel bar/concrete in real structures. A single bar, either bare or mortar-clad, is placed in a 1-quart container with a simulated pore solution containing a
5 % NaCl contaminated concrete 500 mm 150 mm 170 mm Tapped End Corroded Length Reinforcing Front view 56 mm 200 mm Steel Bars
5 % NaCl contaminated concrete 20 mm Concrete Cover 20 mm Concrete Cover Side view Embeded Length 200 mm Tapped End 165 mm Stainless Steel Mesh
Chapter 7: Durability problems in r.c. structures
7-8
3.0% concentration of sodium chloride. Two bars are placed in a second 5-quart container and immersed in simulated pore solution with no chlorides added. The solution in both containers places 76 mm of reinforcement below the surface, as presented in the figure 7.6. The solutions in the two containers are connected by a salt bridge and the test specimen in the pore solution containing sodium chloride (anode) is electrically connected through a single 10-ohm resistor to the two specimens in the simulated pore solution (cathode). Air is bubbled into the pore solution surrounding the cathode to ensure an adequate supply of oxygen is present for the cathodic reaction. The air causes some evaporation, which is countered by adding distilled water to this container to maintain a constant volume of solution.
The main advantages of this type of accelerated corrosion test consist in the possibilities of identifying the chloride content, adding CO2 (carbonation), executing
further mechanical tests on the specimens; moreover, lower times are required for the execution of test. Afterwards, the test is not codified by standards, and, once again, the hydrogen content cannot be evaluated.
Many experimental Rapid Macrocell accelerated tests were executed in the current literature, in order to compare the results obtained using different techniques for reproducing the effects of aggressive environmental conditions on reinforcing steel bars [98].
a) b)
Figure 7. 6: Scheme of Rapid Macrocell accelerated corrosion test.
Salt spray tests, widely used during the last century as accelerated tests, allows
the determination of the corrodibility of ferrous and nonferrous metals and the degree of protection due to both inorganic and organic coatings on a metallic base. Many revisions and improvements to the salt spray testing procedures were executed over the years through the efforts of the National Bureau of Standards, ASTM, equipment manufacturers, automotive industry and governmental agencies, eliminating many of the critic variables directly involved in this test procedure. The salt spray (fog) test is actually considered the most useful accelerated laboratory corrosion test for reproducing the effects of marine atmospheres on different metals, with or without protective coatings.
In a typical salt-spray chamber (figure 7.7) wet/dry cycles are introduced; in general, the number of cycles per day varies between 5 and 10. Different approaches can be adopted: in order to represent the “full concrete cover
Chapter 7: Durability problems in r.c. structures
7-9 condition”, a solution of saturated Ca(OH)2 + 0.5M NaCl is generally used for
reproduce a concrete pH in the range 12.5-13.6 and the humidity is generally maintained between 50-60% for the whole duration of the experiment. On the other hand, for recreating the “broken cover condition”, a percentage of NaCl between 3.5 and 5.0% is used simulating a pH of the solution around 5.8-7.2; also in this case, the humidity is kept constant (50-60%) for the whole duration of the experiment.
The main advantage of this procedure consists in the reduced period of exposure, generally varying between 10 and 90 days, and in the fact that ASTM codified a specific protocol for the execution of the test. Moreover, the estimation of mass loss and the hydrogen charging are individuated. Afterwards, the negative aspects of this procedure are mainly related to the fact that the effects of corrosion on the specimens are strongly influenced by the number of wet-dry cycles adopted, the differences among different types of concrete cannot be taken into account and, finally, the chloride threshold is only artificially induced.
a) b)
Figure 7. 7: Example of salt spray chamber.
Many studies in the current literature presented the results of mechanical tests (both monotonic and LCF) on reinforcing bars subjected to preliminarily exposure in salt spray chamber.
As an example, Apostolopoulos and Papadakis [15] conducted salt spray (fog) tests according to the ASTM B117-94 [99] specifications. The salt solution was prepared dissolving 5 parts by mass of sodium chloride (NaCl) into 95 parts of distilled water (pH range between 6.5 and 7.2). The temperature in the zone of the reinforcement material exposed inside the salt spray chamber was maintained at 35 °C (+1.1–1.7)°C. When exposure was completed, th e specimens were washed with clean running water to remove any salt deposits from their surfaces, and then were air dried. The accelerated salt spray corrosion was carried out for 10, 20, 30, 40 and 60 days and then, reinforcing bars (steel grade BSt 420) were subjected to experimental mechanical tests. The same procedure was also adopted by Apostolopoulos et al. [43]for rebars BSt 500.
In relation to the ability of correctly reproduce the aggressive environmental conditions and in particular, to the necessity of moderate required times for the execution of tests, accelerated corrosion procedure in salt spray chamber was adopted inside Rusteel project in order to pre-corrode steel reinforcing bars to be
Chapter 7: Durability problems in r.c. structures
7-10
further subjected to experimental tensile and LCF tests, allowing the individuation of the ductility capacity of corroded specimen and their ability to withstand seismic action.
In the following paragraphs, the procedure adopted for the execution of artificial corrosion tests on steel reinforcements is presented.
7.3
Accelerated corrosion tests in salt spray chamber
7.3.1 Protocol for the execution of accelerated corrosion test
In relation to what already presented, in the framework of Rusteel project a specific protocol for the execution of accelerated corrosion test in salt spray chamber, selected as the more useful and appropriate for the aims of the present work, was elaborated.
Two different exposure periods, respectively equal to 45 and 90 days, were considered for accelerated corrosion tests in salt spray chamber. The protocol was organized into 8 different steps and for the preparation of the specimens, standard ISO 9227 [100] was adopted. In particular, a lot of attention was paid to the preparation of samples, their positioning inside the salt spray chamber and, moreover, to their cleaning after the end of the exposure period for the execution of tensile and LCF tests, as well as for the evaluation of the effective mass loss. Moreover, specific indications were provided for the maintenance of corroded specimens before the execution of mechanical tests in order to allow the exact evaluation of Hydrogen content.
Artificial corrosion tests in salt spray chamber were executed by three different Italian Laboratories, able to specifically reproduce the conditions required by the protocol, in the following individuated as Laboratory 1, 2 and 3.
Description of the Accelerated Corrosion test protocol
− STEP 1:Preparation of the testing apparatus
The chamber, piping and solution tank shall be perfectly cleaned from previous experiments, using at least 120 liters of de-ionized water. The chamber can be considered ready for the execution of tests when the Ph ranges between 5.5 and 6.2. Moreover, the bottom corners of the chamber shall be cleaned by hand using a wet sponge, springer nozzles shall be removed and cleaned for 10 minutes into vinegar and then rinsed with tap water. In general, the prescriptions suggested by ISO 9227:2006 [100] were adopted.
− STEP 2: Loading solution to the chamber
Before the placing of the specimens, at least 50 liters of solution shall be inserted in the chamber and circulate for about 6 hours under the pre-determined wet/dry cycle, in order to stabilize the pH of the chamber itself.
− STEP 3: Preparation of the testing articles
The length of the specimens shall be established following the prescriptions suggested by ASTM or DIN standards, with a minimum gauge length equal to 150 mm. In general, the length of the specimens varies between 500 and 600 mm, in order to allow execution of tensile tests on corroded rebars and the direct individuation of the stress-strain diagram.
Chapter 7: Durability problems in r.c. structures
7-11 In the middle section of the testing article, a high temperature aluminum (non adhesive) tape around the rebar shall be placed; the width of the tape usually varies between 20 mm or, at least, the distance between two following ribs: this length coincides with the unprotected part of the specimen, as presented in figure 7.8a. A tube of diameter at least 40 mm and length similar to that of the testing article shall be filled with natural wax, using the external end cups. The tube with the wax is then placed inside an oven for 20 minutes and a temperature of about 90°. The tube is then removed from the oven and one end cup is opened. Within 30 seconds the testing article shall be placed inside the tube. The article shall be finally removed and allowed for 10 minutes to cool; at the end the tape shall be removed (figure 7.8b).
a) b)
Figure 7. 8: a) The tape between two successive ribs, b) the article without tape.
− STEP 4:Placing the testing articles in the chamber
The testing article shall be placed at an angle of 45-60° to the supports (figure 7.9). During the full duration of the experiment the articles shall be rotated by 90° at least three times a day, in order to prevent the generation of salts, according to what prescribed by ISO 9227:2006 [100].
− STEP 5:Test Execution
At least 8 wet/dry cycles shall be programmed per 24 hours, i.e. 90 minutes dry followed by 90 minutes wet. During the experiment a digital Ph meter is placed inside the chamber; the electrode shall be positioned at a bottom corner where solution is gathered.
− STEP 6:Duration of the test and article handling
Two different exposure periods, respectively equal to 45 and 90 days can be considered. At the end of the test, the specimens shall be rubbed with a fine steel brush and cleaned with tap water, without applicating pressure of the article on the wheel to prevent heat generation. Moreover, specimens that cannot be immediately tested shall maintained at a temperature of about -5° to avoid the loss of the volatile part of hydrogen.
− STEP 7:Measuring of the damage before tensile tests
Cross sectional analysis after the tensile test is prescribed as well as the use of SEM; the notch depth, crack depth and width shall be also measured. Moreover, mass loss and cross section reduction are the most significative parameters to take into account. The measurement of the hydrogen content is also recommended, according to what previously presented.
Chapter 7: Durability problems in r.c. structures
7-12
a) b)
Figure 7. 9: a) Placing of the specimen inside the chamber, b) the articles on the salt spray chamber
− STEP 8:Execution of Mechanical tests on corroded rebars
Upon removal from the freezer the article shall be allowed to reach ambient temperature before the execution of mechanical tests.
Experimental tensile tests shall be executed following the procedure provided by EN 15630:2010 [30], according to what already presented for uncorroded specimens. In particular, to prepare the gripping ends, the wax shall be removed using a butane flame, keeping the temperature to low/moderate values and the wedged shall cleaned from oil residues using an alcohol.
The same preparation procedure is adopted also for rebars to test under LCF, following the protocol opportunely elaborated and presented in Chapter 2.
7.3.2 Individuation of a set of representative steel reinforcing bars
A set of representative steel reinforcements, reduced with respect to the one already presented and considered for mechanical tests in uncorroded condition, was individuated; once again, different steel grade (characteristic yielding strenght Re respectively equal to 400, 450 and 500 MPa), different ductility classes (A, Band C according to Eurocode 8 [1]), different production processes (TempCore, Micro Alloyed, Stretched and Cold Worked bars) and finally different producer (producers 1 and 2) were considered. Table 7.2 summarizes the steel reinforcing bars used in accelerated corrosion tests.
Table 7. 2: Reduced set of representative steel bars subjected to accelerated corrosion tests. Steel grade Ductility Diameter Process Ribs Producer
B400 C 16 TEMP Ribbed Prod.1
B400 C 16 MA Ribbed Prod.2
B400 C 25 MA Ribbed Prod.2
B450 C 12 STR Ribbed Prod.1
B450 C 16 TEMP Ribbed Prod.1
B450 C 25 TEMP Ribbed Prod.2
B500 A 12 CW Ribbed Prod.2
B500 B 12 STR Ribbed Prod.1
B500 B 16 TEMP Ribbed Prod.1
B500 B 25 TEMP Ribbed Prod.2
60° Plastic upper support Plastic upper support Plastic lower support steel rebars
Chapter 7: Durability problems in r.c. structures
7-13
7.4
Mechanical tests on corroded steel reinforcing bars
On the representative set of steel reinforcing bars presented in table 7.2 accelerated corrosion tests were executed according to the protocol presented in the previous paragraph, using, in particular, two different exposure durations, respectively equal to 45 and 90 days, aiming at the individuation of the progressive deterioration of the specimens under aggressive environmental conditions.
On the corroded specimens, mechanical tensile and low-cycle fatigue tests were executed, in order to evaluate the behaviour of corroded steel reinforcements under both monotonic and cyclic (seismic) loading condition.
Tensile tests were executed according to the prescriptions of European standard EN 15630-1:2010 [30] using two servo-hydraulic testing machines (Comazzi and Amsler with 500 kN of maximum load capacity). Low-Cycle Fatigue tests were executed following the protocol opportunely elaborated inside Rusteel project, presented in Chapter 2 and already used for the seismic characterization of uncorroded (reference) steel reinforcing bars. Metallographic investigations were executed, aiming at the individuation of possible modification of the microstructure of the steel, eventual modifications and differences related to the production process used and, in particular, aiming at the evaluation of the hydrogen content and of its influence in the embrittlement of the reinforcement itself.
In the following paragraphs, the results of experimental tests on selected reinforcing bars are presented. The results are subdivided in relation to the diameter of steel reinforcements.
The results are presented in terms of mechanical properties (Re, Rm, Agt and A) and mass loss. In particular, according to Apostolopoulos and Michalopoulos [14] mass loss was evaluated as
i f i M M M −
, in which Mi and Mf respectively the mass of the specimen before and after corrosion tests in salt spray chamber. The expression above presented cannot be directly used for the comparison of the results obtained by different specimens, since the length directly exposed to corrosion (Lcorr) can vary, due to practical operations during the preparation phase. In the following tables results relative to mass loss are presented in terms of difference between the mass before and after corrosion ∆M =Mi −Mf (in grams) and ratio between
∆M and the mass of the effective exposed length before corrosion.
7.4.1 Results of experimental tensile tests
In the following paragraphs, the stress strain curves obtained from experimental tensile tests on corroded steel rebars, after 45 and 90 days of exposure in salt spray chamber, are presented. The red curves represent the stress-strain behaviour of uncorroded specimens. Tables from 7.2 to 7.17 summarize the results of experimental tensile tests and the values of mechanical characteristic obtained from uncorroded specimens are also provided (the same presented in Chapter 2).
Chapter 7: Durability problems in r.c. structures
7-14
7.4.1.1 Bars of diameter 12.0 mm
Steel grade B500A - Cold Worked process
a) b)
Figure 7. 10: Stress-Strain diagrams for steel bars B500A-12-CW-R (producer 2): a) 45 days of corrosion, b) 90 days.
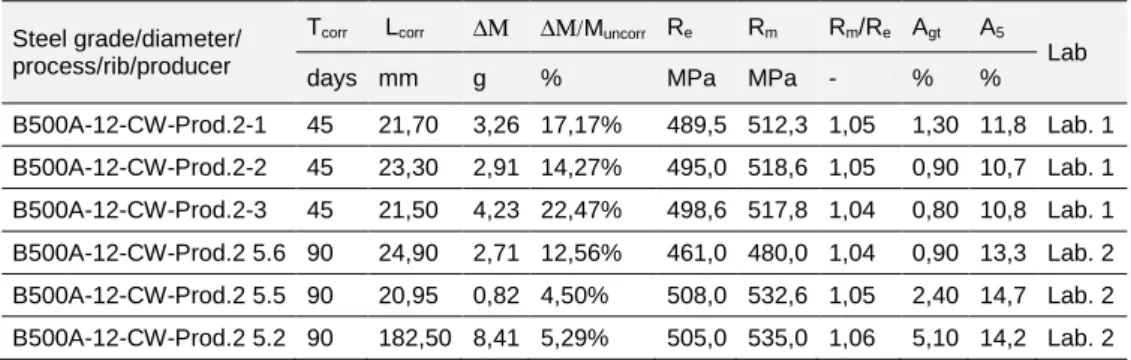
Table 7. 3: Results of experimental tensile tests on corroded specimens B500A Cold Worked, 12 mm. Steel grade/diameter/
process/rib/producer
Tcorr Lcorr ∆Μ ∆Μ/Muncorr Re Rm Rm/Re Agt A5
Lab days mm g % MPa MPa - % %
B500A-12-CW-Prod.2-1 45 21,70 3,26 17,17% 489,5 512,3 1,05 1,30 11,8 Lab. 1 B500A-12-CW-Prod.2-2 45 23,30 2,91 14,27% 495,0 518,6 1,05 0,90 10,7 Lab. 1 B500A-12-CW-Prod.2-3 45 21,50 4,23 22,47% 498,6 517,8 1,04 0,80 10,8 Lab. 1 B500A-12-CW-Prod.2 5.6 90 24,90 2,71 12,56% 461,0 480,0 1,04 0,90 13,3 Lab. 2 B500A-12-CW-Prod.2 5.5 90 20,95 0,82 4,50% 508,0 532,6 1,05 2,40 14,7 Lab. 2 B500A-12-CW-Prod.2 5.2 90 182,50 8,41 5,29% 505,0 535,0 1,06 5,10 14,2 Lab. 2 Table 7. 4: Results of tensile tests on uncorroded specimens B500A Cold Worked, 12 mm (Prod 2). Steel grade/diameter/ process/rib/producer Spec. D A Rm Re Rm/Re A Agt [n°] [mm] [mm2] [MPa] [MPa] [-] [%] [%] B500A-12-CW-R Prod. 2 1 11,87 110,59 588,98 567,70 1,04 20,50 7,45 2 11,95 112,15 589,56 570,31 1,03 19,75 6,60 3 11,93 111,77 581,02 552,93 1,05 16,17 6,40 a) b)
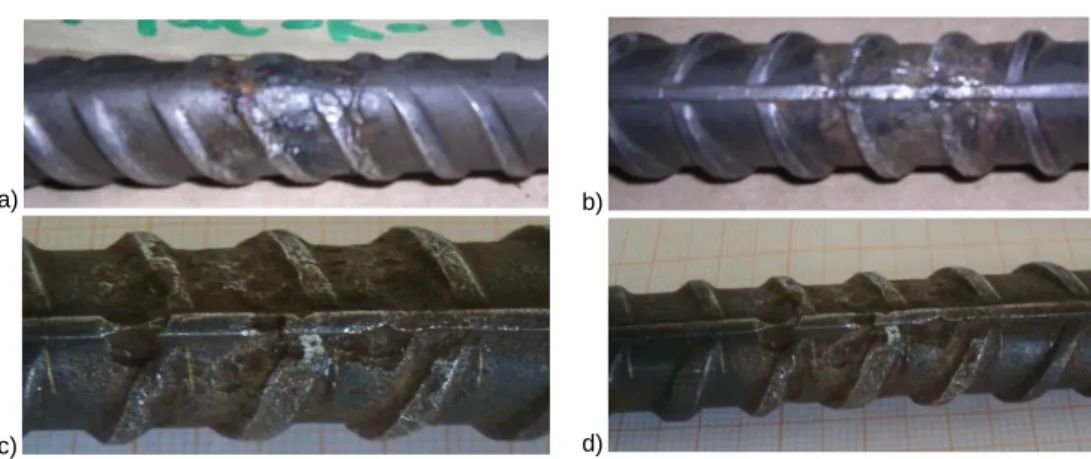
Figure 7. 11: Corroded B500A diameter 12mm, Cold Worked, Prod. 2 for: a) 45 and b) 90 days of exposure. 0 100 200 300 400 500 600 700 0 2 4 6 8 10 12 14 S tr e s s [ M P a ] Strain [%] B500A-12-CW Prod.2 (45 days)
1 2 3 Ref.1 Ref.2 Ref.3 0 100 200 300 400 500 600 700 0 2 4 6 8 10 12 14 S tr e s s [ M P a ] Strain [%] B500A-12-CW-Prod. 2-90 days B500A-12-CW-Prod.2 (5.6) B500A-12-CW-Prod.2 (5.5) B500A-12-CW-Prod.2 (5.2) ref.1 ref.2 ref.3
Chapter 7: Durability problems in r.c. structures
7-15
7.4.1.2 Bars of diameter 16.0 mm
Steel grade B400C – TempCore process
a) b)
Figure 7. 12: Stress-Strain diagrams for steel bars B400C-16-TEMP-R (producer 1): a) 45 days of corrosion, b) 90 days.
Table 7. 5: Experimental tensile tests on corroded specimens B400C TempCore, 16 mm (Prod. 1) Steel grade/diameter/
process/rib/producer
Tcorr Lcorr ∆Μ ∆Μ/Muncorr Re Rm Rm/Re Agt A5
Lab [days] [mm] [g] [%] [MPa] [MPa] [-] [%] [%] B400C-16-TEMP-Prod.1-1 90 30,00 6,26 13,54% 398,4 525,3 1,32 7,1 17,1 Lab. 1 B400C-16-TEMP-Prod.1-2 90 28,40 8,29 18,94% 401,4 520,6 1,30 5,8 14,8 Lab. 1 B400C-16-TEMP-Prod.1-3 90 30,00 5,63 12,18% 404,9 524,8 1,30 6,4 15,1 Lab. 1 B400C-16-TEMP-Prod.1-4 90 24,90 6,11 15,93% 417,3 518,5 1,24 7,5 19,4 Lab. 1 B400C-16-TEMP-Prod.1-5 90 25,25 6,24 16,03% 410,8 - - 7,6 16,8 Lab. 1 B400C-16-TEMP-Prod.1-6 90 25,05 8,34 21,62% 414,6 522,6 1,26 8,0 15,4 Lab. 1 B400C-16-TEMP-Prod.1-1 45 31,00 4,79 10,03% 444,5 550,2 1,24 8,4 19,6 Lab. 1 B400C-16-TEMP-Prod.1-2 45 30,50 6,34 13,48% 449,2 548,2 1,22 7,5 17,5 Lab. 1 B400C-16-TEMP-Prod.1-3 45 31,70 7,47 15,30% 436,5 554,6 1,27 9,0 17,6 Lab. 1 Table 7. 6: Experimental tensile tests on uncorroded specimens B400C TempCore, 16 mm (Prod 1). Steel grade/diameter/ process/rib/producer Spec. D A Rm Re Rm/Re A Agt [n°] [mm] [mm2] [MPa] [MPa] [-] [%] [%] B400C-16-TEMP-R Prod. 1 1 15,86 197,55 547,73 446,92 1,23 24,63 16,35 2 15,91 198,88 544,06 428,14 1,27 29,25 15,55 3 15,65 192,36 560,98 442,67 1,27 29,25 15,55 0 100 200 300 400 500 600 0 2 4 6 8 10 12 14 16 18 20 S tr e s s [ M P a ] Strain [%] B400C-16-TEMP-R Prod.1 (45 days)
1 2 3 Ref.1 Ref.2 Ref.3 0 100 200 300 400 500 600 0% 2% 4% 6% 8% 10% 12% 14% 16% 18% 20% S tr e s s [ M P a ] Strain [%] B400C-16-TEMP-R-Prod.1 90 days 1 2 3 4 6-add Ref.1 Ref.2 Ref.3
Chapter 7: Durability problems in r.c. structures
7-16
a) b)
c) d)
Figure 7. 13: Corroded B450C diameter 16mm, TempCore specimens, Prod. 1: a-b) 45 and c-d) 90 days of exposure.
Steel grade B450C – TempCore process
a) b)
Figure 7. 14: Stress-Strain diagrams for steel bars B450C-16-TEMP-R (producer 1): a) 45 days of corrosion, b) 90 days.
Table 7. 7: Experimental tensile tests on corroded specimens B450C TempCore, 16 mm (Prod. 1) Steel grade/diameter/
process/rib/producer
Tcorr Lcorr ∆Μ ∆Μ/Muncorr Re Rm Rm/Re Agt A5
Lab [days] [mm] [g] [%] [MPa] [MPa] [-] [%] [%] B450C-16-TEMP-Prod.1-1 90 20,90 4,91 14,57 481,4 599,5 1,25 4,3 15,4 Lab. 1 B450C-16-TEMP-Prod.1-2 90 26,40 2,59 6,08 484,4 598,0 1,23 4,4 15,6 Lab. 1 B450C-16-TEMP-Prod.1-3 90 27,20 3,83 8,74 499,8 610,5 1,22 5,1 16,6 Lab. 1 B450C-16-TEMP-Prod.1-4 90 28,85 3,20 6,87 497,4 607,9 1,22 5,7 17,8 Lab. 1 B450C-16-TEMP-Prod.1-5 90 24,20 3,25 8,32 480,9 600,0 1,25 4,1 14,1 Lab. 1 B450C-16-TEMP-Prod.1-6 90 24,50 6,82 17,26 502,8 613,8 1,22 5,5 16,3 Lab. 1 B450C-16-TEMP-Prod.1-1 45 30,50 3,87 7,87 509,2 614,3 1,21 6,9 16,4 Lab. 1 B450C-16-TEMP-Prod.1-2 45 29,50 3,54 7,44 511,2 615,9 1,20 6,2 16,9 Lab. 1 0 100 200 300 400 500 600 700 0 2 4 6 8 10 12 14 16 18 20 S tr e s s [ M P a ] Strain [%] B450C-16-TEMP-R Prod.1 (45 days)
1 2 3 ref.1 Ref.2 Ref. 3 0 100 200 300 400 500 600 700 0% 2% 4% 6% 8% 10% 12% 14% 16% S tr e s s [ M P a ] Strain [%] B450C-16-TEMP-R-Prod.1 90 days 1 2 3 4 5 6-add Ref.1 Ref.2 Ref.3
B450C-16-TEMP-Prod.1-3 45 28,80 5,18
Table 7. 8: Experimental tensile tests on uncorroded specimens B450C TempCore, 16 mm (Prod 1). Steel grade/diameter/ process/rib/producer Spec. D [n°] [mm] B450C-16-TEMP-R Prod. 1(3) 1 16,16 2 16,18 3 16,18 a) c)
Figure 7. 15: Corroded B450C diameter 16mm, TempCore specimens, Prod. 1 days of exposure.
Steel grade B500B – TempCore process
a)
Figure 7. 16: Stress-Strain diagrams for steel bars B500B corrosion, b) 90 days. 0 100 200 300 400 500 600 700 0 2 4 6 8 10 12 14 16 18 S tr e s s [ M P a ] Strain [%] B500B-16-TEMP-R Prod.1 (45 days)
1
2 3 Ref.2 Ref.3
Chapter 7: Durability problems in r.c. structures
7-17 5,18 11,15 504,3 607,9 1,21 5,7 16,4 Lab. 1 xperimental tensile tests on uncorroded specimens B450C TempCore, 16 mm (Prod 1).
A Rm Re Rm/Re A Agt [mm] [mm2] [MPa] [MPa] [-] [%] [%] 16,16 205,00 615,41 517,78 1,19 25,38 13,76 16,18 205,71 610,42 507,42 1,20 25,13 14,96 16,18 205,59 613,65 516,30 1,19 - 11,96 b) d)
Corroded B450C diameter 16mm, TempCore specimens, Prod. 1: a-b) 45 and c-d) 90 days of exposure.
TempCore process
b)
Strain diagrams for steel bars B500B-16-TEMP-R (producer 1): a) 45 days of corrosion, b) 90 days. 18 20 0 100 200 300 400 500 600 700 0% 2% 4% 6% 8% 10% 12% 14% 16% 18% St re s s [ M Pa ] Strain [%] B500B-16-TEMP-R-Prod.1 90 days 1 2 3 4 5 6-add Ref.1 Ref.2 Ref.3
Chapter 7: Durability problems in r.c. structures
7-18
Table 7. 9: Experimental tensile tests on corroded specimens B500B TempCore, 16 mm (Prod. 1) Steel grade/diameter/ process/rib/producer Tcorr Lcorr ∆ days mm g B500B-16-TEMP-Prod.1-1 90 28,60 11,22 B500B-16-TEMP-Prod.1-2 90 30,50 8,34 B500B-16-TEMP-Prod.1-3 90 20,00 14,46 B500B-16-TEMP-Prod.1-4 90 24,45 6,66 B500B-16-TEMP-Prod.1-5 90 26,40 11,80 B500B-16-TEMP-Prod.1-6 90 24,20 6,82 B500B-16-TEMP-Prod.1-1 45 31,50 10,57 B500B-16-TEMP-Prod.1-2 45 31,20 9,62 B500B-16-TEMP-Prod.1-3 45 23,20 9,55
Table 7. 10: Experimental tensile tests on uncorroded specimens B500B TempCore, 16 mm (Prod 1). Steel grade/diameter/ process/rib/producer Spec. d [n°] [mm] B500B-16-TEMP-R Prod. 1(3) 1 16,17 2 16,19 3 16,14 a) c)
Figure 7. 17: Corroded B450C diameter 16mm, TempCore specimens r.c. structures
xperimental tensile tests on corroded specimens B500B TempCore, 16 mm (Prod. 1)
∆Μ ∆Μ/Muncorr Re Rm Rm/Re Agt A5 Lab g % MPa MPa - % % 11,22 24,34% 492,4 607,9 1,23 5,7 14,8 Lab. 1 8,34 16,97% 476,5 596,4 1,25 4,6 15,5 Lab. 1 14,46 44,86% 481,9 610,5 1,27 5,0 14,9 Lab. 1 6,66 16,91% 485,4 606,3 1,25 5,1 15,4 Lab. 1 11,80 27,75% 491,4 603,2 1,23 5,0 15,6 Lab. 1 6,82 17,48% 490,3 605,6 1,24 5,5 16,4 Lab. 1 10,57 20,83% 500,0 610,3 1,22 9,1 19,4 Lab. 1 9,62 19,13% 490,9 604,3 1,23 6,3 17,8 Lab. 1 9,55 25,55% 492,0 604,2 1,23 7,5 16,5 Lab. 1 xperimental tensile tests on uncorroded specimens B500B TempCore, 16 mm (Prod 1).
A Rm Re Rm/Re A Agt [mm] [mm2] [MPa] [MPa] [-] [%] [%] 16,17 205,34 616,28 513,09 1,20 25,63 11,46 16,19 205,86 614,25 513,22 1,20 24,25 13,86 16,14 204,58 611,86 514,04 1,19 23,00 11,36 b) d)
Chapter 7: Durability problems in r.c. structures
7-19
Steel grade B400C – Micro Alloyed process
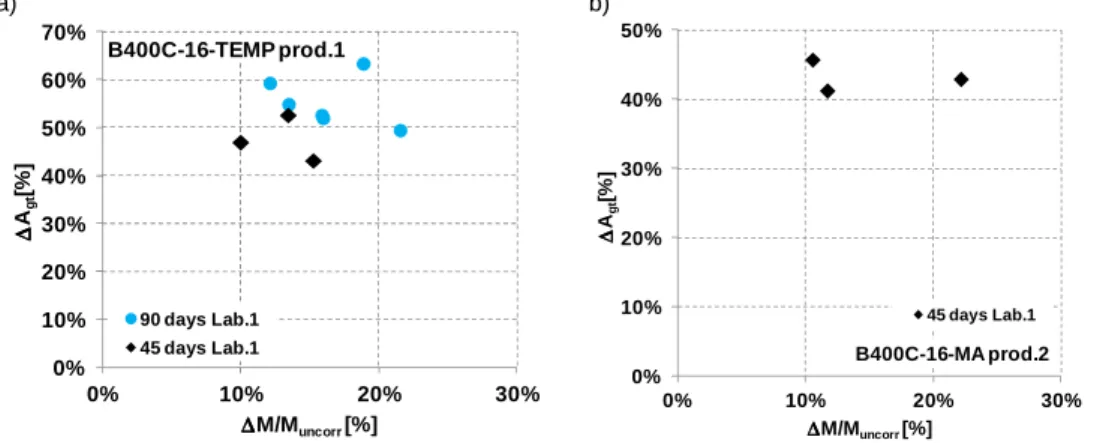
Figure 7. 18: Stress-Strain diagrams for steel bars B400C-16-MA-R (producer 2) for 45 days of corrosion.
Table 7. 11: Experimental tensile tests on corroded specimens B400C Micro Alloyed, 16 mm (Prod. 2) Steel grade/diameter/ Tcorr Lcorr ∆Μ ∆Μ/Muncorr Re Rm Rm/Re Agt A5
Lab process/rib/producer [days] [mm] [g] [%] [MPa] [MPa] [-] [%] [%] B400C-16-MA-Prod.2-1 45 31,50 5,98 11,75% 427,2 562,1 1,32 10,6 21,6 Lab. 1 B400C-16-MA-Prod.2-2 45 29,50 5,05 10,59% 437,5 562,0 1,28 9,8 21,0 Lab. 1 B400C-16-MA-Prod.2-3 45 31,20 11,19 22,19% 424,0 560,0 1,32 10,3 20,9 Lab. 1 Table 7. 12: Experimental tensile tests on uncorroded specimens B400C Micro-Alloyed, 16 mm Prod. 2. Steel grade/diameter/process/ rib/producer Spec. D A Rm Re Rm/Re A Agt [n°] [mm] [mm2] [MPa] [MPa] [-] [%] [%] B400C-16-MA-R Prod. 2 1 16,17 205,48 565,27 434,45 1,30 31,25 17,36 2 16,22 206,66 572,48 436,71 1,31 30,38 18,16 3 16,17 205,39 573,15 432,73 1,32 30,75 18,46 a) b)
Figure 7. 19: Corroded B400C diameter 16mm, Micro Alloyed specimens, Prod. 1 for 45 days of exposure. 0 100 200 300 400 500 600 0 5 10 15 20 25 30 S tr e s s [ M P a ] Strain [%] B400C-16-MA-R Prod.2 (45 days)
1 2 3 ref.1 ref.2 ref.3
Chapter 7: Durability problems in r.c. structures
7-20
7.4.1.3 Bars of diameter 25.0 mm
Steel grade B400C – TempCore process
a) b)
Figure 7. 20: Stress-Strain diagrams for steel bars B400C-25-MA-R (prod. 2) for a) 45 days, b) 90 days of corrosion.
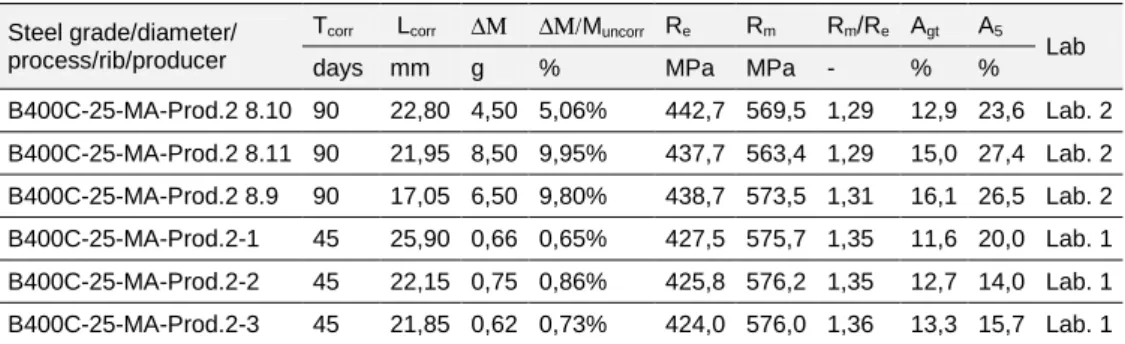
Table 7. 13: Experimental tensile tests on corroded specimens B400C Micro Alloyed, 25 mm (Prod. 2) Steel grade/diameter/
process/rib/producer
Tcorr Lcorr ∆Μ ∆Μ/Muncorr Re Rm Rm/Re Agt A5
Lab days mm g % MPa MPa - % %
B400C-25-MA-Prod.2 8.10 90 22,80 4,50 5,06% 442,7 569,5 1,29 12,9 23,6 Lab. 2 B400C-25-MA-Prod.2 8.11 90 21,95 8,50 9,95% 437,7 563,4 1,29 15,0 27,4 Lab. 2 B400C-25-MA-Prod.2 8.9 90 17,05 6,50 9,80% 438,7 573,5 1,31 16,1 26,5 Lab. 2 B400C-25-MA-Prod.2-1 45 25,90 0,66 0,65% 427,5 575,7 1,35 11,6 20,0 Lab. 1 B400C-25-MA-Prod.2-2 45 22,15 0,75 0,86% 425,8 576,2 1,35 12,7 14,0 Lab. 1 B400C-25-MA-Prod.2-3 45 21,85 0,62 0,73% 424,0 576,0 1,36 13,3 15,7 Lab. 1 Table 7. 14: Experimental tensile tests on uncorroded specimens B400C Micro Alloyed, 25 mm Prod. 2. Steel grade/diameter/
process/ rib/ producer
Spec. d A Rm Re Rm/Re A Agt [n°] [mm] [mm2] [MPa] [MPa] [-] [%] [%] B400C-25-MA-R Prod. 2 1 25,20 498,70 577,35 432,77 1,33 29,20 20,04 2 25,20 498,81 576,05 434,64 1,33 32,00 18,44 3 25,21 499,05 574,98 433,44 1,33 30,40 16,74 0 100 200 300 400 500 600 0 5 10 15 20 25 30 35 40 45 S tr e s s [ M P a ] Strain [%] B400C-25-MA-R Prod. 2 (45 days)
1 2 3 Ref.1 Ref.2 Ref.3 0 100 200 300 400 500 600 0 5 10 15 20 25 30 35 40 45 St re s s [ M Pa ] Strain [%]
B400C-25-MA-R Prod.2 90 days B400C-25-MA-FENO (8.10) B400C-25-MA-FENO (8.11) B400C-25-MA-FENO (8.9) ref.1 ref.2 ref.3
Chapter 7: Durability problems in r.c. structures
7-21
a) b)
c) c)
Figure 7. 21: Corroded B400C 25mm, Micro Alloyed specimens, Prod. 1 for 45 days of exposure.
Steel grade B450C – TempCore process
a) b)
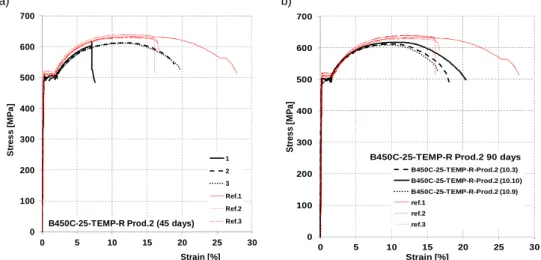
Figure 7. 22: Stress-Strain diagrams for steel bars B450C-25-TEMP-R (prod. 2) for a) 45 days, b) 90 days of corrosion.
Table 7. 15: Experimental tensile tests on corroded specimens B450C TempCore, 25 mm (Prod. 2) Steel grade/diameter/
process/rib/producer
Tcorr Lcorr ∆Μ ∆Μ/Muncorr Re Rm Rm/Re Agt A5
Lab days mm g % MPa MPa - % % B450C-25-TEM-Prod2 10.3 90 21,55 1,0 1,20% 502,4 623,7 1,24 9,6 18,9 2 B450C-25-TEM-Prod2 10.9 90 20,40 1,5 1,89% 515,5 630,8 1,22 10,0 17,8 2 B450C-25-TEM-Prod2 10.10 90 21,55 7,0 8,37% 515,5 628,8 1,22 8,5 19,3 2 B450C-25-TEM-Prod2-1 45 22,00 0,3 0,37% 500,3 622,1 1,24 9,1 19,8 1 B450C-25-TEM-Prod2-2 45 25,50 0,7 0,70% 495,0 618,1 1,25 8,3 19,2 1 B450C-25-TEM-Prod2-3 45 22,90 0,7 0,78% 497,4 617,2 1,24 8,5 18,2 1 0 100 200 300 400 500 600 700 0 5 10 15 20 25 30 S tr e s s [ M P a ] Strain [%] B450C-25-TEMP-R Prod.2 (45 days)
1 2 3 Ref.1 Ref.2 Ref.3 0 100 200 300 400 500 600 700 0 5 10 15 20 25 30 S tr e s s [ M P a ] Strain [%]
B450C-25-TEMP-R Prod.2 90 days B450C-25-TEMP-R-Prod.2 (10.3) B450C-25-TEMP-R-Prod.2 (10.10) B450C-25-TEMP-R-Prod.2 (10.9) ref.1 ref.2 ref.3
Chapter 7: Durability problems in r.c. structures
7-22
Table 7. 16: experimental tensile tests on uncorroded specimens B450C TempCore, 25 mm (Prod. 2) Steel grade/diameter/
process/ rib/ producer
Spec. d A Rm Re Rm/Re A Agt [n°] [mm] [mm2] [MPa] [MPa] [-] [%] [%] B450C-25-TEMP-R Prod. 2 1 25,11 495,35 629,77 505,00 1,25 24,50 14,20 2 25,15 496,71 626,07 507,57 1,23 26,34 15,30 3 25,10 494,69 638,55 501,72 1,27 25,85 14,90 a) b) c) d)
Figure 7. 23: Corroded B450C diameter 25 mm, TempCore specimens, Prod. 2 for: a-b) 45 and c-d) 90 days of exposure.
Steel grade B500B – TempCore process
a) b)
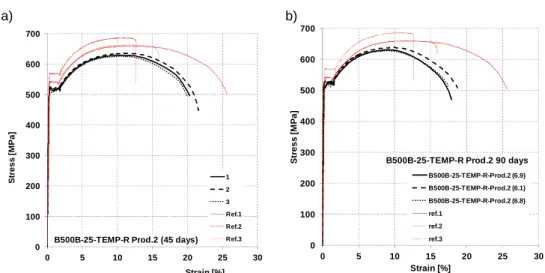
Figure 7. 24: Stress-Strain diagrams for steel bars B500B-25-TEMP-R (prod. 2) for a) 45 days, b) 90 days of corrosion. 0 100 200 300 400 500 600 700 0 5 10 15 20 25 30 S tr e s s [ M P a ] Strain [%] B500B-25-TEMP-R Prod.2 (45 days)
1 2 3 Ref.1 Ref.2 Ref.3 0 100 200 300 400 500 600 700 0 5 10 15 20 25 30 S tr e s s [ M P a ] Strain [%]
B500B-25-TEMP-R Prod.2 90 days B500B-25-TEMP-R-Prod.2 (6.9) B500B-25-TEMP-R-Prod.2 (6.1) B500B-25-TEMP-R-Prod.2 (6.8) ref.1 ref.2 ref.3
Chapter 7: Durability problems in r.c. structures
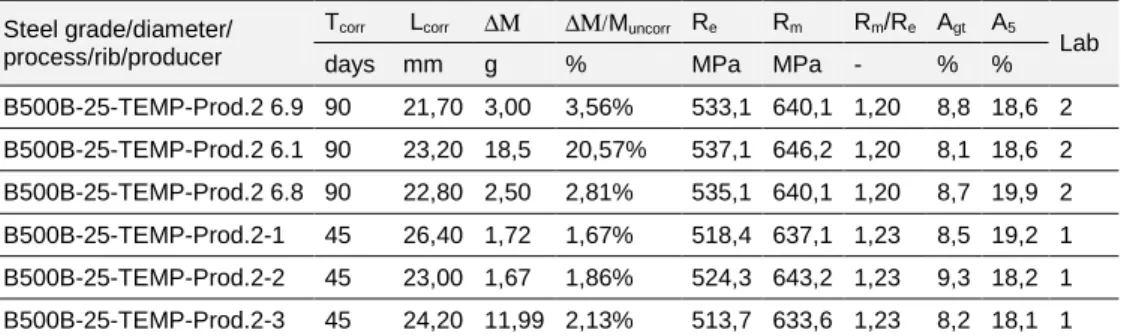
7-23 Table 7. 17: Experimental tensile tests on corroded specimens B500B TempCore, 25 mm (Prod. 2) Steel grade/diameter/
process/rib/producer
Tcorr Lcorr ∆Μ ∆Μ/Muncorr Re Rm Rm/Re Agt A5
Lab days mm g % MPa MPa - % % B500B-25-TEMP-Prod.2 6.9 90 21,70 3,00 3,56% 533,1 640,1 1,20 8,8 18,6 2 B500B-25-TEMP-Prod.2 6.1 90 23,20 18,5 20,57% 537,1 646,2 1,20 8,1 18,6 2 B500B-25-TEMP-Prod.2 6.8 90 22,80 2,50 2,81% 535,1 640,1 1,20 8,7 19,9 2 B500B-25-TEMP-Prod.2-1 45 26,40 1,72 1,67% 518,4 637,1 1,23 8,5 19,2 1 B500B-25-TEMP-Prod.2-2 45 23,00 1,67 1,86% 524,3 643,2 1,23 9,3 18,2 1 B500B-25-TEMP-Prod.2-3 45 24,20 11,99 2,13% 513,7 633,6 1,23 8,2 18,1 1 Table 7. 18: experimental tensile tests on uncorroded specimens B500B TempCore, 25 mm (Prod. 2) Steel grade/diameter/
process/ rib/ producer
Spec. d A Rm Re Rm/Re A Agt [n°] [mm] [mm2] [MPa] [MPa] [-] [%] [%] B500B-25-TEMP-R Prod. 2 1 25,16 497,19 647,18 530,76 1,22 23,92 12,70 2 25,14 496,49 636,23 525,58 1,21 23,29 12,90 3 25,18 497,99 650,07 531,88 1,22 23,58 12,50 a) b) c) d)
Figure 7. 25: Corroded B500B diameter 25mm, TempCore specimens, Prod. 2 for: a-b) 45 and c-d) 90 days of exposure.
Chapter 7: Durability problems in r.c. structures
7-24
7.4.1.4 Evaluation of necking of tested steel reinforcing bars
For all the specimens subjected to monotonic tensile tests, necking of the cross section area was evaluated, considering the two different exposure periods in salt spray chamber.
In the following tables di and df represent the diameter of the cross section area of the bar respectively before and after the rupture of the specimen; in particular, dfmin and dfmax refer to the maximum and minimum diameter, considering the presence of the rib. Ai, Afmin and Afmax are the corresponding cross section areas and Zmin and
Zmax are the necking of the minimum and maximum cross section evaluated as presented by equation 7.2: 100 , 100 max max min min × − = × − = i f i i f i A A A Z A A A Z (7.2)
Looking at the rupture surfaces of rebars, some examples are presented in the figure 7.26-7.27, comparing also different production processes (TempCore and Micro Alloyed).
a) b)
Figure 7. 26: Rupture surfaces of bars a) B400C, 16 Micro Alloyed (prod. 2) and b) B400C, 16 TempCore (prod. 1).
a) b)
Figure 7. 27: Rupture surfaces of bars a) B500B, 16mm TempCore (prod. 1) and b) B460C, 16 mm TempCore (prod. 1).
Table 7. 19: Necking of corroded specimens after 45 days of exposure in salt spray chamber. Steel grade/diameter/
process/producer
di Ai dfmin dfmax Afmin Afmax Zmin Zmax
[mm] [mm2] [mm] [mm] [mm2] [mm2] [%] [%] B500A-12-CW- Prod.2-01 11,87 110,65 8,2 8,4 52,81 55,42 52,27 49,92 B500A-12-CW- Prod.2-02 11,87 110,75 7,9 7,9 49,02 49,02 55,74 55,74 B500A-12-CW- Prod.2-03 11,86 110,40 8,5 8,6 56,75 58,09 48,60 47,38 B400C-16-MA- Prod.2-01 16,13 204,30 11,1 11,3 96,77 100,29 52,64 50,91 B400C-16-MA- Prod.2-02 16,14 204,54 10,8 11,6 91,61 105,68 55,21 48,33 B400C-16-MA- Prod.2-03 16,08 202,97 10,6 11,3 88,25 100,29 56,52 50,59
Chapter 7: Durability problems in r.c. structures 7-25 B400C-16-TEMP- Prod.1-01 15,76 195,02 10,9 12,3 93,31 118,82 52,15 39,07 B400C-16-TEMP- Prod.1-02 15,74 194,62 10,5 11,5 86,59 103,87 55,51 46,63 B400C-16-TEMP- Prod.1-03 15,73 194,34 11,3 13,1 100,29 134,78 48,39 30,65 B450C-16-TEMP- Prod.1-01 16,13 204,41 12,4 13,0 120,76 132,73 40,92 35,07 B450C-16-TEMP- Prod.1-02 16,14 204,50 11,1 12,6 96,77 124,69 52,68 39,03 B450C-16-TEMP- Prod.1-03 16,12 204,06 12,0 12,4 113,10 120,76 44,58 40,82 B500B-16-TEMP- Prod.1-01 16,06 202,47 11,5 12,1 103,87 114,99 48,70 43,21 B500B-16-TEMP- Prod.1-02 16,07 202,81 11,9 12,2 111,22 116,90 45,16 42,36 B500B-16-TEMP- Prod.1-03 16,07 202,75 11,6 12,6 105,68 124,69 47,87 38,50 B500B-25-TEMP- Prod.2-01 25,15 496,78 17,5 19,7 240,53 304,81 51,58 38,64 B500B-25-TEMP- Prod.2-02 25,15 496,79 17,8 19,5 248,85 298,65 49,91 39,88 B500B-25-TEMP- Prod.2-03 25,08 494,14 17,5 19,0 240,53 283,53 51,32 42,62 B450C-25-TEMP- Prod.2-01 25,12 495,50 18,5 20,1 268,80 317,31 45,75 35,96 B450C-25-TEMP- Prod.2-02 25,11 495,40 17,5 19,9 240,53 311,03 51,45 37,22 B450C-25-TEMP- Prod.2-03 25,11 495,40 17,5 19,7 240,53 304,81 51,45 38,47 B400C-25-MA- Prod.2-01 25,20 498,68 - - - - B400C-25-MA- Prod.2-02 25,20 498,66 17,3 18,0 235,06 254,47 52,86 48,97 B400C-25-MA- Prod.2-03 25,20 498,69 16,5 18,2 213,82 260,16 57,12 47,83
Table 7. 20: Necking of corroded specimens after 90 days of exposure in salt spray chamber. Steel grade/diameter/
process/producer
di Ai dfmin dfmax Afmin Afmax Zmin Zmax
[mm] [mm2] [mm] [mm] [mm2] [mm2] [%] [%] B500A-12-CW- Prod.2 (5.6) 11,81 109,61 8,7 59,4 45,8 B500A-12-CW- Prod.2 (5.5) 11,86 110,52 8,2 52,8 52,2 B500A-12-CW- Prod.2 (5.2) 11,79 109,18 8,5 56,7 48,0 B400C-16-TEMP-Prod.1-01 15,74 194,58 12,7 13,5 126,68 143,14 34,90 26,44 B400C-16-TEMP- Prod.1-02 15,72 194,09 11,6 13,0 105,68 132,73 45,55 31,61 B400C-16-TEMP- Prod.1-03 15,75 194,76 11,0 12,9 95,03 130,70 51,21 32,89 B400C-16-TEMP- Prod.1-04 15,74 194,66 11,0 13,0 95,03 132,73 51,18 31,81 B400C-16-TEMP- Prod.1-05 15,74 194,61 12,8 13,5 128,68 143,14 33,88 26,45 B400C-16-TEMP- Prod.1-06 15,72 194,05 11,5 12,0 103,87 113,10 46,47 41,72 B450C-16-TEMP- Prod.1-01 16,12 204,14 10,8 12,5 91,61 122,72 55,12 39,88 B450C-16-TEMP- Prod.1-02 16,15 204,73 11,2 12,3 98,52 118,82 51,88 41,96 B450C-16-TEMP- Prod.1-03 16,13 204,42 11,2 12,9 98,52 130,70 51,80 36,06 B450C-16-TEMP- Prod.1-04 16,14 204,59 9,9 11,5 76,98 103,87 62,38 49,23 B450C-16-TEMP- Prod.1-05 16,14 204,57 11,2 12,4 98,52 120,76 51,84 40,97 B450C-16-TEMP- Prod.1-06 16,10 203,62 11,2 12,6 98,52 124,69 51,62 38,76 B500B-16-TEMP- Prod.1-01 16,05 202,28 11,2 11,7 98,52 107,51 51,30 46,85 B500B-16-TEMP- Prod.1-02 16,08 203,07 11,0 12,2 95,03 116,90 53,20 42,43
Chapter 7: Durability problems in r.c. structures 7-26 B500B-16-TEMP- Prod.1-03 16,02 201,44 11,2 12,5 98,52 122,72 51,09 39,08 B500B-16-TEMP- Prod.1-04 16,10 203,50 10,7 12,5 89,92 122,72 55,81 39,70 B500B-16-TEMP- Prod.1-05 16,04 202,14 11,4 11,7 102,07 107,51 49,51 46,81 B500B-16-TEMP- Prod.1-06 16,05 202,42 11,9 12,1 111,22 114,99 45,05 43,19 B500B-25-TEMP- Prod.2 (6.9) 25,09 494,58 17,4 18,8 237,79 277,59 51,92 43,87 B500B-25-TEMP- Prod.2 (6.1) 24,98 489,96 15,9 18,8 198,56 277,59 59,47 43,34 B500B-25-TEMP- Prod.2 (6.8) 25,13 495,87 16,9 19,5 224,32 298,65 54,76 39,77 B450C-25-TEMP- Prod.2 (10.3) 25,09 494,40 17,9 19,9 251,65 311,03 49,10 37,09 B450C-25-TEMP- Prod.2 (10.9) 25,10 494,62 15,8 17,9 196,07 251,65 60,36 49,12 B450C-25-TEMP- Prod.2 (10.10) 25,05 492,99 17,4 20,0 237,79 314,16 51,77 36,28 B400C-25-MA- Prod.2 (8.10) 25,13 495,99 17,4 18,8 237,79 277,59 52,06 44,03 B400C-25-MA- Prod.2 (8.11) 25,08 493,87 15,9 18,8 198,56 277,59 59,80 43,79 B400C-25-MA- Prod.2 (8.9) 25,08 494,22 16,9 19,5 224,32 298,65 54,61 39,57 As visible from tables 7.19 and 7.20, in general the necking of the cross section areas of the rebars after 45 and 90 days of exposure were similar, with some exceptions. In the case of steel bars B450C and B500B diameter 16 mm (TempCore process), the average reduction of the cross section was quite the same after 45 and 90 days, passing from 42.2% to 47.63% in the case of rebars B450C and from 44.30% to 47.0% in the case of B500B.
Similar values were individuated also in the case of steel reinforcements of diameter 25 mm (steel grade B450C and B500B), while big differences were found in the case of steel bars of small diameter: in the case B500A Cold Worked (diameter 12 mm) the cross section reduction passed from the 51.61% (45 days of exposure) to the 74.33% (90 days). In this last case, the salt spray chamber used was not the same (Laboratories 1 and 2) and the high reduction of the cross section was confirmed by very low values of the elongation to maximum load. Some comparisons were made also with reference to the values of the cross section reduction obtained from uncorroded specimens. For example, table 7.21 provides the values obtained from steel rebars provided by producer 2; as visible, no big differences were individuated, with average percentage values of the cross section reduction of about 45-50% with the exception of bars B500A (12 mm, Cold Worked) for which a reduction of about 60% was evidenced.
At the same time, it’s necessary to underline that the values presented in the tables between 7.19 and 7.21 need to be implemented with other values in order to provide a complete and exhaustive scenario of the results of experimental mechanical tests on corroded specimens.
Table 7. 21: Evaluation of the necking of uncorroded specimens (Producer 2). Steel grade/diameter/
process/producer
di Ai dfmin dfmax Afmin Afmax Zmin Zmax
[mm] [mm2] [mm] [mm] [mm2] [mm2] [%] [%]
B500A-12-CW Prod. 2-01 11,91 111,34 6,95 37,94 7,40 43,01 65,92 61,37 B500A-12-CW Prod. 2-02 11,91 111,34 7,05 39,04 7,35 42,43 64,94 61,89 B500A-12-CW Prod. 2-03 11,91 111,34 7,13 39,93 7,46 43,71 64,14 60,74 B400C-16-MA Prod. 2-01 16,14 204,59 10,31 83,48 11,71 107,69 59,20 47,36
Chapter 7: Durability problems in r.c. structures 7-27 B400C-16-MA Prod. 2-02 16,16 205,10 10,26 82,67 11,50 103,87 59,69 49,36 B400C-16-MA Prod. 2-03 16,14 204,59 10,84 92,29 11,60 105,68 54,89 48,35 B450C-25-TEMP Prod. 2-01 25,15 496,82 17,15 230,99 20,10 317,30 53,51 36,13 B450C-25-TEMP Prod. 2-02 25,11 495,03 17,33 235,87 18,95 282,03 52,35 43,03 B450C-25-TEMP Prod. 2-03 25,16 497,32 16,20 206,11 18,66 273,46 58,56 45,01 B500B-25-TEMP Prod. 2-01 25,15 496,82 17,10 229,65 18,96 282,33 53,78 43,17 B500B-25-TEMP Prod. 2-02 25,20 498,60 16,67 218,25 18,71 274,93 56,23 44,86 B500B-25-TEMP Prod. 2-03 25,16 497,32 16,60 216,42 18,80 277,58 56,48 44,18 B400C-25-MA Prod. 2-01 25,24 500,38 15,24 182,41 17,22 232,89 63,55 53,46 B400C-25-MA Prod. 2-02 25,25 500,89 15,69 193,34 18,26 261,87 61,40 47,72 B400C-25-MA Prod. 2-03 25,29 502,17 16,37 210,46 18,47 267,92 58,09 46,65
7.4.1.5 Evaluation of the hydrogen content on corroded bars
Metallographic investigations and hydrogen measurement tests were executed on several specimens belonging to different steel grades after 90 days of exposure to chloride environment in salt spray chamber. The Hydrogen content was measured by hot extraction method using a LECO DH603 hydrogen determinator apparatus. The obtained results are presented in table 7.22.
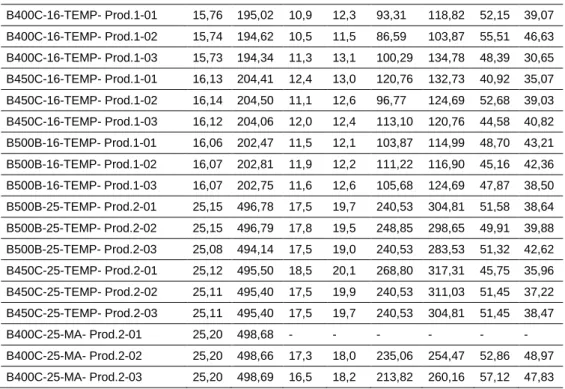
Moreover, the fractographic analysis of post tensile specimens was conducted by SEM microscope. Some examples of Micrographs obtained for TempCore steel reinforcements diameter 16 mm (B400C, B450C, B500B) are presented in the figure 7.28.
Table 7. 22:Hydrogen content of tested corroded steel reinforcements. Specimen (after 90 days of corrosion) H concentration (ppm) Laboratory
B400C-25-MA Prod.2 (8.10) 0,2 Laboratory 2
B400C-25-MA Prod.2 (8.9) 0,2 Laboratory 2
B400C-25-MA Prod.2 (8.11) 0,2 Laboratory 2
B450C-25-TEMP Prod.2 (10.10) 0,6 Laboratory 2
B450C-25-TEMP Prod.2 (10.9) 0,7 Laboratory 2
B450C-25-TEMP Prod.2 (10.3) 0,6 Laboratory 2
B500B-25-TEMP Prod.2 (6.1) 0,7 Laboratory 2
B500B-25-TEMP Prod.2 (6.8) 1,1 Laboratory 2
B500B-25-TEMP Prod.2 (6.9) 0,5 Laboratory 2
B400C-16-TEMP-R-Prod.1 0,2 Laboratory 1
B500B-16-TEMP-R-Prod.1 0,5 Laboratory 1
Chapter 7: Durability problems in r.c. structures
7-28
Figure 7. 28: Micrographs of fracture surface of the tested tempcore steels: (a) skin; (b) B450C-16-TEMP-RIVA skin; (c) B400C
(e) B450C-16-TEMP-RIVA core; (f) B400C
All the tested TempCore specimens revealed a ductile fracture mod some fragile areas were individuated
(Producer 1).
The measured Hydrogen concentration levels probably not critical for embrittlement
in order to better understand the Hydrogen influence on fracture mechanisms in the corroded bars.
7.4.2 Considerations on the results of tensile tests
Tensile tests on corroded steel specimens, according to what already presented in the current literature [16, 17], evidenced a progressive
properties of steel reinforcing bars, especially for what concerns the ductility of the bar, expressed in terms of elongation to maximum load (A
Taking into account all the tests executed in relation t specimens, some considerations were
ductility and the corresponding mass loss due to the exposure in salt spray chamber.
In the case of steel grade B500A (Cold Worked process)
evidenced a strong decrease of the elongation to maximum load,
initial average value of 6.82% (mean value coming from experimental tests on three different specimens) to values equal to 1.30%, 0.90% and 0.80% and 0.90%, 2.40% and 5.10% respectively after 45 and 90 days in salt spray chamber (tables 7.3 and 7.4). As visible from the figure 7.2
the exposed length of the sample was
corrosion period equal to 45 days; on the other hand, period, lower values (varying between
Looking at the effective damages on the rebars, in the case of specimen (Cold Worked) n°5.2 the corrosion deterioration
(equal to 182 mm, probably due to some detachment of the r.c. structures
Micrographs of fracture surface of the tested tempcore steels: (a) B500B-16-TEMP-RIVA RIVA skin; (c) B400C-16-TEMP-RIVA skin; (d) B500B-16-TEMP-RIVA sore;
RIVA core; (f) B400C-16-TEMP-RIVA core.
specimens revealed a ductile fracture modality, even if were individuated in the tested sample B450C-16-TEMP The measured Hydrogen concentration levels for the considered steel grades were not critical for embrittlement. Further investigations are obviously needed o better understand the Hydrogen influence on fracture mechanisms in the
on the results of tensile tests
Tensile tests on corroded steel specimens, according to what already presented in evidenced a progressive decrease of the mechanical properties of steel reinforcing bars, especially for what concerns the ductility of the bar, expressed in terms of elongation to maximum load (Agt).
Taking into account all the tests executed in relation to the diameter of the were made with reference to the decrease of mass loss due to the exposure in salt spray In the case of steel grade B500A (Cold Worked process), bars of diameter 12 mm evidenced a strong decrease of the elongation to maximum load, dropping from an initial average value of 6.82% (mean value coming from experimental tests on three different specimens) to values equal to 1.30%, 0.90% and 0.80% and 0.90%, 0% respectively after 45 and 90 days in salt spray chamber (tables figure 7.29a, the mass loss measured in relation to was varied between 17 and 22% in the case of ; on the other hand, for 90 days of exposure varying between 4.29% and 12.57%) were individuated. Looking at the effective damages on the rebars, in the case of specimen B500A-12
the corrosion deterioration was diffused on a higher length (equal to 182 mm, probably due to some detachment of the covering wax during