Results
Socio-Demographic and other descriptive data for our sample are reported in table 1 and 2:
Table 1 - Socio-demographic Data (and analysis clusters-”groups”) n=80 Table 1 - Socio-demographic Data (and analysis clusters-”groups”) n=80 Table 1 - Socio-demographic Data (and analysis clusters-”groups”) n=80 Table 1 - Socio-demographic Data (and analysis clusters-”groups”) n=80
Mean (SD) Minimum Maximum
Age 43,5 (11,5) 20 67
Gender Percentage Percentage
Male 33,8% Female 66,3%
Children Percentage Parenthood Percentage
None 47,5 Yes 47,5 1 21,3 2 23,8 3 2,5 No 52,5 4 3,8 7 1,3
Marital Status Percentage Marital Class Percentage
Single 28,8 Alone/Single 37,5 Married 58,8 common-law couple 3,8 Separated 2,5 Couple 62,5 Divorced 3,8 Widowed 2,5
Education Degree Percentage Education Groups Percentage
None 1,3 Non-academic 90
Primary 7,5 Academic 10
Lower Secondary 35,0
Upper Secondary 46,3 Mandatory 44
Bachelor/Master Degree 8,8 High School and Academic 56,3 Doctoral/Master Degree 1,3
Occupational Status Percentage Occupation Groups Percentage Retired 8,8
Housewife/Student 20,0 Jobless 35
Employed 65,0 Working 65
Unemployed 6,3
Table 2 - Obesity and Comorbidities (n=80) Table 2 - Obesity and Comorbidities (n=80) Table 2 - Obesity and Comorbidities (n=80) Table 2 - Obesity and Comorbidities (n=80)
Comorbidity/Complication Percentage Comorbidity/Complication Percentage
Hypertension 43 Orthopedic 18
Dyslipidemia 31 Gynaecologic/Andrologic Conditions
16
Diabetes Type 2 21 Nefropathy 10
Metabolic Syndrome 38 Hyperuricemia 9
Gastroenterologic 73 Osteopenia/Osteoporosis 9
Steatosis 60 Oncologic History 8
Cardiocirculatory 45 CNS 4
Thyreopathy 31 Rheumatologic conditions 3
OSAHS/Restrictive syndrome
18 PNS 1
Mean BMI (Kg/m2) SD Minimum (Kg/m2) Maximum (Kg/m2)
45 7,65 31 77
Obesity Grade Percentage Obesity Class Percentage
I 3 Moderate (grade I +II) 23
II 20
III 54 Severe/Morbid (grade III) 54
IV 21
V 3 Super/Monstrous
(grade IV+V)
24
Psychiatric Diagnosis
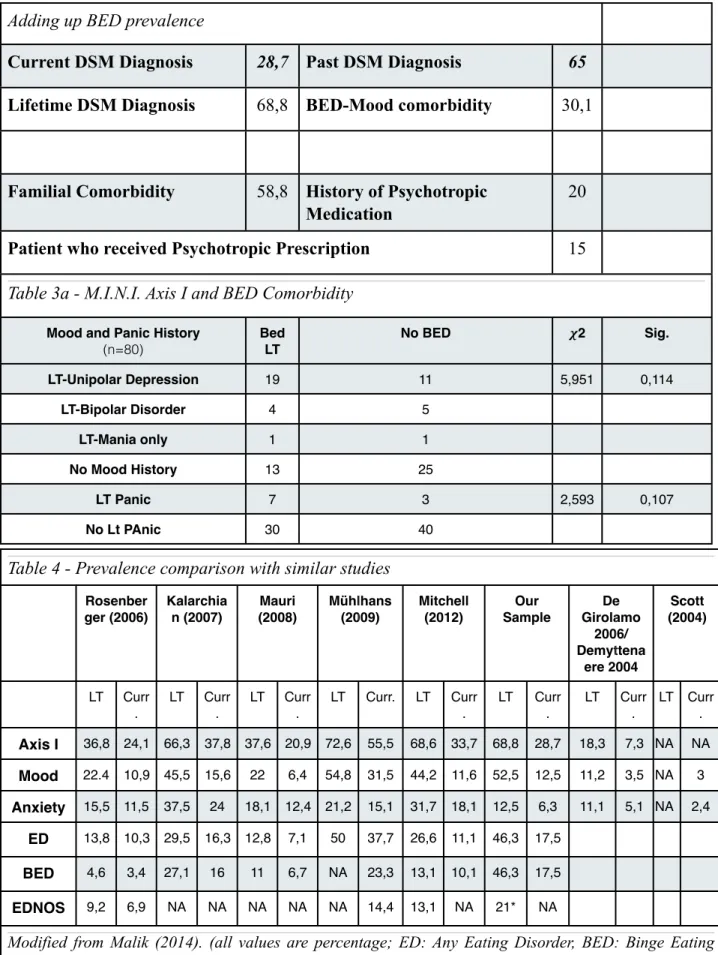
Prevalence of single psychiatric diagnosis is reported in table 3. It is relevant to point out that every subject with a MINI diagnosis results to suffer from a lifetime mood disorder. Current, Past and Overall Lifetime prevalence of psychiatric disorders rise if BED prevalence data are considered, as shown at the bottom of this table.
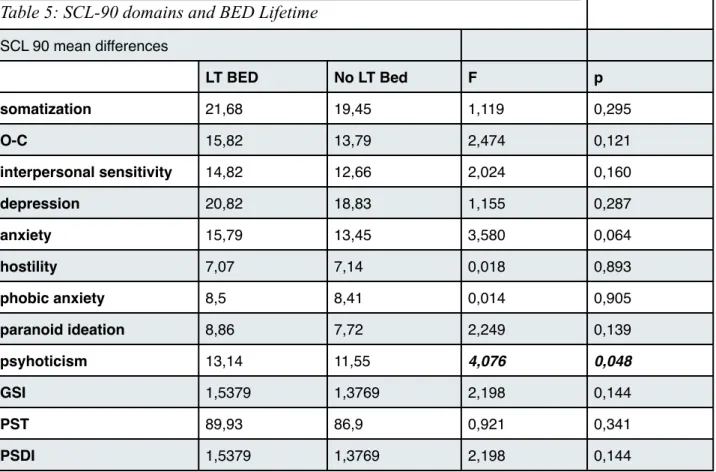
In table 4 we see a list of prevalence data by DSM-IV-TR diagnostic categories across different studies, including two general population surveys by De Girolamo and Scott {Malik:2014wx. Comparison with the latter shows a clearly higher current and lifetime prevalence of both mood and general axis I disorders in bariatric surgery candidates when compared to the general population. Our data, when looking at MINI results, show a prevalence of dsm disorders slightly lesser in comparison to literature data (Mauri et al., 2008; Pull, 2010; Wadden et al., 2007). As we already pointed out, the inpatient status of our subjects implies a previous evaluation by at least one expert bariatric surgeon or methabolic/internal medicine specialist: this would have resulted in exclusion of overtly less compliant subjects and, as well, of those bearing severe psychiatric conditions, ; this point alone could well explain the observed difference with other studies.
When we add data from diagnostic interviews and clinical diagnosis of BED, these figures shift towards a higher current prevalence rate of 28,7 %, similar to (and higher than some) literature results (Kalarchian et al., 2007; Mauri et al., 2008; Mitchell et al., 2012; Rosenberger et al., 2006). Looking to lifetime prevalence, again we can find a clean difference between MINI scores, showing a lifetime prevalence of 52,5% and a total DSM prevalence rate of 68,8%. This observation is in line with US and German surveys (Malik et al., 2014). BED prevalence, estimated by DSM criteria
and confirmed by specific items of the Boston Interview (see above), results higher than literature data
Table 3a - Psychiatric Diagnosis and Therapy (n=80) Table 3a - Psychiatric Diagnosis and Therapy (n=80) Table 3a - Psychiatric Diagnosis and Therapy (n=80) Table 3a - Psychiatric Diagnosis and Therapy (n=80)
MINI 5 Sub Categories % (n)
MINI 5 Sub Categories %
Current Major Depressive Episode
2,5 Lifetime (Hypo)Mania 15
Current Dysthimia 10 Lifetime Unipolar Depression 37,5 Current Hypomania/Mania 0 Lifetime Bipolar Disorder 11,3 Past Major Depressive
Episode(s)
42,5 Negative Mood Disorder History 47,5
Past Hypomania 13,8 Current sub-threshold Panic 6,3
Past Mania 1,3 Panic Disorder History 12,5
Lifetime Depression 48,8 Alcohol abuse, current 1,3
Lifetime Mood History: % %
Bipolar Disorder 9 Manic Epsiodes 3,8
Major Recurrent (unipolar?) Depression
37,5 No Mood History 47,5
Lifetime Panic 12,5
Current BED 17,5 Past BED 42,5
Lifetime BED 46,3
No MINI psychiatric History 47,5 At least 1 MINI LT Diagnosis (always Mood History)
52,5
Adding up BED prevalence Adding up BED prevalence Adding up BED prevalence Adding up BED prevalence
Current DSM Diagnosis 28,7 Past DSM Diagnosis 65
Lifetime DSM Diagnosis 68,8 BED-Mood comorbidity 30,1
Familial Comorbidity 58,8 History of Psychotropic Medication
20
Patient who received Psychotropic Prescription Patient who received Psychotropic Prescription
Patient who received Psychotropic Prescription 15
Table 3a - M.I.N.I. Axis I and BED Comorbidity Table 3a - M.I.N.I. Axis I and BED Comorbidity Table 3a - M.I.N.I. Axis I and BED Comorbidity Table 3a - M.I.N.I. Axis I and BED Comorbidity Table 3a - M.I.N.I. Axis I and BED Comorbidity
Mood and Panic History (n=80) Bed LT No BED 𝝌2 Sig. LT-Unipolar Depression 19 11 5,951 0,114 LT-Bipolar Disorder 4 5 LT-Mania only 1 1 No Mood History 13 25 LT Panic 7 3 2,593 0,107 No Lt PAnic 30 40
Table 4 - Prevalence comparison with similar studies Table 4 - Prevalence comparison with similar studies Table 4 - Prevalence comparison with similar studies Table 4 - Prevalence comparison with similar studies Table 4 - Prevalence comparison with similar studies Table 4 - Prevalence comparison with similar studies Table 4 - Prevalence comparison with similar studies Table 4 - Prevalence comparison with similar studies Table 4 - Prevalence comparison with similar studies Table 4 - Prevalence comparison with similar studies Table 4 - Prevalence comparison with similar studies Table 4 - Prevalence comparison with similar studies Table 4 - Prevalence comparison with similar studies Table 4 - Prevalence comparison with similar studies Table 4 - Prevalence comparison with similar studies Table 4 - Prevalence comparison with similar studies Table 4 - Prevalence comparison with similar studies
Rosenber ger (2006) Rosenber ger (2006) Kalarchia n (2007) Kalarchia n (2007) Mauri (2008) Mauri (2008) Mühlhans (2009) Mühlhans (2009) Mitchell (2012) Mitchell (2012) Our Sample Our Sample De Girolamo 2006/ Demyttena ere 2004 De Girolamo 2006/ Demyttena ere 2004 Scott (2004) Scott (2004) LT Curr . LT Curr . LT Curr . LT Curr. LT Curr . LT Curr . LT Curr . LT Curr . Axis I 36,8 24,1 66,3 37,8 37,6 20,9 72,6 55,5 68,6 33,7 68,8 28,7 18,3 7,3 NA NA Mood 22.4 10,9 45,5 15,6 22 6,4 54,8 31,5 44,2 11,6 52,5 12,5 11,2 3,5 NA 3 Anxiety 15,5 11,5 37,5 24 18,1 12,4 21,2 15,1 31,7 18,1 12,5 6,3 11,1 5,1 NA 2,4 ED 13,8 10,3 29,5 16,3 12,8 7,1 50 37,7 26,6 11,1 46,3 17,5 BED 4,6 3,4 27,1 16 11 6,7 NA 23,3 13,1 10,1 46,3 17,5 EDNOS 9,2 6,9 NA NA NA NA NA 14,4 13,1 NA 21* NA
Modified from Malik (2014). (all values are percentage; ED: Any Eating Disorder, BED: Binge Eating Disorders; EDNOS: ED not otherwise specified
Modified from Malik (2014). (all values are percentage; ED: Any Eating Disorder, BED: Binge Eating Disorders; EDNOS: ED not otherwise specified
Modified from Malik (2014). (all values are percentage; ED: Any Eating Disorder, BED: Binge Eating Disorders; EDNOS: ED not otherwise specified
Modified from Malik (2014). (all values are percentage; ED: Any Eating Disorder, BED: Binge Eating Disorders; EDNOS: ED not otherwise specified
Modified from Malik (2014). (all values are percentage; ED: Any Eating Disorder, BED: Binge Eating Disorders; EDNOS: ED not otherwise specified
Modified from Malik (2014). (all values are percentage; ED: Any Eating Disorder, BED: Binge Eating Disorders; EDNOS: ED not otherwise specified
Modified from Malik (2014). (all values are percentage; ED: Any Eating Disorder, BED: Binge Eating Disorders; EDNOS: ED not otherwise specified
Modified from Malik (2014). (all values are percentage; ED: Any Eating Disorder, BED: Binge Eating Disorders; EDNOS: ED not otherwise specified
Modified from Malik (2014). (all values are percentage; ED: Any Eating Disorder, BED: Binge Eating Disorders; EDNOS: ED not otherwise specified
Modified from Malik (2014). (all values are percentage; ED: Any Eating Disorder, BED: Binge Eating Disorders; EDNOS: ED not otherwise specified
Modified from Malik (2014). (all values are percentage; ED: Any Eating Disorder, BED: Binge Eating Disorders; EDNOS: ED not otherwise specified
Modified from Malik (2014). (all values are percentage; ED: Any Eating Disorder, BED: Binge Eating Disorders; EDNOS: ED not otherwise specified
Modified from Malik (2014). (all values are percentage; ED: Any Eating Disorder, BED: Binge Eating Disorders; EDNOS: ED not otherwise specified
Modified from Malik (2014). (all values are percentage; ED: Any Eating Disorder, BED: Binge Eating Disorders; EDNOS: ED not otherwise specified
Modified from Malik (2014). (all values are percentage; ED: Any Eating Disorder, BED: Binge Eating Disorders; EDNOS: ED not otherwise specified
Modified from Malik (2014). (all values are percentage; ED: Any Eating Disorder, BED: Binge Eating Disorders; EDNOS: ED not otherwise specified
Modified from Malik (2014). (all values are percentage; ED: Any Eating Disorder, BED: Binge Eating Disorders; EDNOS: ED not otherwise specified
As shown in table 3a, Panic disorder is always comorbid with mood disorders; we didn’t find significant associations between lifetime BED and lifetime Mood Disorders or Panic Disorders.
Group analysis by BED and Axis I general comorbidity
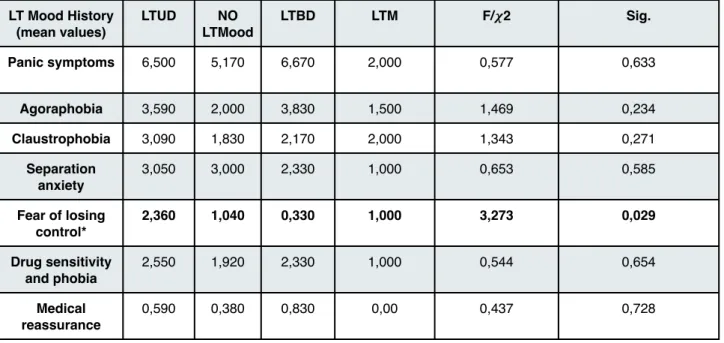
Tables 5- show average domains value differences by Lifetime BED diagnosis (along with Axis I comorbidity).
Table 5: SCL-90 domains and BED Lifetime Table 5: SCL-90 domains and BED Lifetime Table 5: SCL-90 domains and BED Lifetime Table 5: SCL-90 domains and BED Lifetime SCL 90 mean differences SCL 90 mean differences SCL 90 mean differences LT BED No LT Bed F p somatization 21,68 19,45 1,119 0,295 O-C 15,82 13,79 2,474 0,121 interpersonal sensitivity 14,82 12,66 2,024 0,160 depression 20,82 18,83 1,155 0,287 anxiety 15,79 13,45 3,580 0,064 hostility 7,07 7,14 0,018 0,893 phobic anxiety 8,5 8,41 0,014 0,905 paranoid ideation 8,86 7,72 2,249 0,139 psyhoticism 13,14 11,55 4,076 0,048 GSI 1,5379 1,3769 2,198 0,144 PST 89,93 86,9 0,921 0,341 PSDI 1,5379 1,3769 2,198 0,144
The SCL-90 Psychoticism factor shows significantly higher average values in subjects with BED history
Table 6 : Sci-Abs Domains average values Table 6 : Sci-Abs Domains average values Table 6 : Sci-Abs Domains average values Table 6 : Sci-Abs Domains average values Table 6 : Sci-Abs Domains average values
Min Max Mean SD
Attitudes and Beliefes 0 6 1,91 1,468
Self-Esteem and Satisfaction 0 18 4,71 3,268
Phobias 0 22 7,89 4,716
Avoidant and Compulsive Behaviours 0 8 1,89 1,626
Weight Maintenance 0 17 5,91 3,960
Eating Discontrol 0 19 7,84 5,211
Associated Features and Consequences 0 9 3,68 2,480
Impairment and Insight 0 7 1,11 1,522
Abs Total Score 5 87 36,86 18,21
Table 7 Anorexic-Bulimic Spectrum, BED and Axis I lifetime comorbidity Table 7 Anorexic-Bulimic Spectrum, BED and Axis I lifetime comorbidity Table 7 Anorexic-Bulimic Spectrum, BED and Axis I lifetime comorbidity Table 7 Anorexic-Bulimic Spectrum, BED and Axis I lifetime comorbidity Table 7 Anorexic-Bulimic Spectrum, BED and Axis I lifetime comorbidity Table 7 Anorexic-Bulimic Spectrum, BED and Axis I lifetime comorbidity Table 7 Anorexic-Bulimic Spectrum, BED and Axis I lifetime comorbidity Table 7 Anorexic-Bulimic Spectrum, BED and Axis I lifetime comorbidity Table 7 Anorexic-Bulimic Spectrum, BED and Axis I lifetime comorbidity Table 7 Anorexic-Bulimic Spectrum, BED and Axis I lifetime comorbidity
n=56, mean values LTUD No LTmood LTBD F Sig. Bed LT No BED t Sig. Attitudes and Beliefes 1,81 1,92 2,5 1,084 0,364 1,790 2,040 0,618 0,539 Weight History 1,86 2,04 1,88 0,294 0,829 1,970 1,850 -0,276 0,784 Self-Esteem and Satisfaction 4,14 5,08 5,88 1,322 0,277 4,450 5,000 0,628 0,533 Phobias 6,9 8,8 8,25 0,793 0,503 8,720 7,000 -1,378 0,174 Avoidant and Compulsive Behaviours 1,52 2,28 1,75 0,887 0,454 2,280 1,480 -1,868 0,067 Weight Maintenance 4,9 5,88 8,75 1,922 0,137 6,310 5,480 -0,780 0,439 Eating Discontrol 7,52 8,24 8,63 0,699 0,557 9,480 6,070 -2,583 0,013 Associated Features and Consequences 3,05 3,8 4,75 1,047 0,380 4,210 3,110 -1,679 0,099 Impairment and Insight 0,95 1,4 0,88 0,787 0,507 1,240 0,960 -0,681 0,499
sci-abs total score 32,67 39,44 43,25 1,271 2,940
Sci-abs domains show a statistically significant difference for BED patients, who bear higher scores in the “Eating Discontrol” domain.
Table 8: Panic-Agoraphobic Spectrum Factors average Values Table 8: Panic-Agoraphobic Spectrum Factors average Values Table 8: Panic-Agoraphobic Spectrum Factors average Values Table 8: Panic-Agoraphobic Spectrum Factors average Values Table 8: Panic-Agoraphobic Spectrum Factors average Values
Min Max Mean SD
Total PAS (cut-off 35) 0 84 23,96 17,943
Panic symptoms 0 28 5,78 5,452
Agoraphobia 0 12 2,78 3,004
Claustrophobia 0 7 2,35 2,188
Separation anxiety 0 9 2,91 2,213
Fear of losing control 0 7 1,49 1,845
Drug sensitivity and phobia 0 8 2,16 2,106 Medical reassurance 0 4 0,49 1,120 Rescue object 0 3 0,84 0,898 Loss sensitivity 0 41 1,67 5,498 Family reassurance 0 3 1,64 1,267
Subjects with positive Total scores
21,3%
Table 9: Panic Spectrum Domains and Axis I History Table 9: Panic Spectrum Domains and Axis I History Table 9: Panic Spectrum Domains and Axis I History Table 9: Panic Spectrum Domains and Axis I History Table 9: Panic Spectrum Domains and Axis I History Table 9: Panic Spectrum Domains and Axis I History Table 9: Panic Spectrum Domains and Axis I History
LT Mood History (mean values) LTUD NO LTMood LTBD LTM F/𝝌2 Sig. Panic symptoms 6,500 5,170 6,670 2,000 0,577 0,633 Agoraphobia 3,590 2,000 3,830 1,500 1,469 0,234 Claustrophobia 3,090 1,830 2,170 2,000 1,343 0,271 Separation anxiety 3,050 3,000 2,330 1,000 0,653 0,585 Fear of losing control* 2,360 1,040 0,330 1,000 3,273 0,029 Drug sensitivity and phobia 2,550 1,920 2,330 1,000 0,544 0,654 Medical reassurance 0,590 0,380 0,830 0,00 0,437 0,728
Rescue object 1,27>> 0,420 0,830 1,500 4,615 0,006
Loss sensitivity 1,000 2,580 1,170 0,000 0,387 0,763
Family reassurance
1,950 1,500 1,330 0,000 1,867 0,147
Total PAS (cut-off 35)
28,550 21,080 24,000 11,000 1,016 0,394
# of patient over cut-off (21.3%)
10,000 5,000 2,000 0,000 5,111 0,164
*PostHoc Test not stat. significant *PostHoc Test not stat. significant *PostHoc Test not stat. significant *PostHoc Test not stat. significant *PostHoc Test not stat. significant
LTUD: lifetime unipolar depression; LTBD: bipolar disorder; LTM Lifetime Mania; NoLTMood: no history of mood disorder
LTUD: lifetime unipolar depression; LTBD: bipolar disorder; LTM Lifetime Mania; NoLTMood: no history of mood disorder
LTUD: lifetime unipolar depression; LTBD: bipolar disorder; LTM Lifetime Mania; NoLTMood: no history of mood disorder
LTUD: lifetime unipolar depression; LTBD: bipolar disorder; LTM Lifetime Mania; NoLTMood: no history of mood disorder
LTUD: lifetime unipolar depression; LTBD: bipolar disorder; LTM Lifetime Mania; NoLTMood: no history of mood disorder
LTUD: lifetime unipolar depression; LTBD: bipolar disorder; LTM Lifetime Mania; NoLTMood: no history of mood disorder
LTUD: lifetime unipolar depression; LTBD: bipolar disorder; LTM Lifetime Mania; NoLTMood: no history of mood disorder
PAS-SR domain fear of losing control shows a significant difference in group comparison (F=3,27; p<0,05) but Post-Hoc analysis didn’t confirm a significant between-groups difference. A greater, and statistically significant difference can be found in the Rescue Object domain, with the unipolar depression history having a significantly higher score than both bipolar and negative mood history groups. Group Comparison for BED history show a statistically significant higher “Drug Sensitivity and Phobia” average score for the BED subgroup.
Table 10: Panic Spectrum Domains and BED History Table 10: Panic Spectrum Domains and BED History Table 10: Panic Spectrum Domains and BED History Table 10: Panic Spectrum Domains and BED History Table 10: Panic Spectrum Domains and BED History
T-test -BED lt (means)
Bed LT No BED t Sig. (2-code)
Panic symptoms 6,800 4,560 1,536 0,130 Agoraphobia 2,900 2,640 0,317 0,753 Claustrophobia 2,570 2,080 0,819 0,416 Separation anxiety 3,200 2,560 1,069 0,290 Fear of losing control 1,800 1,120 1,372 0,176
Drug sensitivity and phobia 2,700 1,520 2,169 0,035 Medical reassurance 0,570 0,400 0,546 0,587 Rescue object 0,830 0,840 -0,027 0,978 Loss sensitivity 1,130 2,320 -0,794 0,431 Family reassurance 1,800 1,440 1,050 0,298
Table 11: Mood Spectrum Domains scores Table 11: Mood Spectrum Domains scores Table 11: Mood Spectrum Domains scores Table 11: Mood Spectrum Domains scores Table 11: Mood Spectrum Domains scores
MOODS-SR Domains Min Max Mean SD
Psychomotor Activation 0 11 3,27 2,646 Mixed Instability 0 5 1,11 1,590 Spirituality/Mysticism/Psychoticism 0 3 0,35 0,668 Mixed Irritability 0 4 1,05 1,182 Euphoria 0 12 2,07 2,047 Wastefulness/recklessness 0 5 1,09 1,298 Creativity 0 8 3,65 2,545
Inflated Self Esteem 0 4 0,77 1,049
Sociability / Extroversion 0 15 2,84 2,429
Table 11a Moods-SR domains and lifetime BED Table 11a Moods-SR domains and lifetime BED Table 11a Moods-SR domains and lifetime BED Table 11a Moods-SR domains and lifetime BED Table 11a Moods-SR domains and lifetime BED
LT BED No LT BED F Sig.
Psychomotor Activation 3,340 3,210 1,322 0,274 Mixed Instability 1,250 0,970 0,681 0,510 Spirituality/Mysticism/Psychoticism 0,310 0,380 0,357 0,701 Mixed Irritability 1,160 0,940 0,128 0,880 Euphoria 2,090 2,060 0,042 0,959 Wastefulness/recklessness 1,090 1,09 0,325 0,724 Creativity 3,910 3,41 0,181 0,835
Inflated Self Esteem 0,720 0,82 0,084 0,920
Sociability / Extroversion 2,970 2,71 0,389 0,679
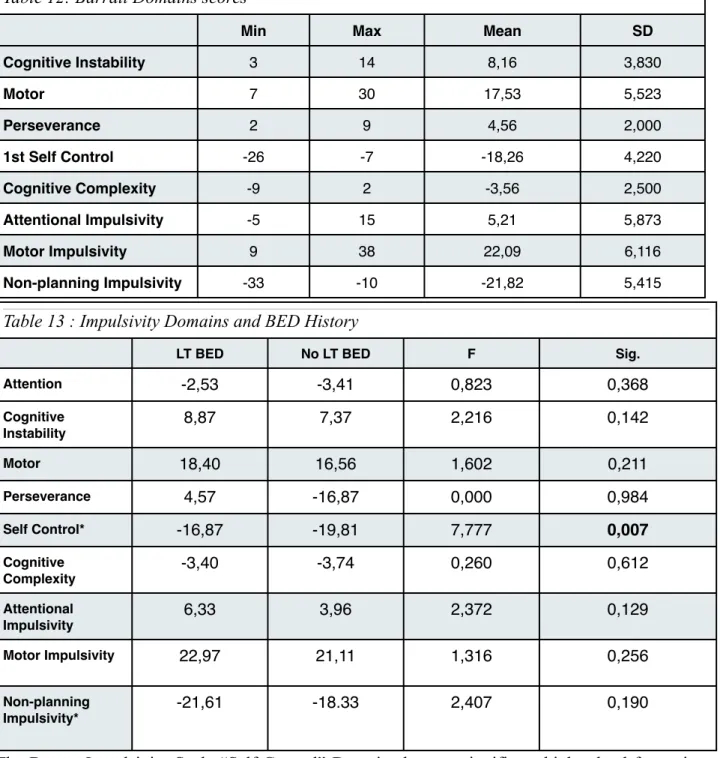
Table 12: Barratt Domains scores Table 12: Barratt Domains scores Table 12: Barratt Domains scores Table 12: Barratt Domains scores Table 12: Barratt Domains scores
Min Max Mean SD
Cognitive Instability 3 14 8,16 3,830 Motor 7 30 17,53 5,523 Perseverance 2 9 4,56 2,000 1st Self Control -26 -7 -18,26 4,220 Cognitive Complexity -9 2 -3,56 2,500 Attentional Impulsivity -5 15 5,21 5,873 Motor Impulsivity 9 38 22,09 6,116 Non-planning Impulsivity -33 -10 -21,82 5,415
Table 13 : Impulsivity Domains and BED History Table 13 : Impulsivity Domains and BED History Table 13 : Impulsivity Domains and BED History Table 13 : Impulsivity Domains and BED History Table 13 : Impulsivity Domains and BED History
LT BED No LT BED F Sig.
Attention -2,53 -3,41 0,823 0,368 Cognitive Instability 8,87 7,37 2,216 0,142 Motor 18,40 16,56 1,602 0,211 Perseverance 4,57 -16,87 0,000 0,984 Self Control* -16,87 -19,81 7,777 0,007 Cognitive Complexity -3,40 -3,74 0,260 0,612 Attentional Impulsivity 6,33 3,96 2,372 0,129 Motor Impulsivity 22,97 21,11 1,316 0,256 Non-planning Impulsivity* -21,61 -18.33 2,407 0,190
The Barratt Impulsivity Scale “Self-Control” Domain shows a significant higher load for patients with BED history.
Obesity Measures
The following table shows the lack of statistically significant relations between BMI and Lifetime BED, Panic and Mood comorbidity.
Table 14: Axis I Diagnosis and BMI Table 14: Axis I Diagnosis and BMI Table 14: Axis I Diagnosis and BMI Table 14: Axis I Diagnosis and BMI Table 14: Axis I Diagnosis and BMI Table 14: Axis I Diagnosis and BMI Table 14: Axis I Diagnosis and BMI
Yes No F/Student’sT p Bed History 45,17 (n=37) 44,37 (n=43) 0,453 0,652 Lifetime Panic Disorders 43,28 (n=10) 44,95(n=70) -0,783 0,447 Any LT Diagnosis 44,96 (55) 44,26 (25) 0,437 0,664 No Mood History Unipolar LT History Bipolar LT History Isolated Manic Episodes Mean BMI by Mood History 45,58(32) 45,61(25) 42,03(8) 39,35 (2) 0,883 0,455
Even by grouping cases by Obesity Classes (see above) we can’t find any statistically significant differences (Table 15)
Table 15: DSM Axis I comorbidity and Obesity Class Table 15: DSM Axis I comorbidity and Obesity Class Table 15: DSM Axis I comorbidity and Obesity Class Table 15: DSM Axis I comorbidity and Obesity Class Table 15: DSM Axis I comorbidity and Obesity Class Table 15: DSM Axis I comorbidity and Obesity Class Table 15: DSM Axis I comorbidity and Obesity Class Table 15: DSM Axis I comorbidity and Obesity Class Table 15: DSM Axis I comorbidity and Obesity Class Table 15: DSM Axis I comorbidity and Obesity Class Obesity Class DSM Axis I DiagnosisDSM Axis I DiagnosisDSM Axis I DiagnosisDSM Axis I DiagnosisDSM Axis I DiagnosisDSM Axis I DiagnosisDSM Axis I DiagnosisDSM Axis I DiagnosisDSM Axis I Diagnosis
(n=80) Any LT Axis I No LT Axis I 𝝌2! Sig. BED LT No BED 𝝌2 Sig.
Moderate (grade I +II) 13 5 0,581 0,748 8 10 0,034 0,983
Severe/Morbid (grade III) 28 15 20 23 Super/Monstrous (grade IV+V) 14 5 9 10
Obesity Class LTUD LTBD NO LT mood 𝝌2 Sig. Lt Panic No Lt Panic 𝝌2 Sig
Moderate (grade I +II) 7 4 6 4,462 0,61 3 15 0,383 0,826
Severe/Morbid (grade III) 15 4 23 5 38 Super/Monstrous (grade IV+V) 8 1 9 2 17
(LT BED : lifetime Binge Eating Disorder; LTUD: lifetime unipolar depression; LTBD: bipolar disorder ; LT Panic: history of panic spectrum disorder)
(LT BED : lifetime Binge Eating Disorder; LTUD: lifetime unipolar depression; LTBD: bipolar disorder ; LT Panic: history of panic spectrum disorder)
(LT BED : lifetime Binge Eating Disorder; LTUD: lifetime unipolar depression; LTBD: bipolar disorder ; LT Panic: history of panic spectrum disorder)
(LT BED : lifetime Binge Eating Disorder; LTUD: lifetime unipolar depression; LTBD: bipolar disorder ; LT Panic: history of panic spectrum disorder)
(LT BED : lifetime Binge Eating Disorder; LTUD: lifetime unipolar depression; LTBD: bipolar disorder ; LT Panic: history of panic spectrum disorder)
(LT BED : lifetime Binge Eating Disorder; LTUD: lifetime unipolar depression; LTBD: bipolar disorder ; LT Panic: history of panic spectrum disorder)
(LT BED : lifetime Binge Eating Disorder; LTUD: lifetime unipolar depression; LTBD: bipolar disorder ; LT Panic: history of panic spectrum disorder)
(LT BED : lifetime Binge Eating Disorder; LTUD: lifetime unipolar depression; LTBD: bipolar disorder ; LT Panic: history of panic spectrum disorder)
(LT BED : lifetime Binge Eating Disorder; LTUD: lifetime unipolar depression; LTBD: bipolar disorder ; LT Panic: history of panic spectrum disorder)
(LT BED : lifetime Binge Eating Disorder; LTUD: lifetime unipolar depression; LTBD: bipolar disorder ; LT Panic: history of panic spectrum disorder)
.
Table 16 : BIS Impulsivity domains and Obesity Classes Table 16 : BIS Impulsivity domains and Obesity Classes Table 16 : BIS Impulsivity domains and Obesity Classes Table 16 : BIS Impulsivity domains and Obesity Classes Table 16 : BIS Impulsivity domains and Obesity Classes Table 16 : BIS Impulsivity domains and Obesity Classes
Moderate Ob Severe Ob Morbid Ob F Sig
Attention 0,537 0,587 Cognitive Instability 3 14 8,16 2,994 0,580 Motor# 7 30 17,53 3,800 0,029 Perseverance 2 9 4,56 1,330 0,272 Self Control* -26 -7 -18,26 0,240 0,976 Cognitive Complexity -9 2 -3,56 1,678 0,198 Attentional Impulsivity -5 15 5,21 0,765 0,470 Motor Impulsivity# 9 38>> 22,09 3,836 0,028 Non-planning Impulsivity -33 -10 -21,82 0,449 0,641
SCI-ABS domain comparison by obesity groups shows a lesser score in “weight history” for patients with moderate (grade 1 or 2) obesity compared to the severe obesity group.
Table 17 Anorexic-Bulimic Spectrum and Obesity Class Table 17 Anorexic-Bulimic Spectrum and Obesity Class Table 17 Anorexic-Bulimic Spectrum and Obesity Class Table 17 Anorexic-Bulimic Spectrum and Obesity Class Table 17 Anorexic-Bulimic Spectrum and Obesity Class Table 17 Anorexic-Bulimic Spectrum and Obesity Class
n=56, mean values Moderate Obesity Severe Obesity Morbid Obesity F Sig.
Attitudes and Beliefes 1,820 2,030 1,710 0,246 0,782
Weight History* 0,91<< 2,190 2,070 3,207 0,048
Self-Esteem and Satisfaction 4,360 4,900 4,570 0,124 0,883
Phobias 4,120 4,440 8,500 0,168 0,846
Avoidant and Compulsive
Behaviours 1,450 1,940 2,140 0,567 0,571
Weight Maintenance 7,650 5,000 6,570 2,145 0,127
Eating Discontrol 6,910 7,450 9,430 0,909 0,409
Associated Features and
Consequences 4,090 3,580 3,570 0,184 0,833
Impairment and Insight 1,270 1,060 1,070 0,078 0,925
Table 18: Mood Spectrum Factors and Obesity Classes Table 18: Mood Spectrum Factors and Obesity Classes Table 18: Mood Spectrum Factors and Obesity Classes Table 18: Mood Spectrum Factors and Obesity Classes Table 18: Mood Spectrum Factors and Obesity Classes Table 18: Mood Spectrum Factors and Obesity Classes
MOODS Domains (mean)
Moderate Ob Severe Ob Morbid Ob F p
Psychomotor Activation 4,29 2,97 3,07 1,322 0,274 Mixed Instability 0,71 1,14 1,4 0,681 0,510 Spirituality/ Mysticism/ Psychoticism 0,21 0,38 0,4 0,357 0,701 Mixed Irritability 0,93 1,11 1 0,128 0,880 Euphoria 2,21 2,03 2,06 0,042 0,959 Wastefulness/ recklessness 1,07 1,19 0,87 0,325 0,724 Creativity 3,36 3,65 3,93 0,181 0,835
Inflated Self Esteem 0,71 0,76 0,87 0,084 0,920
Sociability / Extroversion
3,14 2,61 3,13 0,389 0,679
Statistical Analysis showed no group differences in moods factorial domains for, DSM diagnosis, Grazing history or Obesity Class.
Gender
Socio-demographic data, smoke habits, age at hospitalisation appear to be independent of gender, as shown in table 19.
Table 19: Socio-demographic differences by gender Table 19: Socio-demographic differences by gender Table 19: Socio-demographic differences by gender Table 19: Socio-demographic differences by gender
Male % Female%
Sample Composition n=80 33,8% 66,3%
Children % 𝝌2 Sig.
Yes 47,5 1,061 0,30
No 52,5
Marital Class 𝝌2 Sig.
Alone 37,5 0,004 0,951
Couple 62,5
Education Degree % 𝝌2 Sig.
Compulsory 43,7 0,498 0,481
High School and Academic 56,3
Occupational Status % 𝝌2 Sig.
Working 65 1,475 0,225
Not Working 20,0
BMI, Obesity grade and most comorbid conditions or complications don’t show prevalence difference by gender, with some exceptions that reflect general population figures: as expected, Metabolic Syndrome and Hypertension appears equally prevelent between gender groups, Dyslipidaemia, Cardiovascular involvement are significantly more prevalent among men, along with OSAHS/restrictive respiratory syndromes. Thyreopathy, as expected, appears to be more prevalent among women (see Table 20).
Table 20 : Obesity and associated medical conditions by Gender Table 20 : Obesity and associated medical conditions by Gender Table 20 : Obesity and associated medical conditions by Gender Table 20 : Obesity and associated medical conditions by Gender Table 20 : Obesity and associated medical conditions by Gender
Gender Differences (n=80) Male Female Student’s t / F /𝝌2 p
Mean BMI by gender 46,76 (n=27) 43,72 (n=53) -1,701 0,093
Obesity Class
Moderate (grade I +II) 8 10 2,797 0,247
Severe/Morbid (grade III) 11 32 Super/Monstrous (grade IV+V) 8 11 Associated Conditions* % (n) Metabolic Syndrome 47,7% (n=13) 32,1% (n=13) Dyslipidemia 51,9% (n=14) 20,8% (n=11) 8,051 0,005 Cardiovascular 66,7% (n=18) 30,2% (16) 10,606 0,005 OSAHS/Restrictive Syndromes 37% (n=10) 7,5% (n=4) 10,775 0,001 Thyreopathy 11,1% (n=3) 41,5% (n=22) 7,694 0,006
*associations for all unlisted conditions from Table 2 did not reach statistical significance *associations for all unlisted conditions from Table 2 did not reach statistical significance *associations for all unlisted conditions from Table 2 did not reach statistical significance *associations for all unlisted conditions from Table 2 did not reach statistical significance *associations for all unlisted conditions from Table 2 did not reach statistical significance
All DSM diagnoses and lifetime presence of grazing are also independent of gender, except for current Depressive Episode that appears to be more recurring in men, but weak statistical significance and thin number of cases (only two) warrant caution in weighing this result (Table 21).
Table 21 Psychiatric Diagnosis by Gender Table 21 Psychiatric Diagnosis by Gender Table 21 Psychiatric Diagnosis by Gender Table 21 Psychiatric Diagnosis by Gender Table 21 Psychiatric Diagnosis by Gender
Male Female 𝝌2 p Current Depressive Episode (n=2) 100,0% 0,0% 4,027 0,045 LT Depressive Episode (n=34) 26,5% 73,5% 1,401 0,236 Dysthimia (n=8) 25,0% 75,0% 0,304 0,580 LT Mania (n=12) 41,7% 58,3% 0,396 0,529 LT Panic (n=10) 30,0% 70,0% 0,072 0,789 LT Bed (n=55) 34,5% 65,5% 0,050 0,823 Current BED (n=23) 39,1% 60,9% 0,418 0,518