NO
x
formation and control
Modeling NOx formation in turbulent reacting systems needs the characterisation
of many variables, such as the fluid dynamic, the mixing process, heat transfer and chemical kinetics. Generally speaking, the overall rate of NOx formation is
slow compared to the fuel oxidation reaction, so it is not feasible to couple these two mechanism into a CFD code. Therefore, NOx formation rates are calculated
post-processing or, in other words, after the flame structure has been developed, assuming equilibrium values of temperature and concentrations of the main species. Thus, there is no feedback of NOx emissions on the fluid dynamic problems
de-termined before, but the low expectable concentrations of pollutant justify this restriction. This methodology allows not to solve the transport equations for the pollutants, requiring a small computational effort.
The present Chapter will firstly focus on a review of the main mechanisms responsible for the formation of NOx in flames. Secondly, a comprehensive
mod-eling approach for NOx formation will be discussed and, finally, several advanced
technologies used to reduce NOx genesis during the combustion processes will be
introduced.
1.1 NO
xformation mechanism
The main routes involved in nitrogen oxides formation are: • Thermal
• Prompt • Fuel
Chapter 1. NOx formation and control
Nevertheless, it is recognised in literature that NO formation may occurs through others two route:
• N2O intermediate route
• NNH intermediate route
These two alternative mechanisms may be relevant under certain special cir-cumstances, such as technologies promoting low-temperature combustion and em-ploying hydrogen enriched fuels.
1.1.1 Thermal NO
xMechanism
The formation of thermal NOx is determined by a set of highly temperature
de-pendent chemical reactions known as the extended Zeldovich mechanism. The principal reactions concern the oxidation of atmospheric nitrogen as follows:
N2+ O kf 1 * ) kr1 N + N O (1.1) N + O2 kf 2 * ) kr2 N O + O (1.2)
For near stoichiometric and fuel rich mixtures the following reaction may also be significant:
N + OH )kf 3*
kr3
N O + H (1.3)
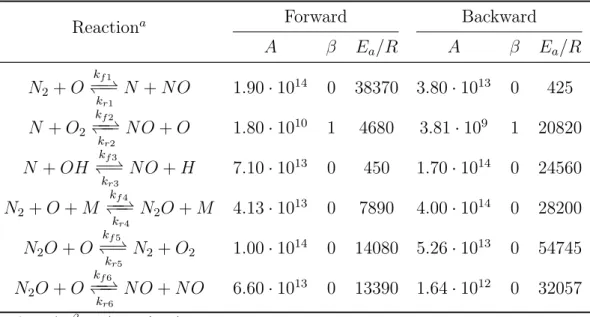
The rate constants for equation (1.1) - (1.2) are shown in Table 1.1, using the evaluation of Hanson and Salimian [4].
Reactions (1.1) - (1.3) involve the concentrations of O, OH and H radicals. Typically they are obtained from equilibrium considerations, which still lead to a significant underestimation of the NO formation rate [5]. Better agreement may be achieved using radicals concentration estimated by detailed kinetic mechanism. Reaction (1.1) is generally considered the limiting step of the global thermal for-mation due to its high activation energy needed to break the strong triple bond of N2, which determines the high temperature sensitivity of the mechanism. Under
the assumption of quasy steady state for N radical, the net rate of NO formation is given by: d[N O] dt = 2kf 1[O][N2] 1 kr1kr2[N O]2 kf 1[N2]kf 2[O2] 1 + kr1[N O] kf 2[O2]+kf 3[OH] (1.4)
Table 1.1: Reaction parameters for Zeldovich and N2O intermediate mechanism.
Units: mol, cm, s, K
Reactiona Forward Backward
A Ea/R A Ea/R N2+ O kf 1 * ) kr1 N + N O 1.90· 1014 0 38370 3.80· 1013 0 425 N + O2 kf 2 * ) kr2 N O + O 1.80· 1010 1 4680 3.81· 109 1 20820 N + OH )kf 3* kr3 N O + H 7.10· 1013 0 450 1.70· 1014 0 24560 N2+ O + M kf 4 * ) kr4 N2O + M 4.13· 1013 0 7890 4.00· 1014 0 28200 N2O + O kf 5 * ) kr5 N2+ O2 1.00· 1014 0 14080 5.26· 1013 0 54745 N2O + O kf 6 * ) kr6 N O + N O 6.60· 1013 0 13390 1.64· 1012 0 32057 a k = AT exp( E a/RT ).
Assuming the hypothesis that the initial concentrations of NO and OH are small, it is possible to neglect the backward rates of the Zeldovich mechanism, so Equation (1.4) becomes:
d[N O]
dt = 2kf 1[O][N2] (1.5)
If the O radical concentration is not available from the CFD calculation, it can be estimated following Westenberg [6], who assumed that oxigen atoms are in equilibrium with O2 in fuel lean zone:
[O] = Keq[O2]1/2 (1.6) where Keq is: Keq= 3.97· 105T 1/2exp ⇣ 31096 T ⌘ mol/m3 (1.7)
An improvement can be made by accounting for third-body reactions in the O2
process [7]:
O2+ M *) O + O + M (1.8)
So Equation (1.7) is replaced by:
Keq = 36.64 T1/2exp
⇣ 27123 T
⌘
Chapter 1. NOx formation and control
which generally leads to a higher O radical concentration.
Since the N2 oxidation reaction requires high activation energy, the Zeldovich
mechanism becomes significant at high temperatures above 1800 K and the amount of formed NO depends on the flame temperature, the residence time and the oxygen concentration.
1.1.2 Prompt Mechanism
As Fenimore [8] suggested in 1971, Prompt NO are formed by the reaction of atmospheric nitrogen with hydrocarbon radical with the consecutive oxidation of the intermediate species to NO. This mechanism becomes significant in particular combustion environments, such as in low-temperature, fuel rich conditions and short residence time. It can be described by the following sequence of reactions:
N2 + CHx*) HCN + N + . . . (1.10)
N2+ C2 *) CN + CN (1.11)
HCN + O2 *) N O + . . . (1.12)
By measuring HCN concentrations in rich, atmospheric pressure, propane-air flames, Bachemeier et al. [9] established that Fenimore’s Prompt NO was the result of a reaction between N2 and a hydrocarbon free radical.
Miller and Bowman [10] affirmed that (1.10) is the key reaction, while the contribution of (1.11) is significant only under very high temperature conditions.
The complete prompt NO mechanism is rather complex because it requires coupling of the NO kinetics to an actual hydrocarbon combustion mechanism. However simplified approaches are taken into account, especially in CFD code. For example, De Soete [11] suggested a single-step global reaction mechanism:
d[N O]prompt
dt = kprompt[O2]
a[N
2][F ] (1.13)
where:
kprompt= Apromptexp
⇣ T
A,prompt
T ⌘
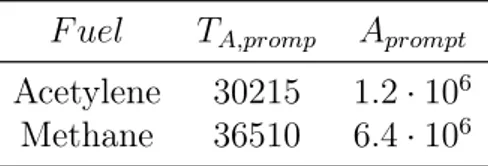
(1.14) In equation (1.13) F denotes the fuel and a is the oxygen reaction order, which according to De Soete [11] depends on oxygen mole fraction in flame. The kinetic constant parameters are evaluated depending on the fuel. De Soete [11] suggested the values listed in Table 1.2.
Table 1.2: Reaction parameters Prompt mechanism. Units: s, K F uel TA,promp Aprompt
Acetylene 30215 1.2· 106
Methane 36510 6.4· 106
Reaction parameters listed in Table 1.2 are clearly not suited under fuel-rich conditions and for higher hydrocarbon fuels, so a modification in De Soete model is needed, fitting available experimental data from Backmier et al. [12]. So intro-ducing a correction factor, equation (1.13) becomes:
d[N O]prompt dt = f k 0 prompt[O2]a[N2][F ] (1.15) where: f = 4.74 + 0.0819n 23.3 + 32 2 12.2 3 (1.16) In the above equation n is the number of carbon atoms per molecule for the hydrocarbon fuel and is the equivalence ratio.
1.1.3
Fuel Mechanism
Nitrogen-containing organic compounds present in liquid or solid fossil fuel can contribute to the total NO formed during the combustion process through the fuel mechanism. Fuel NO is formed from nitrogen bound in the fuel, through intermediate species such as HCN and NHNO3, which are oxidized to NO. Fuel NO
is a relevant source of nitrogen oxide emissions for residual fuel oil and coal, which typically contain 0.3-2% nitrogen by weight. Clearly, natural gas and hydrogen combustion is not interested by such formation mechanism.
1.1.4 N
2O Intermediate Route
Malte and Pratt [13] proposed the first NOx formation mechanism via the
inter-mediate specie N2O. This mechanism, under favorable conditions such as elevated
pressure, temperature below 1800 K and oxygen-rich conditions, can contribute as much as 90% of the total NOx. Therefore this makes it particularly important
in gas turbines and compression-ignition engines. The main reactions involved in N2O Intermediate Route are:
N2+ O + M kf 4 * ) kr4 N2O + M (1.17)
Chapter 1. NOx formation and control N2+ O kf 5 * ) kr5 N O + N O (1.18) N2+ O kf 6 * ) kr6 N2+ O2 (1.19)
The rate constants for equation (1.17) - (1.19) are shown in Table 1.1. These reactions involve O radical concentration and a general third body (M), showing why this mechanism is favoured at elevated pressures and at oxygen-rich conditions.
1.1.5
NNH Intermediate Route
Bozzelli and Dean [14] proposed a new route forming NO by the oxidation of NNH radicals, deducing a large kinetic constant for the reaction employing the direct oxidation of NNH to NO. The mechanism may be particularly relevant at low temperatures, in fuel rich conditions and for hydrogen enriched flames. The essential reactions of the NNH route are:
N2+ H kf 7 * ) kr7 N N H (1.20) N N H + O)kf 8* kr8 N O + N H (1.21) N N H + O)kf 9* kr9 N2O + H (1.22)
Reaction (1.22) links NNH route with N2O route, while reaction (1.20) is
appar-ently equilibrated rapidly in flames with high concentrations of free H atoms leading to the formation of significant quantities of NNH. This result was also confirmed by Hayhurst and Hutchinson [15], who performed measurements of NOx in a laminar,
premixed, flat CH4/H2 flame at 1 atm, with final flame temperature in the range
1850-2500 K. Results showed that the rate of production of NOx was too high to
be explained entirely by the Zeldovich mechanism. The inclusion of the new NNH route gave reasonable good agreement with experimental measurements. Moreover, the results showed no distinction between H2 and CH4 flames, indicating that this
new route cannot be due to the presence of hydrocarbon. So this new NNH route is indeed responsible for producing significant amount of NOx in fuel-rich flame
at temperature below about 2100 K. Rørtveit et al. [16] investigated the effect of diluent addition on NOx formation in hydrogen laminar counter-flow flames. The
addition of CO2 and He to the fuel stream leads to a significant lower
contributions of the N2O and NNH mechanism in these conditions.
Assuming that the NH radicals formed in reaction (1.21) are totally converted into NO and that reaction (1.20) is equilibrated, the rate of NO formation via the NNH mechanism is derived as follows:
d[N O]
dt = 2kf 8Kp,7[N2][O][XH] (1.23) where XHis the mole fraction of free H atoms and Kp,7 is the equilibrium constant
of reaction (1.20) expressed in partial pressure. The factor of 2 arises from the assumption that every NH radicals produced in reaction (1.21) will rapidly react to yield a second molecule of NO. Hayhurst and Hutchinson [15] estimated the product kf8Kp,7 in the range 1800 2500 K as follows:
kf 8Kp,7 = 2.3· 10 15exp
⇣ 2760 T
⌘
cm3/molecules· s 1 (1.24)
Konnov et al. [17] extended the temperature range of kf8Kp,7 from 1800 2500 K to
1400 2500K using experimental measurement of [OH] and temperature along the axis of laminar, premixed, flat CH4/air and H2/air flame. The author estimated
the temperature dependence as: kf 8Kp,7 = 2.5· 10 15exp
⇣ 3600 T
⌘
cm3/molecules· s 1 (1.25)
1.2 Simplified Reaction Schemes
Computational fluid dynamics is a widely used tool in optimizing combustion equipments and natural gas burners, for instance for emission issues. However, due to computational efforts calculating three-dimensional turbulent flows inter-acting with chemical reactions, there is the necessity for simplified models, in order to simulate the combustion reaction and the NOx formation.
1.2.1 Löffler Scheme
Löffler et al. [18] have recently developed a new simplified reaction scheme to model NOx formation in natural gas combustion. It combines thermal NO formation,
N2O/NO and NNH route. On the contrary Prompt NO route is neglected under
the assumption of fuel-lean conditions. The first step in this mechanism is the evaluation of the main reactions involved in NO formation in a CH4/air flame in
Chapter 1. NOx formation and control
one-dimensional plug flow reactor (PFR) operating under the reaction conditions listed in Table 1.3.
Table 1.3: PFR Löffler Condition. Parameter Value O2(vol%) 10 H2O(vol%) 0 CH4(vol%) 4 N2(vol%) Rest 1.25 T (K) 1873 ⌧(ms) 5
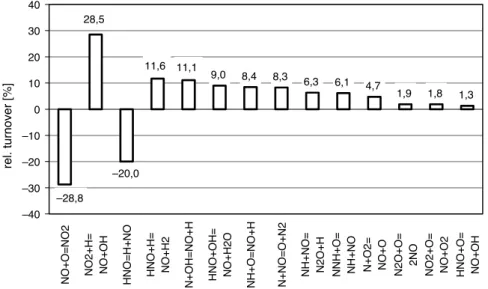
Reaction flow analysis (Figure 1.1) shows that thermal NO formation occurs via N-radical, while N2O/NO route passes N2O and partly NH. Although HNO
and NO2 are formed via NO, they are almost completely converted back. Thus,
these species can be neglected for net NO formation. Dupont et al. [18] stated that there are several
uncertainties in Eq. (3) with regard to the rate of Reaction (R4) as well as the partial equilibrium assumptions. In Fluent, the adapted model of de Soete [19], based on experimental observations, is implemented:
d½NO"
dt Z fk½O2"
a
½N2"½Fuel"eKEa=RT (4)
With f being a correction factor for higher hydrocarbons than CH4: f Z 4:75 C 0:0819nK23:2f C 32f2K12:2f3; 0:6% f% 1:6 (5) a Z 1:0 XO2!4:1!10K3 K3:95K0:9 ln XO2 4:1!10K3%XO2!1:11!10K2 K0:35K0:1 ln XO2 1:11!10K2%XO2!3!10K2 0 3!10K2%XO2 8 > > > > > < > > > > > : (6) f is the overall equivalence ratio of the flame, while n denotes the number of carbon atoms in the fuel. This model suffers from the assumption that NO formation is proportional to the fuel concentration, assuming partial equilibrium of Reactions (R12)–(R14). Calculations [e.g. 3] show, however, that NO formation is more related to the rate of fuel oxidation. Moreover, all parameters have to be obtained purely empirically, comprising the risk of extrapolating to other conditions than used for fitting.
Lo¨ffler et al. [3] demonstrate that NO formation in methane/air flames becomes significant at temperatures above 1200 8C. For temperatures exceeding 1600 8C, the
thermal NO formation becomes important. At lower temperatures, N2O/NO and NNH routes dominate, while
prompt NO formation is insignificant except for fuel rich conditions. Thereby, the N2O/NO route gain importance
with increasing air-to-fuel ratio, while the NNH route is preferred for fuel rich conditions[3,16,17]. The prompt NO model by de Soete [19] is able to describe the observed trends of NO emissions in a CH4/air flame reasonably,
though in fact NO is formed by the N2O/NO and NNH route.
In this work, a new model for NO formation is proposed. It comprises the thermal NO formation as well as the N2O/NO and NNH route, respectively. Its performance is
evaluated for a CH4/air flame in one-dimensional plug flow
reactor (PFR) against predictions obtained with a detailed chemical reaction mechanism[19].
2. Method
In the following, the proposed simplified NO model is described. Moreover, the detailed chemical kinetic mech-anism applied for the evaluation of the simplified model is discussed. Finally, the combustion conditions for the evaluation are given.
2.1. Simplified NO model
InFig. 5a, the N-flow in NO formation is shown for a CH4/air flame at 1600 8C[3]. It can be seen, that thermal NO
formation occurs via N-radical, while N2O/NO route passes
N2O and partly NH. The NNH route includes besides NNH
also NH and N2O as intermediates. Reaction flow analysis
(refer toFig. 1) shows that HNO and NO2are significant
educts for NO, but converted back from NO immediately.
–20,0 9,0 8,4 8,3 6,3 6,1 4,7 1,9 1,8 1,3 11,1 11,6 28,5 –28,8 –40 –30 –20 –10 0 10 20 30 40
NO+O=NO2 NO2+H= NO+OH HNO=H+NO HNO+H=
NO+H2
N+OH=NO+H HNO+OH= NO+H2O NH+O=NO+H N+NO=O+N2 NH+NO=
N2O+H NNH+O= NH+NO N+O2= NO+O N2O+O= 2NO NO2+O= NO+O2 HNO+O= NO+OH
rel. turnover [%]
Fig. 1. Relative conversion of NO within the first 5 ms based on its total formation. Inlet concentration: 4 vol% CH4, 10 vol% O2, temperature 16008C.
G. Lo¨ffler et al. / Fuel 85 (2006) 513–523 515
Figure 1.1: Relative conversion of NO within 5 ms based on its total formation [18] Similarly, it is possible to know the most important reactions involving the intermediate species N, N2O, NNH and NH, which are listed in Table 1.4 with
the relative kinetic parameters [18]. However, the formation of N is kinetically limited by the break-up of the N2 triple bond, so it is possible to assume
quasi-steady-state concentration for it. Similar hypothesis can be made for N2O and
NNH because they are formed and converted back to N2 rapidly and the reactions
forming NO from these species are relative slow. The same assumption was made by the authors for NH, which may at least hold at high radical concentrations or
high temperature, where NO formation is significant. Thus, the concentration of these species can be obtained by a set of four algebraic equations, linear in terms of the unknowns:
[N ] =kf 1[O][N2] + kr2[N O][O] + kr3[N O][H] + kf 17[N H][H] kr1[N O] + kf 2[O2] + kf 3[OH] + kr17[H2]
(1.26)
[N2O] =
kr18[OH][N2] + kr15[N O][N H] + kr6[N O][N O] + kr5[N2][O2] + kf 19[N N H][O] + kf 4[N2][O]
kf 18[H] + kf 15[H] + kf 6[O] + kf 5[O] + kr19[H] + kr4 (1.27)
[N N H] =kf 7[N2][H] + kf 20[N2][H][O2] + kr21[N2][HO2] + kr9[N2O][H] + kr8[N H][N O] kr7+ kr20[O2] + kf 21[O2] + kf 9[O] + kf 8[O]
(1.28)
[N H] =kf 8[O][N N H] + kr16[N O][H] + kf 15[N2O][H] + kr17[N ][H2]
kr8[N O] + kf 16[O] + kr15[N O] + kf 17[H] (1.29)
This set of equations can be solved analytically in order to provide a fast computa-tion of the intermediate concentracomputa-tions. This is very important because the species involved in NOxformation are not generally computed during fuel oxidation
calcu-lation, as explained in the beginning of this Chapter. Instead, the concentrations of O2, N2, H2, H2O, O, H, OH, HO2 can be known from combustion calculations.
Finally, the rate of NO formation can be calculated without any model parameter, solely based on reaction kinetics in the following way:
d[N O]
dt =
⇣
kf 1[O][N2] + kf 2[N ][O2] + kf 3[N ][OH] + 2kf 6[N2O][O]+
+ kf 8[N N H][O] + kf 15[N2O][H] + kf 16[N H][O]
⌘ + ⇣
kr1[N O][N ] + kr2[N O][O] + kr3[N O][H] + 2kr6[N O][N O]+
+ kr8[N O][N H] + kr15[N O][N H] + kr16[N O][H]
⌘
(1.30)
The model was compared to more detailed kinetic schemes [19] in a premixed plug-flow reactor under a wide range of conditions achieved varying temperature, methane volume fraction and air-to-fuel-ratio. Results confirmed that NO forma-tion is dominated by the thermal mechanism at temperatures higher than 1800 K. At lower temperatures and with increasing oxygen availability, the N2O mechanism
gave significant contribution, due to the increased O radical. On the contrary, NNH dominated below 1600 K and in fuel rich conditions, when H radicals concentration is higher.
Chapter 1. NOx formation and control
Table 1.4: Kinetic parameters applied to Löffler model [18] Units: mol, cm, s, K
Reactiona Forward Backward
A Ea/R A Ea/R N2+ O kf 1 * ) kr1 N + N O 1.71· 1014 0 38367 3.30· 1012 0.3 0 N + O2 kf 2 * ) kr2 N O + O 6.40· 109 1 3160 4.92· 1012 0 20399 N + OH )kf 3* kr3 N O + H 3.80· 1013 0 0 1.10· 1014 0 23991 N2 + O + M kf 4 * ) kr4 N2O + M 4.13· 1013 0 7890 4.00· 1014 0 28200 N2O + O kf 5 * ) kr5 N2+ O2 1.00· 1014 0 14080 5.26· 1013 0 54745 N2O + O kf 6 * ) kr6 N O + N O 6.60· 1013 0 13390 1.64· 1012 0 32057 N2+ H kf 7 * ) kr7 N N H 1.00· 107 0 0 3.08· 107 0 4149 N N H + O )kf 8* kr8 N O + N H 5.00· 1013 0 0 3.06· 1013 0 6325 N2O + H kf 15 * ) kr15 N O + N H 2.60· 1015 0 16335 2.90· 1014 0.4 0 N H + O)kf 16* kr16 N O + H 9.20· 1013 0 0 5.47· 1014 0 35517 N H + H )kf 17* kr17 N + H2 3.00· 1013 0 0 1.38· 1014 0 12386 N2O + H kf 18 * ) kr18 N2+ OH 3.30· 1010 0 2380 1.24· 109 0 35087 N N H + O)kf 9* kr9 N2O + H 1.00· 1014 0 0 1.47· 1016 0 23174 N2+ H + O2 kf 20 * ) kr20 N N H + O2 1.53· 1014 0 4149 5.00· 1013 0 0 N N H + O2 kf 21 * ) kr21 N2+ HO2 2.00· 1014 0 0 7.72· 1014 0 28790 a k = AT exp( E a/RT ).
1.3 NO
xreducing techniques
Many efforts have been made during the last decades to improve the understanding of NOxformation mechanism and to develop efficient control technologies. In fact,
nitrogen oxides represent a relevant threat for the environment and combustion systems are the major source of such pollutants. In general, it is possible to distin-guish between primary and secondary measures. The first refers to a modification of the combustion process, while the second to a post-combustion NOx clean up,
instead of reducing directly the formation of pollutants. Typical secondary mea-sures are obtained by means of ammonia or urea injections forward the combustion section either in the presence of a catalyst (Selective Catalytic Reduction, SCR) or thermally (Selective Non Catalytic Reduction, SNCR). In SCR ammonia is in-jected near the combustor exit, allowing NOx reductions up to 90%, but it can
be relatively expensive, due to the high cost of the catalyst. On the contrary, in SNCR ammonia is injected in a higher narrow temperature region to ensure the effective action of NH3.
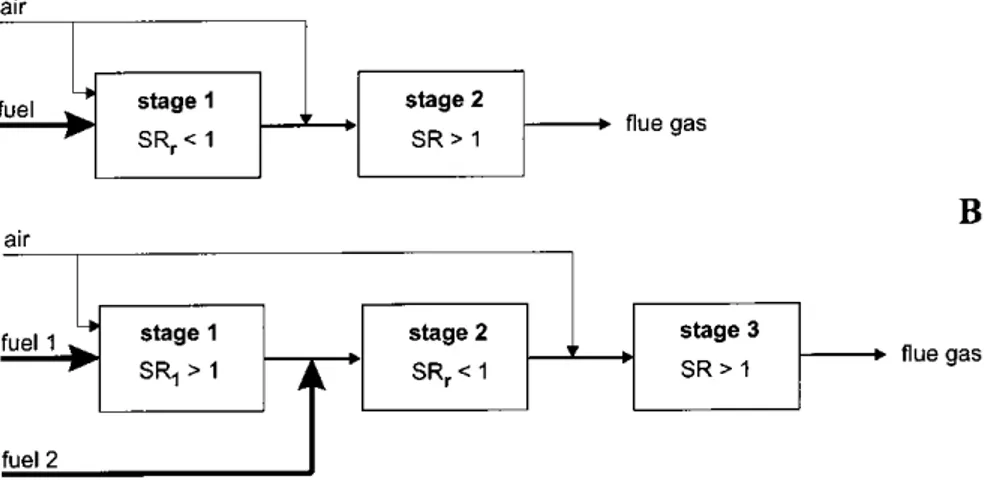
The control of nitrogen oxides production within the combustion section can be achieved by using different approaches, which commonly are: burner design, fuel staging, flame cooling, ultra-lean combustion and flue-gas recirculation. The com-mon goal is the suppression of temperature peaks and reducing the residence time and the oxygen concentration in the high-temperature region. There are two ways to accomplish staged combustion (Figure 1.2), air and fuel staging. The former consists in taking advantage of the stability and low NOx production associated
with rich combustion ( < 1) and subsequently breaking down the unburned CO an H2 in a lean combustion ( > 1). Fuel staging is in principal the same, but
techniques have been investigated for large scale power
plants mainly, fired with gas, oil, or pulverized coal.
Since the importance of renewable energy sources will
grow in the future, clean combustion of solid biomass
is important. But the fuel characteristics of biomass
differ from fossil fuels, hence it remains to show which
primary measures for low NO
xcombustion can be
applied for nonpulverized biomass.
During the thermal degradation of the biomass
sub-stance the main products containing fuel nitrogen after
this conversion process are HCN and NH
3.
3Further
reactions then lead to molecular N
2or to NO when they
are oxidized by the reaction with radicals (O, H, OH).
Figure 3 shows a simplified global reaction path of fuel
nitrogen. Only part of the total nitrogen is converted to
NO
xas Figure 4 illustrates.
1,4,5The goal of staged
combustion techniques is the promotion of the second
reaction path by the creation of optimized conditions
during combustion.
The reduction of fuel-N to molecular nitrogen in air
staging is favored in the fuel rich primary combustion
zone (Figure 5a). Investigations on fixed bed wood
furnaces have shown that a minimum of the total fixed
nitrogen (TFN
) HCN + NH
3+ NO + NO
2+ 2N
2O)
emission from the primary combustion zone is reached
for a stoichiometric ratio of 0.7 to 0.8 and a temperature
of 1100-1200 °C and providing a mean residence time
of 0.5 s.
6After the reduction zone the combustion is
completed in the burnout zone by injection of the excess
air.
Air staging has high demands concerning the fuel
properties. Because of the relatively high temperatures
needed in the reduction zone the fusibility of the fuel
ash is an important fuel property because ash sintering
and slagging disturb the combustion process and
there-fore limits fixed bed combustion. Native wood usually
has the highest melting range, about 1300 °C. The
melting point of other wood fuels as UF-chipboard or
demolition wood as well as of other biomass can be much
lower, depending on their composition or whether they
are mixed with other components. Herbaceous fuels for
example have melting points at 800-900 °C because
they contain relatively high amounts of various
inor-ganic substances which can form new compositions with
low melting points.
7,8Fuel staging or reburning has first been tested on coal
fired utilities using natural gas as reburn fuel.
9In fuel
(2) Nussbaumer, T. Primary and secondary measures for NOx
reduction in Biomass combustion. InDevelopments in Thermochemical Biomass Conversion; Blackie Academic and Professional: London, U.K., 1997.
(3) Aho, M.; Ha¨ma¨leinen, J.; Tummavuori, J. Importance of solid fuel properties to nitrogen oxide formation through HCN and NH3in
small particle combustion.Combust. Flame 1993, 95, 22-30.
(4) Marutzky, R. Erkenntnisse zur Schadstoffbildung bei der Ver-brennung von Holz und Spanplatten. WKI-Bericht; Fraunhofer Ar-beitsgruppe fu¨r Holzforschung 1991, 26.
(5) Winter; F.; Wartha, C.; Hofbauer, H. A NO/N2O classification
system of single fuel particles. In Developments in Thermochemical
Figure 2. Influence of temperature on NOx emission for
biomass combustion.2
Figure 3. Simplified reaction path diagram of the NOx
formation and destruction in the gas phase.
Figure 4. Influence of fuel-N content on the conversion to N-species for biomass in combustion systems1,4,5 (FB: fixed
bed; FBC: fluidized bed combustor).
Figure 5. Principles of air staging (A) and fuel staging (B).
576
Ener
g
y
&
Fuel
s,
Vol
. 15,
N
o
. 3, 2001
Sal
zm
ann and
N
u
ssb
au
m
er
Figure 1.2: Principles of Air Staging (A) and Fuel Staging (B)
Chapter 1. NOx formation and control
the combustion is at the beginning very lean and subsequently more fuel is added to make the mix less lean. In general this technique is very efficient but strongly affected by high implementation costs. Flame cooling adopts water or steam injec-tion in combusinjec-tion chamber which lowers the temperature level, but also reduces the system efficiency leading to a significant increase of CO emissions. Ultra-lean combustion reduces the temperature peaks, but careful attention must be paid to flame stability, in order to avoid extinction.
Mastorakos er al. [20] has recently denoted the internal or external recircula-tion of burnt gases (exhaust gas recircularecircula-tion) as the most efficient technology in NO concentrations lowering. The former is accomplished by recycling part of the exhaust gases to the inlet section by an external pipe, to dilute the fresh reactants (Figure 1.3). The latter is achieved through the entrainment of the exhaust gases driven by the high momentum of the fresh reactants, using a special aerodynamic design of the burner. There are three main ways of creating internal recycling by burner adjustments: confined jets (Figure 1.4), confined jets with swirl (Figure 1.5) and flow past bluff bodies (Figure 1.6). The common idea is to utilize the pressure difference set up by high velocity gas streams. The swirl generator will cause a radial pressure gradient given by the centrifugal force [21]:
dP dr = ⇢
(v✓)2
r (1.31)
This contrary pressure gradient will create a backflow, referred to as central toroidal recirculation zone (CTRZ). The degree of swirl usually is characterized by a swirl number S, given by:
S = G✓ Gxr = Rr 0 ⇢vxv✓rdr [R0r⇢vxvxrdr]r (1.32) Where G✓ is the axial flux of swirl momentum, Gx is the axial flux of the axial
momentum and r is a characteristic radius such as the burner radius or the swirler radius.
1.3.1 MILD Combustion
MILD or flameless combustion is an example of internal recirculation of exhaust gases, which couples high combustion efficiencies with very low pollutants emissions [23][24][25]. It requires temperatures higher than the fuel self-ignition temperature and a strong recirculation of exhaust gases in the reaction zone, which allows di-luting the flame and reducing the final temperature well below the adiabatic flame temperature. Thus, a flame front is not identifiable (flameless) and combustion is
9
Figure 7: External flue gas recirculation system [18]
In internal FGR, the fuel gas is recycled into the flame zone due to burner aerodynamics. There are three main ways of creating internal recycling by burner adjustments; confined jets (Figure 8), confined jets with swirl (Figure 9) and flow past bluff bodies (Figure 10).
Figure 8: Axial confined jet and secondary recirculation [9]
Figure 1.3: External flue gas recirculation system [21]
9
Figure 7: External flue gas recirculation system [18]
In internal FGR, the fuel gas is recycled into the flame zone due to burner aerodynamics. There are three main ways of creating internal recycling by burner adjustments; confined jets (Figure 8), confined jets with swirl (Figure 9) and flow past bluff bodies (Figure 10).
Figure 8: Axial confined jet and secondary recirculation [9]
Figure 1.4: Axial confined jet and secondary recirculation [21]
Figure 9: Creation of a central toroidal recirculation zone resulting from swirl [9]
Figure 10: Recirculation caused by wake behind a bluff body [9]
The principal of all these internal FGRs is to utilize the pressure difference set up by high velocity gas streams. The burner described more closely in the experimental part of this report has a swirl generator mounted at its exit. The swirl generator will cause a radial pressure gradient given by the centrifugal force [9]:
dP v2
dr r (2-13)
As the swirl dissipates, the pressure increases along the axial line. This contrary pressure gradient will create a backflow, referred to as central toroidal recirculation zone (CTRZ). The degree of swirl usually is characterized by a swirl number S, given by [9]:
Figure 1.5: Creation of a central toroidal recirculation zone resulting from swirl [21]
10 Figure 9: Creation of a central toroidal recirculation zone resulting from swirl [9]
Figure 10: Recirculation caused by wake behind a bluff body [9]
The principal of all these internal FGRs is to utilize the pressure difference set up by high velocity gas streams. The burner described more closely in the experimental part of this report has a swirl generator mounted at its exit. The swirl generator will cause a radial pressure gradient given by the centrifugal force [9]:
dP v2
dr r (2-13)
As the swirl dissipates, the pressure increases along the axial line. This contrary pressure gradient will create a backflow, referred to as central toroidal recirculation zone (CTRZ). The degree of swirl usually is characterized by a swirl number S, given by [9]:
Figure 1.6: Recirculation by means of a bluff body [22] 15
Chapter 1. NOx formation and control
extended to a larger portion of the combustion chamber. This system approaches perfectly stirred reactor (PSR) conditions and it is characterized by a more uniform temperature, avoiding peaks and thus, leading to lower NOx emissions. Critical
is-sues of such technology are the realisation of thermofluidynamic conditions, which stabilize the flameless combustion process, and the design of recuperative or regen-erative heat exchangers, which use the combustion products for preheating.
In contrast to stabilized flames combustion, flameless oxidation is mixture and temperature controlled and it is achieved with specific flow and temperature con-ditions. The balance between flow velocity and flame velocity is an important prerequisite in traditional combustion system, while creating flow conditions for flame stability is an essential burner design criterion, which can be achieved using swirl or bluff body. Exhaust gas recirculation lowers the oxygen concentration and increases the content of inerts of a mixture. Following Wünning and Wünning [23] it is possible to define the amount of exhausts recirculated in the reaction zone as:
kR=
˙ mE
˙
mA+ ˙mF (1.33)
where ˙mE is the net mass flow rate of recirculated flue gas, while ˙mA and ˙mF
are the fuel and air mass flow rates, respectively.
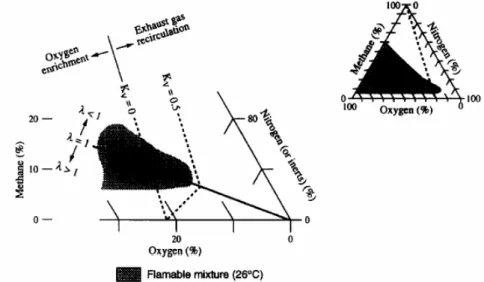
Flammability limits for combustion of hydrocarbons and air show that it is pos-sible to achieve flammable mixtures for recirculation rates of kR6 0.5 (Figure 1.7)
[26]. Above this limit, extinction occurs, due to the lower oxygen concentration and higher inerts in the mixture. To provide reliable operating conditions in partic-ular systems, exhaust gas recirculation rates kR 0.3 are used as a NOx reducing
technique.
Chapter 1. Flameless combustion of hydrogen-rich fuels
Creating flow conditions for flame stabilization is an essential burner design criterion. In conventional burners design swirl or bluff body are most often used to create stagnation points or areas of low velocity for stabilization.
Exhaust gas recirculation lowers the oxygen concentration and increases the content of inerts of a mixture. Flammability limits for combustion of hydrocarbons and air show, that it is possible to achieve flammable mixtures for recirculation rates of kR≤ 0.5 (Figure 1.2). To provide reliable operating conditions in particular systems, exhaust gas recirculation rates of
≤
R
k 0.3 are used as a NOx-reducing technique.
The recirculation degree is defined as (Wünning and Wünning, 1997):
F A E R m m m k & & & + = (1.1)
where m&E is the mass flow rate of exhaust gases recirculated into the reaction region, whereas A
m& and m& are the air and fuel mass flow rates, respectively. F
Figure 1.2 - Flammability limits for methane-air mixtures (Zabetakis, 1965).
It was found (Wünning, 1991), that under special conditions, a stable form of combustion is also possible for much higher recirculation rates.
Under ideal conditions, such combustion process takes place without any visible or audible flame (“Flameless Oxidation”). Figure 1.3 shows a schematic diagram of the stability limits
Figure 1.7: Flammability limits for methane-air mixture [26] 16
Chapter 1. NOx formation and control
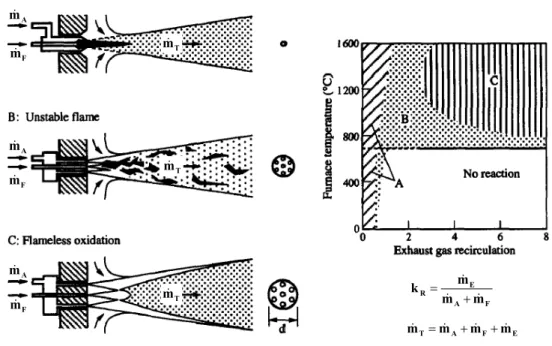
Figure 1.8 shows a schematic diagram of the stability limits for the combustion of methane in air, as a function of kR and the operating temperature. Stable
flames (A) are possible over the whole range of combustion chamber temperature but only for recirculation rates up to 30%. For higher recirculation rates, the flame will become unstable (B), lift off and finally blow out (for temperatures below self ignition). If the furnace temperature and the exhaust gas recirculation are sufficiently high, the fuel can react in the steady, stable form of flameless oxidation (C), without limitations of the recirculation degree.
8 for different combustion modes. Stable flames 'A' are possible over the whole range of combustion chamber temperature but only for recirculation rates up to 30%. For higher recirculation rates, the flame will become unstable 'B', lift off and finally blow out (for temperatures below self ignition). If the furnace temperature and the exhaust gas recirculation are sufficiently high, the fuel can react in the very steady, stable form of flameless oxidation 'C'.
As it can be seen from the diagram, it is not possible to operate a burner in flameless mode in a cold combustion chamber. Therefore, the combustion chamber must be heated up with flames and then could be switched to flameless oxidation. An idealized operating scheme is shown in Figure 1.4.
Firstly, combustion air is mixed with recirculated exhaust gas; then fuel is added in step “II”. The maximum or adiabatic temperature rise due to the oxidation process can be effectively reduced to few hundred Kelvin, if enough exhaust gas are recirculated in the reaction zone. In a third step, the energy has to be withdrawn from the combustion products in order to control the temperature level in the combustion chamber; however, the temperature levels need to be kept on a certain level to guarantee reaction in step “II”. Air preheat could be applied, but is not compelling.
F A E R m m m k & & & + = A m& F m& A m& F m& A m& F m& T m& T m& T m& E F A T m m m
m& = & + & + &
Figure 1.3 - Stability limits (Wünning e Wünning, 1997).
Figure 1.8: Stability diagram for methane-air combustion [23]
An idealized operating scheme for flameless combustion is shown in Figure 1.9. In fact, as it can be deduced from Figure 1.8, it is not possible to operate a burner in flameless mode in a cold combustion chamber, so it must be heated up with flames and then could be switched to flameless oxidation. Firstly, combustion air is mixed with recirculated exhaust gas (region I), then fuel is added in step II and combustion takes place. The maximum temperature rises due to the oxidation process can be effectively reduced to few hundred Kelvin, if enough exhaust gas are recirculated in the reaction zone. In region III, energy must be withdrawn from the combustion products in order to control the temperature level in the combustion chamber, which must be kept on a certain level to guarantee reac-tion in step II. The main advantage of flameless combusreac-tion is the great potential of the technology for the reduction of NO emissions. The absence of tempera-ture peaks reduces NO formation through the thermal mechanism even with large
Chapter 1. NOx formation and control
Chapter 1. Flameless combustion of hydrogen-rich fuels
9 Figure 1.4 – Idealized process of flameless oxidation (Wünning e Wünning, 1997).
The technical realization of the illustrated operation steps are shown with regard to the burner schematized in Figure 1.5. The burner has two air supplies to operate in flame mode, to heat up the furnace, as well as in flameless oxidation mode. In flame mode, fuel is brought by the fuel supply “1” and the gas nozzle “4” into the central primary combustion chamber “5”. The air “2” is supplied also to that chamber. The burner operates like a conventional high velocity burner with a spark plug ignition and a stabilized flame. At the end of the heat up cycle, the air valve at the air supply “2” is closed and then, the air is supplied by a second air supply “3” through air nozzles “6”, which are arranged concentric around the combustion chamber “5”. The air jet “A” aspirates exhausts as well as the fuel jet “B” from the surroundings “D”. The reaction in zone “C” could not take place earlier as when the air and fuel jets meet. At that point, the jets have already mixed with a large amount of exhaust gases.
Figure 1.5 – Burner for flame and flameless oxidation mode. (Wünning and Wünning, 1997) Figure 1.9: Idealized flameless oxidation [23]
fuel/oxidiser preheating. This was pointed out by Wünning and Wünning [23] using an experimental apparatus (Figure 1.10) for both temperature and flow field measurements in flameless and flame regimes. Recuperative burners (Figure 1.11) were mounted at the bottom of the chamber, firing vertically into a cylindrical, air cooled chamber. The non-cooled probe was inserted from the top and could be positioned fully automatic throughout almost the whole furnace.
Chapter 1. Flameless combustion of hydrogen-rich fuels
10 This operation determines a reduction of O2 concentration in the reaction region and an
increase of inert species. Temperature rises are limited to 200-400°C and combustion takes place without a defined flame front. The system approaches well stirred reactor conditions.
The main advantage of flameless combustion is the great potential of the technology for the reduction of NO emissions. The absence of temperature peaks reduces NO formation through the thermal mechanism even with large fuel/oxidiser pre-heating. This was pointed out by Wünning and Wünning (1997) using an experimental apparatus (Figure 1.6) for temperature and flow field measurements in flameless and flame regimes. Recuperative burners are mounted at the bottom of the chamber, firing vertically into a cylindrical, air cooled chamber. The non-cooled probe was inserted from the top and could be positioned fully automatic throughout almost the whole furnace. The probe was equipped to measure temperature, using a 50 µm PtRh Pt thermocouple, pressure and gas samples.
fuel air eductor eductor burner cooling pipes cooling air inlet and outlet
positioning device axial radial
probe
Figure 1.6 – Experimental apparatus used by Wünning and Wünning (1997)
Chapter 1. NOFigure 1.6: Experimental apparatus used by Wünning and Wünning [2].x formation and control
Figure 1.7: FLOX® recuperative burner [2]. 16
Figure 1.11: FLOX®recuperative burner [23]
Figure 1.12 shows time resolved temperature measurements in the burner op-erated in flame, lifted flame and FLOX®mode. It can be observed how both flame
and flameless oxidation mode show steady temperature conditions. NO and noise are substantially higher in flame mode, compared to FLOX®mode. Moreover,
Wünning and Wünning [23] supported experimental investigation with numerical simulation finding good agreement between measured and calculated temperature and velocity profiles, thus showing the advisability of CFD as predicting tool for flameless.
Chapter 1. Flameless combustion of hydrogen-rich fuels
Figure 1.7 shows time resolved temperature measurements in the burner operated in flame, lifted flame and FLOX® mode. It can be observed how both flame and flameless oxidation mode show steady temperature conditions. NO and noise are substantially higher in flame mode, compared to FLOX® mode. NO and noise are in-between for the lifted flame but the
temperature signal is highly unstable.
Moreover, Wünning and Wünning (1997) supported experimental investigation with numerical simulation finding good agreement between measured and calculated temperature and velocity profiles, thus showing the advisability of CFD as predicting tool for flameless.
Figure 1.7 – Time resolved temperature measurement for flame, unstable and flameless regime (Wünning, 2003).
Cavigiolo et al. (2003) investigated the effect of the recirculation degree on the transition from flame to flameless combustion regimes in a pilot burner fed with methane and ethane. The transition was found to be a critical phenomenon, showing a drastic reduction of NO emission from conventional combustion values of 500 to 10 ppm.
Plessing et al. (1998) measured temperature and species concentration with optical techniques in flame and flameless conditions. Figure 1.8 shows a comparison of temperature and OH radicals concentration between the two cases.
It can be observed that the maximum temperatures decrease, from 1900 to 1650 °C, when switching from flame to flameless mode. In addition OH radicals are present in lower concentration (below 10 ppm) in flameless regime, thus reducing NO prompt formation.
Figure 1.12: Time resolved temperature measurement for flame, unstable and flameless regime [23]
Chapter 1. NOx formation and control
1.3.2 SNCR technique
The Thermal DeNOx process was developed by Richard Lyon [27] at EXXON in
the early 1970s. It is a selective, non-catalytic reduction of NO (SNCR), using NH3 or urea (CO(NH2)2) as the reduction agent and it is widely used for NOx
control in combustion of fuel such as biomass and waste, where catalytic cleaning may be prohibitive. Hereafter, works by Miller et al. [28] pointed out that the complex reaction sequence by which the ammonia removes the nitric oxide has several important properties:
• The reaction requires oxygen in order to remove NO.
• The reaction is self-sustaining, it does not require the addition of other fuel compounds.
• Nitric oxide removal is possible only in a narrow temperature range centred at T ⇠ 1250 K. At temperature below 1100 K no reaction takes place, while at temperature above 1400 K the ammonia is oxidized to form NO rather than destroy it.
• The presence or absence of water has relatively little effect on NO removal. • The reaction is not explosive. It takes place relatively smoothly in the course
of approximately 0.1 s.
In the presence of water (i.e., in normal combustion products) ammonia is con-verted to NH2by reaction with hydroxyl, which hereafter reacts with NO producing
free radicals. N H3+ OH kf 41 * ) kr41 N2+ H2O (1.34) N H2+ N O kf 53 * ) kr53 N2+ H2O (1.35) N H2 + N O kf 54 * ) kr54 N N H + OH (1.36)
The process is limited at high temperatures by the chain-branching sequence occur-ring too rapidly, thus producing hydroxyl concentrations so large that the reaction of NH2 with OH is able to compete with the reactions (1.34)-(1.35).
N H2+ OH kf 27 * ) kr27 N H + H2O (1.37) N H + O2 kf 26 * ) kr26 N O + OH (1.38)
N H2+ O2 kf 25 * ) kr25 HN O + O (1.39) followed by HN O + M )kf 31* kr31 H + N O + M (1.40) HN O + OH )kf 55* kr55 N O + H2O (1.41)
Therefore at temperature greater than T ⇠ 1400 K there is a net increase in the nitric oxide.
The challenge in understanding the detailed chemistry of the Thermal DeNOx process concerns the lifetime and reactivity of NNH. When NNH is allowed to dissociate immediately, in line with the theoretical estimates of its lifetime, the reaction becomes explosive. Thus, the experimental observation that the system is non-explosive puts limitations on the NNH lifetime. Glarborg et al. [29] found that this value is about 10 6 s.
![Table 1.4: Kinetic parameters applied to Löffler model [18] Units: mol, cm, s, K](https://thumb-eu.123doks.com/thumbv2/123dokorg/8064547.123686/10.892.140.777.281.961/table-kinetic-parameters-applied-löffler-model-units-mol.webp)
![Figure 1.5 – Burner for flame and flameless oxidation mode. (Wünning and Wünning, 1997) Figure 1.9: Idealized flameless oxidation [23]](https://thumb-eu.123doks.com/thumbv2/123dokorg/8064547.123686/16.892.283.606.111.332/figure-flameless-oxidation-wünning-wünning-idealized-flameless-oxidation.webp)
![Figure 1.7: FLOX ® recuperative burner [2].](https://thumb-eu.123doks.com/thumbv2/123dokorg/8064547.123686/17.892.229.648.111.452/figure-flox-recuperative-burner.webp)
