29
CHAPTER 3
The acid dissociation constants (pKA) of PADA
The values of pKA1 and pKA2 of PADA have been measured in water and in the
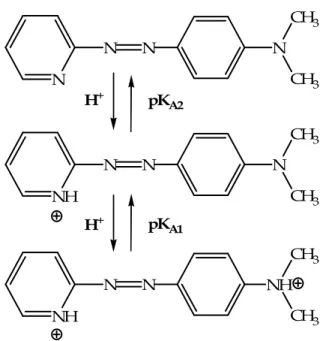
presence of various concentrations of SDS and DTAC with the purpose of providing the coefficients that allow the conversion of pH from water to surfactant surface. Moreover, the knowledge of the pK value of a ligand can be essential for the analysis of the mechanisms of the reactions where the ligand itself is involved. Figure 3.1 shows the protonation/deprotonation steps of PADA and the protonation sites proposed by Klotz e Loh Ming (1953).
N N N N CH3 CH3 NH N N N CH3 CH3 NH N N NH CH3 CH3 pKA1 pKA2 H+ H+
30
The different extent of PADA dissociation in DTAC, H2O or SDS is clearly
revealed by the colour change displayed by the dye present in the three distinct media. Figure 3.2A shows that, at pH = 5, in water the dye solution is orange, corresponding to the sum of the contributions of the mono-protonated and neutral forms; in the more acidic surface of SDS the adsorbed dye impart a fucsia colour to the solution corresponding to the mono-protonated PADA; in the less acidic surface of DTAC the adsorbed dye exhibits a yellow colour corresponding to the neutral, proton free, form of PADA. The spectra of the three solutions are shown in Figure 3.2B.
Figure 3.2 (A) Colour of PADA solutions in different media (respectively in H2O or
0.02M SDS and 0.02M DTAC micellar systems); (B) spectral changes of PADA in the same different media. [PADA] = 1
×
10-5M, pH = 5.0, T = 25°
C.3.1 Determination of pKA1 and pKA2 of PADA in water
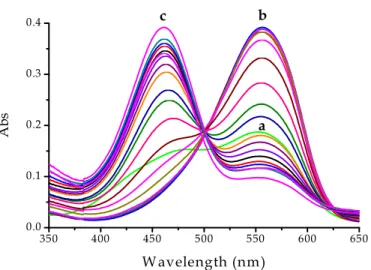
The acid dissociation constants of PADA were measured in aqueous solution at 25°C by spectrophotometric titrations. Calibrated small amounts of HCl were sequentially added to the spectrophotometric cell containing 2.00 ml of an aqueous solution at pH = 7.0 (not buffered). Under these circumstances PADA was present essentially as the fully deprotonated species. Figure 3.3 shows the spectral changes of the dye induced by addition of HCl.
H2O SDS DTAC 300 400 500 600 700 0.0 0.1 0.2 0.3 0.4 0.5 A b s Wavelength (nm) SDS H2O DTAC (A) (B)
31 350 400 450 500 550 600 650 0.00 0.06 0.12 0.18 0.24 0.30 0.36 c b A b s Wavelength (nm) a
Figure 3.3 Spectral changes of 1
×
10-5 M PADA in aqueous solution induced by addition of HCl at different pH values (pH = 0.4÷
7.0), I = 0.1 M (NaCl),T = 25 °C; (a) pH = 7, green line, corresponding to L, (b) pH = 2.5 corresponding to HL+ with small contribution from H2L2+, (c) pH = 0.4 corresponding to H2L2+.The dissociation constants of PADA, KA1 and KA2, were evaluated using the
absorbance data at λ = 560 nm. Figure 3.4 shows a typical titration curve which
displays a biphasic behavior in agreement with the two protonation steps represented in the scheme of Figure 3.1.
0.00 0.02 0.04 0.06 0.08 0.10 0.12 0.14 0.0 0.2 0.4 0.6 0.8 1.0 1.2 1.4 10 −4 ∆ A / C L (M -1 ) [HCl] (M)
Figure 3.4 Typical spectrophotometric titration curve aimed to determine the
dissociation constants of PADA. CL = 1
×
10-5 M, I = 0.1 M (NaCl),λ
= 560 nm, T = 25 °C.32
The titration behavior has been analyzed using a non linear least-square treatment of data points according to equation 3.1 (see Appendix I).
[ ]
[ ]
[ ]
A1[ ]
A1 A2 2 2 1 1 A 2 L H K H K K H H K C A + + ε ∆ + ε ∆ = ∆ + + + + (3.1)where CL is the total dye concentration, ∆A is the absorbance change (A – A0),
∆ε2 = εH2L - εL and ∆ε1 = εHL - εL. The continuous line in Figure 3.4 represents the
best fit to data points according to equation 3.1.
3.2 Determination of pKA1 and pKA2 of PADA in SDS.
The dissociation constant of PADA in the presence of SDS were determined by the same procedure adopted for measurements in water. Figure 3.5 shows the spectral variations of PADA in 0.02 M SDS induced by increasing additions of HCl. 350 400 450 500 550 600 650 0.0 0.1 0.2 0.3 0.4 c A b s W avelength (nm ) a b
Figure 3.5 Spectral changes of 1
×
10−5 M PADA in 0.02M SDS, induced by addition of HCl at different pH values (pH = 7÷1.4), T = 25 °C; (a) pH = 7, green line, corresponding to L and HL+, (b) pH = 4 corresponding to HL+ with small contribution from H2L2+, (c) pH = 1.4 corresponding to H2L2+.33
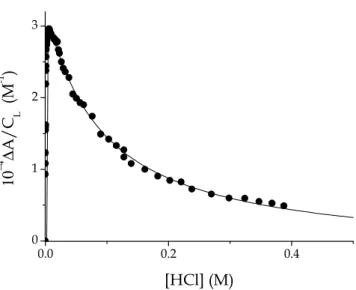
Figure 3.6 Titration curve aimed to evaluate the dissociation constants of PADA in
SDS. [PADA] = 1
×
10−5 M, [SDS] = 0.06M, I = 0 M (NaCl),λ
= 560 nm, T = 25 °C.The data have been processed on the basis of equation 3.1 and the values of KA1, KA2, pKA1 and pKA2 obtained at different SDS concentrations are reported
in Table 3.1.
Table 3.1 Acid dissociation constants of PADA, measured at different concentrations
of SDS, I = 0.1M (NaCl) and T = 25 °C. [SDS]/M KA1/M KA2/M pKA1 pKA2 0 1.1×10⁻² 3.2×10⁻⁵ 2.0 (2.0a) 4.5 (4.5a) 0.01 1.3×10⁻³ 4.6×10⁻⁶ 2.89 5.34 0.02 9.1×10⁻⁴ 1.0×10⁻⁶ 3.04 5.99 0.03 7.1×10⁻⁴ 2.5×10⁻⁵ 3.15 4.60 0.04 5.5×10⁻³ 3.6×10⁻⁴ 2.26 3.44 0.05 1.5×10⁻² 1.2×10⁻⁴ 1.81 3.92 0.07 1.3×10⁻² 2.0×10⁻⁴ 1.89 3.70 a James e Robinson, 1978 0.0 0.2 0.4 0 1 2 3 10 −4 ∆ A / C L ( M -1 ) [HCl] (M)
34
3.3 Determination of pKA1 and pKA2 of PADA in DTAC.
The methodology employed is the same as that used in water and SDS. Figure 3.7 shows how the spectra of PADA in DTAC change upon addition of HCl to the dye/DTAC mixture. Figure 3.8 represents a typical titration curve recorded at 560 nm. The data points have been processed again according to equation 3.1 and the values of the acid dissociation constants of PADA are represented in Table 3.2 for different DTAC concentrations.
Figure 3.7 Spectral changes of 5
×
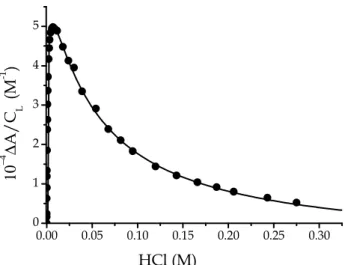
10−6 M PADA in the presence of 0.04 M DTAC induced by addition of HCl at different pH values (pH = 5÷0.4), T = 25°C; (a) pH = 5, green line, corresponding to L, (b) pH = 1.64 corresponding to HL+ with small contribution from H2L2+ and L, (c) pH = 0.4 corresponding to H2L2+.Figure 3.8 Titration curve aimed to evaluate the dissociation constants of PADA in
DTAC. [PADA] = 1
×
10−5 M, [DTAC] = 0.06 M, I = 0.1 M (NaCl),λ
= 560 nm, T = 25 °C. 350 400 450 500 550 600 650 0.0 0.1 0.2 0.3 0.4 0.5 A b s Wavelength (nm) a b c 0.00 0.05 0.10 0.15 0.20 0.25 0.30 0 1 2 3 4 5 10 −4 ∆ A / C L ( M -1 ) HCl (M)35
Table 3.2 Acid dissociation constants of PADA measured at different concentrations of
DTAC, I = 0.10 M (NaCl), T = 25 °C. [DTAC]/M KA1/M KA2/M pKA1 pKA2 0 1.1×10⁻² 3.2×10⁻⁵ 2.0 (2.0a) 4.5 (4.5a) 0.01 3.9×10⁻² 1.9×10⁻⁴ 1.41 3.72 0.02 4.5×10⁻² 1.9×10⁻⁴ 1.35 3.72 0.03 5.0×10⁻² 5.6×10⁻⁴ 1.30 3.25 0.04 5.1×10⁻² 1.1×10⁻³ 1.29 2.96 0.05 4.8×10⁻² 1.6×10⁻³ 1.32 2.80 0.06 4.6×10⁻² 2.4×10⁻³ 1.34 2.62 a James e Robinson, 1978
All the results concerned with the equilibrium parameters described in this section are summarized in Table 3.3.
Table 3.3 Acid dissociation constants of PADA measured in different media.
Medium [Surfactant]/M pKA1 pKA2 ∆pKA1 ∆pKA2
H2O 0 1.93 4.5 0 0
SDS 0.03 3.15 4.60 1.22 0.10
DTAC 0.03 1.30 3.25 -0.63 -1.25
3.4Discussion of the results presented in Chapter 3
The data reported in Table 3.3 show that the acid dissociation constants of PADA do change in the presence of the surfactants in opposite direction. The ∆pK values (∆pK = pKsurfactant – pKwater) are positive in the presence of SDS
whereas they are negative in the presence of DTAC. Denoting the deprotonated dye as L, the two acid dissociation equilibria are expressed by the reactions 3.2 and 3.3.
(3.2)
36
(3.3)
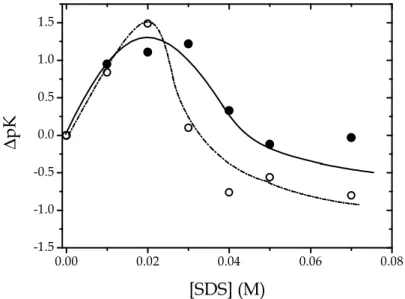
The PADA/SDS system. Figure 3.9 shows the changes of pKA1 and pKA2 of
PADA in SDS, relative to the pKA1 and pKA2 values in water.
0.00 0.02 0.04 0.06 0.08 -1.5 -1.0 -0.5 0.0 0.5 1.0 1.5 ∆ p K [SDS] (M)
Figure 3.9 Dependence of ∆pKA1 and ∆pKA2 on the SDS concentration for the PADA/SDS system; (●) ∆pKA1, (
○
) ∆pKA2, I variable with the surfactant concentration, T = 25°C.The increase of both ∆pKA1 and ∆pKA2 values by about 1.5 units from [SDS] = 0
M to [SDS] = 0.02 M can be explained in terms of the electrostatic potential effect expressed by equation 3.2. The subsequent asymptotic decrease of both ∆pKA1 and ∆pKA2 observed for [SDS] > 0.02 M can be explained on the basis of
a change of the surface potential of SDS as the number of surface-charges per volume unit increases. Actually, the density of the counter-ions responsible for formation of the double-layer in the vicinity of the micelle surface diminished by increasing [SDS] since the counter-ions are diluted over an enhanced number of charge-sites on the micelle surface. As a consequence, the surface potential decreases.
A kinetic explanation for the observed behavior could be forwarded. The abrupt increase of pKA1 and pKA2 observed up to [SDS] = 0.02 M is rationalized
37
in terms of the “catalytic” effect exerted by charged micelles on reactions involving ions oppositely charged with respect to the micelle. Actually, the micelle acts as a nanoreactor where the partners of a given reaction can be concentrated so that the reaction rate is enhanced. Concerning the PADA/SDS system, the effect of SDS is to increase the specific rate of H2L2+ formation (kass)
because the encounter frequency between H+ and HL+ is enhanced, while the
specific rate of H2L2+ dissociation (kdiss) remains uncharged (being this a
monomolecular step). As a consequence the equilibrium constant (KA1 = kdiss/
kass) decreases and pKA1 increases. The decreasing trend observed for [SDS] >
0.02 M can also be explained on a kinetic ground. As [SDS] increases the reaction partners distribute over a larger number of charge-sites. Such a dilution effect results in a decrease of the specific rate kass while kdiss remains
unchanged. The obvious conclusion is that pKA1 experiences an asymptotic
decrease.
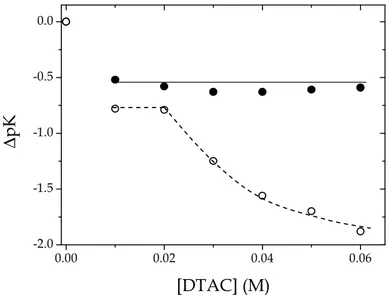
The PADA/DTAC system. Figure 3.10 shows the dependence (relatives to the
values in water) of pKA1 and pKA2 of PADA on the DTAC concentration.
0.00 0.02 0.04 0.06 -2.0 -1.5 -1.0 -0.5 0.0 ∆ p K [DTAC] (M)
Figure 3.10 Dependence of ∆pKA1 (●) and ∆pKA2 (
○
) on DTAC concentration for the PADA/DTAC system; I given by surfactant concentration, T = 25 °C.38
Note that pKA1 values are independent on [DTAC]. Contrary to the case of
PADA/SDS, in this case the species H+, HL+ and H2L2+ are repelled by the
positively charged micelle. Only the neutral species L is likely transferred to the micellar pseudo-phase. Consider now the first proton transfer step (reaction 3.2). Here, all the reacting species are positively charged and stay away from the micelle. The reaction 3.2 occurs essentially in the aqueous phase and hence the equilibrium is not affected by the change of DTAC concentration as shown in Figure 3.10.
Consider now the second proton transfer step (reaction 3.3). Here H+ and HL+
ions are repelled by DTAC micelles and stay in the aqueous phase, but the neutral species L is likely to be at least partially absorbed on the micelles owing to its hydrophobic characteristics. Let’s define the distribution ratio as
R = [L]surfactant/[L]water (3.4)
and the mass conservation equation for L as
[L]T = [L]surfactant + [L]water (3.5)
The overall, experimentally measured, dissociation constant of PADA is
KA2T = [H+]T [L]T/[HL]T (3.6)
Taking into account that [H+]T = [H+]water and [HL+]T = [HL+]water, introduction
of equation 3.4 in equation 3.5 and introduction of the result in equation (3.6) yields
KA2T = KA2water (1 + R) (3.7)
As the DTAC concentration is raised, more and more ligand molecules will be
39
consequence according to equation 3.7 and pKA2 will decrease asymptotically
as shown in Figure 3.10.
It has been observed that, keeping the acidity level constant (pH = 5.5), the colour of PADA changes from pink to orange on increasing the NaCl concentration (Figure 3.11). As known, PADA is a bi-protonated azo-dye that changes its colour from pink to orange and yellow upon conversion to the deprotonated, forms.
Figure 3.11 The colour of PADA solutions, at constant hydrogen ion concentration,
apparently depends on the concentration of added chloride; [PADA] = 4
×
10-5 M, [SDS] = 0.02 M, pH = 5.5, T = 25°
C.An explanation for this behaviour could be found in the competition between
PADA and the Na+ ions for the SDS surface. Both molecules tend to be retained
on the micelle and, as [Na+] is increased, the dye molecules, which at pH = 5.5
are present as HL+ and as H2L2+, will be pushed from the SDS surface into the
aqueous pseudo-phase where they deprotonate according to the ∆pKA
argument, with concomitant change of colour. A confirmation of this interpretation is provided by the picture of the three samples shown below (Figure 3.12). There, the Na+ concentration is the same (0.25 M) in the three
cuvettes, while the concentration of Cl− ions changes. The colour of the three solutions remains constant, revealing that the responsible for the observed behaviour are the Na+, and not the Cl−, ions.
[Cl-] [Cl-] [Cl-] [Cl-] [Cl-] [Cl-] [Cl-]
40
Figure 3.12 The colour of PADA (4
×
10-5M) does not change in different chloride concentrations at constant ionic strength, pH = 5.5; (a) [NaCl] = 0.02 M, [NaClO4] =0.23 M, (b) [NaCl] = 0.10 M, [NaClO4] = 0.15 M, (c) [NaCl] = 0.25 M.


![Figure 3.11 The colour of PADA solutions, at constant hydrogen ion concentration, apparently depends on the concentration of added chloride; [PADA] = 4 × 10 -5 M, [SDS]](https://thumb-eu.123doks.com/thumbv2/123dokorg/7554693.109755/11.892.210.732.386.591/solutions-constant-hydrogen-concentration-apparently-depends-concentration-chloride.webp)