5 TRANSIENTS
DESCRIPTION:THERMALHYDRAULIC
AND NEUTRONIC MODELING
5.1 TRANSIENTS DESCRIPTION
To characterize the unstable behaviour of a real BWR, a number of sensitivity analyses has been performed in relation to Peach Bottom-2 Low Flow Stability Test Point 3.
5.1.1 Peach Bottom-2 Low Flow Stability Tests
It has been performed three turbine trip tests and many series of Low Flow Stability Tests at Peach Bottom, Unit 2 BWR during the first quarter of 1977.
This reactor was selected since it is a large BWR/4 which reached the end of its Number 2 reload fuel cycle early in 1977, with an accumulated average core exposure of 12.7 GWd/t.
For both types of tests, the dynamic measurements were taken with a high speed digital data acquisition system capable of sampling over 150 signals every 6 milliseconds and the core distribution measurements were taken from the plants local in-core flux detectors. Special fast response pressure and differential pressure transducers were installed in parallel with existing plant instruments to measure the response of important variables in the nuclear steam supply system.
Stability tests were conducted along the low flow end of the rated power-flow line, and along the power-power-flow line corresponding to minimum recirculation pump speed. The reactor core stability margin was determined from an empirical model fitted to the experimentally derived transfer function measurement between core pressure and the APRM, average neutron flux signals.
The Low Flow Stability Tests were intended to measure the reactor core stability margins at the limiting conditions used in design and safety analysis, providing a one-to-one comparison to design calculations.
5.1.1.1
Plan of the experiment
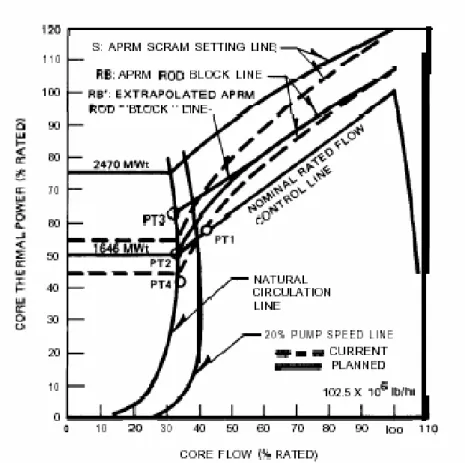
The conditions for the Low Flow Stability Test point 3 were planned to be as close as possible to the reactor operating conditions of extrapolated rod-block natural circulation power. The planned test conditions are shown in figure 5.1
Figure 5.1: Peach Bottom-2 Low Flow Stability Tests. planned test conditions
In order to conduct reactor core stability tests at the Low Flow Test conditions, interim changes in the plant Technical Specification of the APRM Rod Block and Scram Lines were requested from the NRC. The changes proposed for the duration of the low flow testing are given in table 5-1
Table 5-1: Interim technical specification Rod Block and APRM Scram Lines INTERIM TECHNICAL SPECIFICATION ROD BLOCK AND APRM LINES
Current Planned
APRM Flux Scram Line
S=(0.66 x W + 54) x (A/MTPF) S=(0.45 x W + 75) x (A/MTPF) APRM Rod Block Line
S=(0.66 x W + 42) x (A/MTPF) S=(0.58 x W + 50) x (A/MTPF) Where:
- S= setting in % of rated thermal power (3293 MWt)
- W= loop recirculating flowrate in % of rated (rated loop recirculation flow equals 34.2 x 10⁶
lb/hr)
- A= design value of the total core peaking factor (2.63 for 7x7 and 2.44 for 8x8 fuel
- MTPF= operating maximum total peaking factor if greater than A: if less than or equal to A,
MTPF=A
An operation time line was developed for the test program in order to minimize the impact of the testing on the Peach Bottom-2 power production. The planned test sequence is shown in figure 5.2
Figure 5.2: Peach Bottom-2 EOC 2 test planned test operational time line
The strategy for the testing was to conduct the tests on a tightly controlled time schedule which allowed for the xenon transient effects12.
5.1.1.2
Actual Test conditions
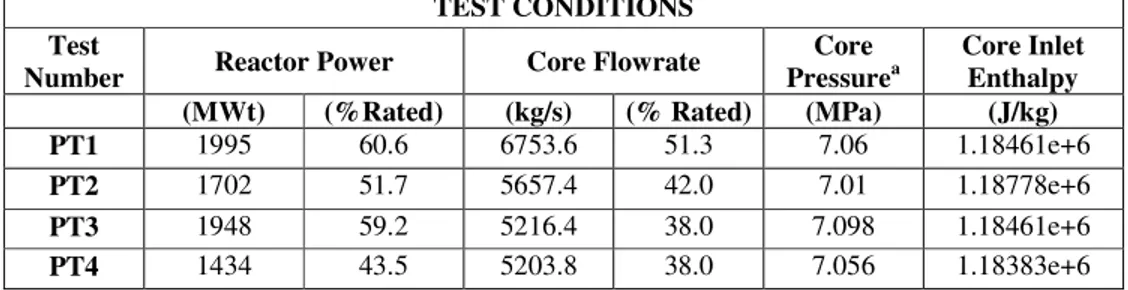
The actual reactor operating conditions at which the low flow core stability testing was conducted are listed in table 5-2.
12 By testing at the maxima or minima in xenon concentration, the waiting time for
stable power level and flux distribution in the core could be reduced from 24 to 5 hours prior to each test.
Table 5-2: Peach Bottom-2 end of cycle 2 test actual Low Flow Stability Test conditions PEACH BOTTOM-2 END-OF-CYCLE 2 TEST ACTUAL LOW FLOW STABILITY
TEST CONDITIONS Test
Number Reactor Power Core Flowrate PressureCore a Core Inlet Enthalpy
(MWt) (%Rated) (kg/s) (% Rated) (MPa) (J/kg)
PT1 1995 60.6 6753.6 51.3 7.06 1.18461e+6
PT2 1702 51.7 5657.4 42.0 7.01 1.18778e+6
PT3 1948 59.2 5216.4 38.0 7.098 1.18461e+6
PT4 1434 43.5 5203.8 38.0 7.056 1.18383e+6
aBased on process computer edit (P1), corrected for steam separator pressure drop
The minimum core flow that could be achieved at test conditions PT2, PT3, and PT4 was limited to that corresponding to about 20% of rated recirculation pump speed, rather than natural circulation core f1ow.13 The reactor power level which could be attained above the rated rod line, PT3, was lower than that which was initially planned. The maximum power level which could be attained was found to be limited by the actual number of high-worth blades which could be withdrawn, under constraints of allowable flux peaking, at this point in the fuel cycle. The process computer average axial power distribution calculations for the Low Flow Stability Test conditions, and the corresponding control rod patterns, are plotted in figures 5.3 and 5.4.
13 Operational problems with the reactor cleanup system limited the duration of natural
circulation operation to approximately 20 minutes before vessel bottom head differential temperature limits would be exceeded; this is insufficient time to conduct one stability test.
Figure 5.3: Peach Bottom-2 Low Flow Stability Test PT3 control rod pattern
Figure 5.4: Peach Bottom-2 Low Flow Stability Test PT3 average axial power distribution The strong effect of the xenon transient occurring during the stability testing can be determined from a plot of the test conditions on a Power/Flow map in Figure 5.5.
Figure 5.5: Peach Bottom-2 Low Flow Stability Tests. actual test conditions
The skewing of the rated rod line between test conditions PT1 and PT2 from the equilibrium xenon calculated line gives an indication of the effect of the xenon transient. The average axial power distribution in the core was found to be stable following the B-hour xenon soak.14 During the Peach Bottom-2 testing, unforeseen changes in plant operation and utility load demand dictated some modification of the planned test sequence plotted in Figure 5.2. It was still possible, however, to utilize the strategy of waiting only for the maxima or minima of the xenon concentration to occur after plant manoeuvring before proceeding with the testing. The first turbine trip test, TT1, was conducted 6 days prior to the Low Flow Stability Test series, and the following two turbine trip tests were conducted 10 and 13 days after the stability testing.
14 Hourly tests of the average axial power distribution indicated local power changes of
5.1.1.3
Test procedures
The reactor was manoeuvred to the test conditions by setting the desired fixed control rod pattern and by using flow control. Small power changes (±5%) during the pre-test xenon soaks were made generally by flow control. When the xenon concentration had reached a local maximum or minimum (about 4-6 hours after initial manoeuvring), the test data were collected.
The test consisted of two sequences: 1. noise recording
2. pseudorandom pressure step recording
For the noise data, three reels of recordings of ten or more minutes each were taken. Process computer edits ODl (LPRM Calibration and Base Data) and PI (periodic log with heat balance data, calibrated LPRM readings, control rod positions, and a failed LPRM and sensor list) were obtained.
Two TIP’s were then set at symmetric locations in the core15, the first at
~117 cm and the second at ~178 cm above the bottom. For the Low Flow Test conditions the APRM scram and rod block slopes and intercepts were recalibrated to the settings specified in the temporary technical specification change (listed in table 5-2).
The pseudorandom pressure step recording was preceded by preliminary trial pressure steps. A single pressure step was run. The signal-to-noise level was examined and, if not adequate, the step size was increased in small increments of about 0.17 bars until the signal-to-noise level was satisfactory. Usually a 0.55 bars step was adequate. Then, with the reactor operator concurrence, a pseudorandom stepping sequence (down, then up) was run with a sampling interval of 1 second; three reels of 10 to 12 minutes of data were taken16.
The perturbation data were evaluated to verify that the following criteria had been met:
1. maximum APRM response for pressure set point steps was less than 220% of
rated (checked prior to start of stepping sequence).
15 Reactor coordinate locations 32-41 and 40-33 as shown in figure 5.3
16 At the conditions PT1 and PT2 were also taken periodic pressure step recordings; after a few
tests the pseudorandom pressure procedure had yielded such excellent results that the uniformly stepping tests were abandoned at the PT3 conditions
2. the decay ratio was less than 1.0 for each process variable that exhibits
oscillatory response to pressure set point changes;
3. the daily offgas increase did not exceed 50%17 of the unit release rate prior to
beginning testing. (Release rate 1 hour after test had to be less than 150% of release rate prior to start of test).
5.2 TRANSIENTS CALCULATIONS
As actual steady state conditions in all the analyses performed in this study, the point 3 test conditions of the Low Flow Stability Tests have been chosen, in such a way that the reactor state is close to the stability boundary in the Power/Flow Map.
Three transient perturbations have been investigated with the objective to study the reactor behaviour in this operating region; all the analyses performed reproduce cases that can normally occur in a BWR reactor; more specifically, the disturbances applied in the several tests are similar to the perturbations used in the reference test.
The various analyses have also been intended to demonstrate the reliability of using small pressure perturbation tests to determine the stability margin of a large BWR core.
The different disturbance cases have been named respectively Case A, B, C, and are described more in detail in the next sections.
Each test has been repeated two times (referred to as CaseA1 and Case A2 for the Test A, Case B1 and Case B2 for the Test B and so on). In the first case, 33 thermalhydraulic channels have been used to model the core and in the second one a single core channel was used, to compare the results obtained with the two different nodalizations18.
17 Limits for test required by PECo
5.2.1 Case A: Two Peak Pressure Perturbation
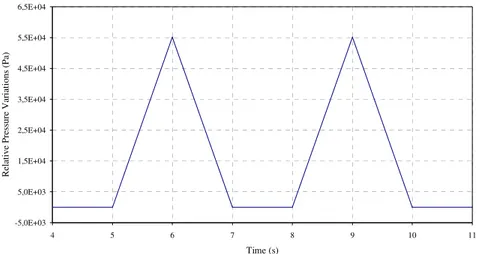
For this case, a pressure disturbance was imposed in the steam line to trigger the transient; the perturbation has the form shown in figure 5.6: a two peak pressure perturbation of about 0.055 MPa.
Figure 5.6: Two peaks pressure perturbation
5.2.2 Case B: Pseudo Random Sequence Pressure
Perturbation
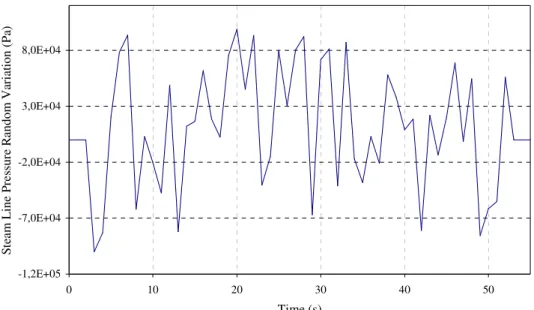
In this analysis a situation very similar to the actual reference case [13] has been considered: the perturbation in steam line pressure consists of a random function with fifty peaks (see figure 5.7): the disturbance starts after 4 seconds since the beginning of the transient and continues for 50 seconds.
-5,0E+03 5,0E+03 1,5E+04 2,5E+04 3,5E+04 4,5E+04 5,5E+04 6,5E+04 4 5 6 7 8 9 10 11 Time (s) R el at iv e Pr es su re V ar ia tio ns (P a)
-1,2E+05 -7,0E+04 -2,0E+04 3,0E+04 8,0E+04 0 10 20 30 40 50 Time (s) St ea m L in e Pr es su re R an do m V ar ia tio n (P a)
Figure 5.7: Pseudo Random Pressure Perturbation
5.2.3 Case C: Two Peak Pressure Perturbation with a
Modified Axial Power Distribution
This calculation has been performed with the purpose to verify how and how much the axial power shape affects the unstable reactor behaviour in these operating conditions.
The transient starts with the control rod movement shown in figure 5.819:
the control rods move in 6 seconds; at the end of the movement the majority of the banks are completely withdrawn and only the bank 7 is almost completely inserted.
19 Each number represents a position of the control rod, e.g. it correspond to a number of 3-inch
0 0 0 0 0 0 0 0 0 0 0 0 0 0 0 0 0 01 1 1 1 1 1 1 1 1 1 1 1 1 1 0 0 0 0 0 01 1 1 1 1 1 1 1 1 1 1 1 1 1 0 0 0 0 0 01 1 1 1 4 4 1 1 4 4 1 1 4 4 1 1 1 10 0 0 0 0 1 1 1 1 4 4 1 1 4 4 1 1 4 4 1 1 1 10 0 0 0 0 0 1 1 1 1 5 5 1 1 6 6 1 1 6 6 1 1 5 5 1 1 1 1 0 0 0 0 0 0 1 1 1 1 5 5 1 1 6 6 1 1 6 6 1 1 5 5 1 1 1 1 0 0 0 0 01 1 1 1 3 3 1 1 3 3 1 1 2 2 1 1 3 3 1 1 3 3 1 1 1 1 0 0 0 0 0 1 1 1 1 3 3 1 1 3 3 1 1 2 2 1 1 3 3 1 1 3 3 1 1 1 1 0 0 0 0 1 1 1 1 5 5 1 1 7 7 1 1 8 8 1 1 8 8 1 1 7 7 1 1 5 5 1 1 1 1 0 0 1 1 1 1 5 5 1 1 7 7 1 1 8 8 1 1 8 8 1 1 7 7 1 1 5 5 1 1 1 1 0 0 1 1 4 4 1 1 3 3 1 1 1 1 1 1 1 1 1 1 1 1 1 1 3 3 1 1 4 4 1 1 0 0 1 1 4 4 1 1 3 3 1 1 1 1 1 1 1 1 1 1 1 1 1 1 3 3 1 1 4 4 1 1 0 0 1 1 1 1 6 6 1 1 8 8 1 1 5 5 1 1 5 5 1 1 8 8 1 1 6 6 1 1 1 1 0 0 1 1 1 1 6 6 1 1 8 8 1 1 5 5 1 1 5 5 1 1 8 8 1 1 6 6 1 1 1 1 0 0 1 1 4 4 1 1 2 2 1 1 1 1 1 1 1 1 1 1 1 1 1 1 2 2 1 1 4 4 1 1 0 0 1 1 4 4 1 1 2 2 1 1 1 1 1 1 1 1 1 1 1 1 1 1 2 2 1 1 4 4 1 1 0 0 1 1 1 1 6 6 1 1 8 8 1 1 5 5 1 1 5 5 1 1 8 8 1 1 6 6 1 1 1 1 0 0 1 1 1 1 6 6 1 1 8 8 1 1 5 5 1 1 5 5 1 1 8 8 1 1 6 6 1 1 1 1 0 0 1 1 4 4 1 1 3 3 1 1 1 1 1 1 1 1 1 1 1 1 1 1 3 3 1 1 4 4 1 1 0 0 1 1 4 4 1 1 3 3 1 1 1 1 1 1 1 1 1 1 1 1 1 1 3 3 1 1 4 4 1 1 0 0 1 1 1 1 5 5 1 1 7 7 1 1 8 8 1 1 8 8 1 1 7 7 1 1 5 5 1 1 1 1 0 0 1 1 1 1 5 5 1 1 7 7 1 1 8 8 1 1 8 8 1 1 7 7 1 1 5 5 1 1 1 1 0 0 0 0 1 1 1 1 3 3 1 1 3 3 1 1 2 2 1 1 3 3 1 1 3 3 1 1 1 1 0 0 0 0 01 1 1 1 3 3 1 1 3 3 1 1 2 2 1 1 3 3 1 1 3 3 1 1 1 1 0 0 0 0 0 1 1 1 1 5 5 1 1 6 6 1 1 6 6 1 1 5 5 1 1 1 1 0 0 0 0 0 0 1 1 1 1 5 5 1 1 6 6 1 1 6 6 1 1 5 5 1 1 1 1 0 0 0 0 0 0 1 1 1 1 4 4 1 1 4 4 1 1 4 4 1 1 1 10 0 0 0 01 1 1 1 4 4 1 1 4 4 1 1 4 4 1 1 1 10 0 0 0 0 01 1 1 1 1 1 1 1 1 1 1 1 1 1 0 0 0 0 0 01 1 1 1 1 1 1 1 1 1 1 1 1 1 0 0 0 0 0 0 0 0 0 0 0 0 0 0 0 0 0 0 0 0 0 0 0 0 0 0 0 0 0 0 0 0 0 0 0 01 1 1 1 1 1 1 1 1 1 1 1 1 1 0 0 0 0 0 01 1 1 1 1 1 1 1 1 1 1 1 1 1 0 0 0 0 0 01 1 1 1 4 4 1 1 4 4 1 1 4 4 1 1 1 10 0 0 0 0 1 1 1 1 4 4 1 1 4 4 1 1 4 4 1 1 1 10 0 0 0 0 0 1 1 1 1 4 4 1 1 5 5 1 1 5 5 1 1 4 4 1 1 1 1 0 0 0 0 0 0 1 1 1 1 4 4 1 1 5 5 1 1 5 5 1 1 4 4 1 1 1 1 0 0 0 0 0 1 1 1 1 2 2 1 1 2 2 1 1 1 1 1 1 2 2 1 1 2 2 1 1 1 10 0 0 0 0 1 1 1 1 2 2 1 1 2 2 1 1 1 1 1 1 2 2 1 1 2 2 1 1 1 10 0 0 01 1 1 1 4 4 1 1 7 7 1 1 7 7 1 1 7 7 1 1 7 7 1 1 4 4 1 1 1 1 0 01 1 1 1 4 4 1 1 7 7 1 1 7 7 1 1 7 7 1 1 7 7 1 1 4 4 1 1 1 1 0 01 1 4 4 1 1 2 2 1 1 1 1 1 1 1 1 1 1 1 1 1 1 2 2 1 1 4 4 1 1 0 01 1 4 4 1 1 2 2 1 1 1 1 1 1 1 1 1 1 1 1 1 1 2 2 1 1 4 4 1 1 0 01 1 1 1 5 5 1 1 7 7 1 1 4 4 1 1 4 4 1 1 7 7 1 1 5 5 1 1 1 1 0 01 1 1 1 5 5 1 1 7 7 1 1 4 4 1 1 4 4 1 1 7 7 1 1 5 5 1 1 1 1 0 01 1 4 4 1 1 1 1 1 1 1 1 1 1 1 1 1 1 1 1 1 1 1 1 1 1 4 4 1 1 0 01 1 4 4 1 1 1 1 1 1 1 1 1 1 1 1 1 1 1 1 1 1 1 1 1 1 4 4 1 1 0 01 1 1 1 5 5 1 1 7 7 1 1 4 4 1 1 4 4 1 1 7 7 1 1 5 5 1 1 1 1 0 01 1 1 1 5 5 1 1 7 7 1 1 4 4 1 1 4 4 1 1 7 7 1 1 5 5 1 1 1 1 0 01 1 4 4 1 1 2 2 1 1 1 1 1 1 1 1 1 1 1 1 1 1 2 2 1 1 4 4 1 1 0 01 1 4 4 1 1 2 2 1 1 1 1 1 1 1 1 1 1 1 1 1 1 2 2 1 1 4 4 1 1 0 01 1 1 1 4 4 1 1 7 7 1 1 7 7 1 1 7 7 1 1 7 7 1 1 4 4 1 1 1 1 0 01 1 1 1 4 4 1 1 7 7 1 1 7 7 1 1 7 7 1 1 7 7 1 1 4 4 1 1 1 1 0 0 0 0 1 1 1 1 2 2 1 1 2 2 1 1 1 1 1 1 2 2 1 1 2 2 1 1 1 10 0 0 0 0 1 1 1 1 2 2 1 1 2 2 1 1 1 1 1 1 2 2 1 1 2 2 1 1 1 10 0 0 0 0 1 1 1 1 4 4 1 1 5 5 1 1 5 5 1 1 4 4 1 1 1 1 0 0 0 0 0 0 1 1 1 1 4 4 1 1 5 5 1 1 5 5 1 1 4 4 1 1 1 1 0 0 0 0 0 0 1 1 1 1 4 4 1 1 4 4 1 1 4 4 1 1 1 10 0 0 0 01 1 1 1 4 4 1 1 4 4 1 1 4 4 1 1 1 10 0 0 0 0 01 1 1 1 1 1 1 1 1 1 1 1 1 1 0 0 0 0 0 01 1 1 1 1 1 1 1 1 1 1 1 1 1 0 0 0 0 0 0 0 0 0 0 0 0 0 0 0 0 0 0 0 0 0 0 0 0 0 0 0 0 0 0 0 0 0 0 0 01 1 1 1 1 1 1 1 1 1 1 1 1 1 0 0 0 0 0 01 1 1 1 1 1 1 1 1 1 1 1 1 1 0 0 0 0 0 01 1 1 1 3 3 1 1 3 3 1 1 3 3 1 1 1 10 0 0 0 0 1 1 1 1 3 3 1 1 3 3 1 1 3 3 1 1 1 10 0 0 0 0 0 1 1 1 1 3 3 1 1 4 4 1 1 4 4 1 1 3 3 1 1 1 1 0 0 0 0 0 0 1 1 1 1 3 3 1 1 4 4 1 1 4 4 1 1 3 3 1 1 1 1 0 0 0 0 01 1 1 1 2 2 1 1 2 2 1 1 1 1 1 1 2 2 1 1 2 2 1 1 1 1 0 0 0 0 0 1 1 1 1 2 2 1 1 2 2 1 1 1 1 1 1 2 2 1 1 2 2 1 1 1 1 0 0 0 0 1 1 1 1 3 3 1 1 8 8 1 1 5 5 1 1 5 5 1 1 8 8 1 1 3 3 1 1 1 1 0 0 1 1 1 1 3 3 1 1 8 8 1 1 5 5 1 1 5 5 1 1 8 8 1 1 3 3 1 1 1 1 0 0 1 1 3 3 1 1 2 2 1 1 1 1 1 1 1 1 1 1 1 1 1 1 2 2 1 1 3 3 1 1 0 0 1 1 3 3 1 1 2 2 1 1 1 1 1 1 1 1 1 1 1 1 1 1 2 2 1 1 3 3 1 1 0 0 1 1 1 1 4 4 1 1 5 5 1 1 3 3 1 1 3 3 1 1 5 5 1 1 4 4 1 1 1 1 0 0 1 1 1 1 4 4 1 1 5 5 1 1 3 3 1 1 3 3 1 1 5 5 1 1 4 4 1 1 1 1 0 0 1 1 3 3 1 1 1 1 1 1 1 1 1 1 1 1 1 1 1 1 1 1 1 1 1 1 3 3 1 1 0 0 1 1 3 3 1 1 1 1 1 1 1 1 1 1 1 1 1 1 1 1 1 1 1 1 1 1 3 3 1 1 0 0 1 1 1 1 4 4 1 1 5 5 1 1 3 3 1 1 3 3 1 1 5 5 1 1 4 4 1 1 1 1 0 0 1 1 1 1 4 4 1 1 5 5 1 1 3 3 1 1 3 3 1 1 5 5 1 1 4 4 1 1 1 1 0 0 1 1 3 3 1 1 2 2 1 1 1 1 1 1 1 1 1 1 1 1 1 1 2 2 1 1 3 3 1 1 0 0 1 1 3 3 1 1 2 2 1 1 1 1 1 1 1 1 1 1 1 1 1 1 2 2 1 1 3 3 1 1 0 0 1 1 1 1 3 3 1 1 8 8 1 1 5 5 1 1 5 5 1 1 8 8 1 1 3 3 1 1 1 1 0 0 1 1 1 1 3 3 1 1 8 8 1 1 5 5 1 1 5 5 1 1 8 8 1 1 3 3 1 1 1 1 0 0 0 0 1 1 1 1 2 2 1 1 2 2 1 1 1 1 1 1 2 2 1 1 2 2 1 1 1 1 0 0 0 0 01 1 1 1 2 2 1 1 2 2 1 1 1 1 1 1 2 2 1 1 2 2 1 1 1 1 0 0 0 0 0 1 1 1 1 3 3 1 1 4 4 1 1 4 4 1 1 3 3 1 1 1 1 0 0 0 0 0 0 1 1 1 1 3 3 1 1 4 4 1 1 4 4 1 1 3 3 1 1 1 1 0 0 0 0 0 0 1 1 1 1 3 3 1 1 3 3 1 1 3 3 1 1 1 10 0 0 0 01 1 1 1 3 3 1 1 3 3 1 1 3 3 1 1 1 10 0 0 0 0 01 1 1 1 1 1 1 1 1 1 1 1 1 1 0 0 0 0 0 01 1 1 1 1 1 1 1 1 1 1 1 1 1 0 0 0 0 0 0 0 0 0 0 0 0 0 0 0 0 0 0 0 0 0 0 0 0 0 0 0 0 0 0 0 0 0 0 0 01 1 1 1 1 1 1 1 1 1 1 1 1 1 0 0 0 0 0 01 1 1 1 1 1 1 1 1 1 1 1 1 1 0 0 0 0 0 01 1 1 1 2 2 1 1 2 2 1 1 2 2 1 1 1 10 0 0 0 0 1 1 1 1 2 2 1 1 2 2 1 1 2 2 1 1 1 10 0 0 0 0 0 1 1 1 1 2 2 1 1 3 3 1 1 3 3 1 1 2 2 1 1 1 10 0 0 0 0 0 1 1 1 1 2 2 1 1 3 3 1 1 3 3 1 1 2 2 1 1 1 10 0 0 0 01 1 1 1 1 1 1 1 1 1 1 1 1 1 1 1 1 1 1 1 1 1 1 1 1 1 0 0 0 0 0 1 1 1 1 1 1 1 1 1 1 1 1 1 1 1 1 1 1 1 1 1 1 1 1 1 1 0 0 0 0 1 1 1 1 2 2 1 1 8 8 1 1 4 4 1 1 4 4 1 1 8 8 1 1 2 2 1 1 1 1 0 0 1 1 1 1 2 2 1 1 8 8 1 1 4 4 1 1 4 4 1 1 8 8 1 1 2 2 1 1 1 1 0 0 1 1 2 2 1 1 1 1 1 1 1 1 1 1 1 1 1 1 1 1 1 1 1 1 1 1 2 2 1 1 0 0 1 1 2 2 1 1 1 1 1 1 1 1 1 1 1 1 1 1 1 1 1 1 1 1 1 1 2 2 1 1 0 0 1 1 1 1 3 3 1 1 4 4 1 1 2 2 1 1 2 2 1 1 4 4 1 1 3 3 1 1 1 1 0 0 1 1 1 1 3 3 1 1 4 4 1 1 2 2 1 1 2 2 1 1 4 4 1 1 3 3 1 1 1 1 0 0 1 1 2 2 1 1 1 1 1 1 1 1 1 1 1 1 1 1 1 1 1 1 1 1 1 1 2 2 1 1 0 0 1 1 2 2 1 1 1 1 1 1 1 1 1 1 1 1 1 1 1 1 1 1 1 1 1 1 2 2 1 1 0 0 1 1 1 1 3 3 1 1 4 4 1 1 2 2 1 1 2 2 1 1 4 4 1 1 3 3 1 1 1 1 0 0 1 1 1 1 3 3 1 1 4 4 1 1 2 2 1 1 2 2 1 1 4 4 1 1 3 3 1 1 1 1 0 0 1 1 2 2 1 1 1 1 1 1 1 1 1 1 1 1 1 1 1 1 1 1 1 1 1 1 2 2 1 1 0 0 1 1 2 2 1 1 1 1 1 1 1 1 1 1 1 1 1 1 1 1 1 1 1 1 1 1 2 2 1 1 0 0 1 1 1 1 2 2 1 1 8 8 1 1 4 4 1 1 4 4 1 1 8 8 1 1 2 2 1 1 1 1 0 0 1 1 1 1 2 2 1 1 8 8 1 1 4 4 1 1 4 4 1 1 8 8 1 1 2 2 1 1 1 1 0 0 0 0 1 1 1 1 1 1 1 1 1 1 1 1 1 1 1 1 1 1 1 1 1 1 1 1 1 1 0 0 0 0 01 1 1 1 1 1 1 1 1 1 1 1 1 1 1 1 1 1 1 1 1 1 1 1 1 1 0 0 0 0 0 1 1 1 1 2 2 1 1 3 3 1 1 3 3 1 1 2 2 1 1 1 10 0 0 0 0 0 1 1 1 1 2 2 1 1 3 3 1 1 3 3 1 1 2 2 1 1 1 10 0 0 0 0 0 1 1 1 1 2 2 1 1 2 2 1 1 2 2 1 1 1 10 0 0 0 01 1 1 1 2 2 1 1 2 2 1 1 2 2 1 1 1 10 0 0 0 0 01 1 1 1 1 1 1 1 1 1 1 1 1 1 0 0 0 0 0 01 1 1 1 1 1 1 1 1 1 1 1 1 1 0 0 0 0 0 0 0 0 0 0 0 0 0 0 0 0 0 0 0 0 0 0 0 0 0 0 0 0 0 0 0 0 0 0 0 01 1 1 1 1 1 1 1 1 1 1 1 1 1 0 0 0 0 0 01 1 1 1 1 1 1 1 1 1 1 1 1 1 0 0 0 0 0 01 1 1 1 1 1 1 1 1 1 1 1 1 1 1 1 1 1 0 0 0 0 0 1 1 1 1 1 1 1 1 1 1 1 1 1 1 1 1 1 1 0 0 0 0 0 0 1 1 1 1 1 1 1 1 2 2 1 1 2 2 1 1 1 1 1 1 1 10 0 0 0 0 0 1 1 1 1 1 1 1 1 2 2 1 1 2 2 1 1 1 1 1 1 1 10 0 0 0 0 1 1 1 1 1 1 1 1 1 1 1 1 1 1 1 1 1 1 1 1 1 1 1 1 1 10 0 0 0 0 1 1 1 1 1 1 1 1 1 1 1 1 1 1 1 1 1 1 1 1 1 1 1 1 1 10 0 0 0 1 1 1 1 1 1 1 1 9 9 1 1 3 3 1 1 3 3 1 1 9 9 1 1 1 1 1 1 1 10 0 1 1 1 1 1 1 1 19 9 1 1 3 3 1 1 3 3 1 1 9 9 1 1 1 1 1 1 1 1 0 0 1 1 1 1 1 1 1 1 1 1 1 1 1 1 1 1 1 1 1 1 1 1 1 1 1 1 1 1 1 1 0 0 1 1 1 1 1 1 1 1 1 1 1 1 1 1 1 1 1 1 1 1 1 1 1 1 1 1 1 1 1 1 0 0 1 1 1 1 2 2 1 1 3 3 1 1 1 1 1 1 1 1 1 1 3 3 1 1 2 2 1 1 1 1 0 0 1 1 1 1 2 2 1 1 3 3 1 1 1 1 1 1 1 1 1 1 3 3 1 1 2 2 1 1 1 1 0 0 1 1 1 1 1 1 1 1 1 1 1 1 1 1 1 1 1 1 1 1 1 1 1 1 1 1 1 1 1 1 0 0 1 1 1 1 1 1 1 1 1 1 1 1 1 1 1 1 1 1 1 1 1 1 1 1 1 1 1 1 1 1 0 0 1 1 1 1 2 2 1 1 3 3 1 1 1 1 1 1 1 1 1 1 3 3 1 1 2 2 1 1 1 1 0 0 1 1 1 1 2 2 1 1 3 3 1 1 1 1 1 1 1 1 1 1 3 3 1 1 2 2 1 1 1 1 0 0 1 1 1 1 1 1 1 1 1 1 1 1 1 1 1 1 1 1 1 1 1 1 1 1 1 1 1 1 1 1 0 0 1 1 1 1 1 1 1 1 1 1 1 1 1 1 1 1 1 1 1 1 1 1 1 1 1 1 1 1 1 1 0 0 1 1 1 1 1 1 1 1 9 9 1 1 3 3 1 1 3 3 1 1 9 9 1 1 1 1 1 1 1 10 0 1 1 1 1 1 1 1 1 9 9 1 1 3 3 1 1 3 3 1 1 9 9 1 1 1 1 1 1 1 10 0 0 0 1 1 1 1 1 1 1 1 1 1 1 1 1 1 1 1 1 1 1 1 1 1 1 1 1 10 0 0 0 0 1 1 1 1 1 1 1 1 1 1 1 1 1 1 1 1 1 1 1 1 1 1 1 1 1 10 0 0 0 0 1 1 1 1 1 1 1 1 2 2 1 1 2 2 1 1 1 1 1 1 1 10 0 0 0 0 0 1 1 1 1 1 1 1 1 2 2 1 1 2 2 1 1 1 1 1 1 1 10 0 0 0 0 0 1 1 1 1 1 1 1 1 1 1 1 1 1 1 1 1 1 1 0 0 0 0 01 1 1 1 1 1 1 1 1 1 1 1 1 1 1 1 1 1 0 0 0 0 0 01 1 1 1 1 1 1 1 1 1 1 1 1 1 0 0 0 0 0 01 1 1 1 1 1 1 1 1 1 1 1 1 1 0 0 0 0 0 0 0 0 0 0 0 0 0 0 0 0 0 0 0 0 0 0 0 0 0 0 0 0 0 0 0 0 0 0 0 01 1 1 1 1 1 1 1 1 1 1 1 1 10 0 0 0 0 0 1 1 1 1 1 1 1 1 1 1 1 1 1 10 0 0 0 0 0 1 1 1 1 1 1 1 1 1 1 1 1 1 1 1 1 1 1 0 0 0 0 0 1 1 1 1 1 1 1 1 1 1 1 1 1 1 1 1 1 1 0 0 0 0 0 0 1 1 1 1 1 1 1 1 1 1 1 1 1 1 1 1 1 1 1 1 1 1 0 0 0 0 0 0 1 1 1 1 1 1 1 1 1 1 1 1 1 1 1 1 1 1 1 1 1 1 0 0 0 0 01 1 1 1 1 1 1 1 1 1 1 1 1 1 1 1 1 1 1 1 1 1 1 1 1 10 0 0 0 01 1 1 1 1 1 1 1 1 1 1 1 1 1 1 1 1 1 1 1 1 1 1 1 1 10 0 0 0 1 1 1 1 1 1 1 1 9 9 1 1 2 2 1 1 2 2 1 1 9 9 1 1 1 1 1 1 1 1 0 0 1 1 1 1 1 1 1 19 9 1 1 2 2 1 1 2 2 1 1 9 9 1 1 1 1 1 1 1 1 0 0 1 1 1 1 1 1 1 1 1 1 1 1 1 1 1 1 1 1 1 1 1 1 1 1 1 1 1 1 1 1 0 0 1 1 1 1 1 1 1 1 1 1 1 1 1 1 1 1 1 1 1 1 1 1 1 1 1 1 1 1 1 1 0 0 1 1 1 1 1 1 1 1 2 2 1 1 1 1 1 1 1 1 1 1 2 2 1 1 1 1 1 1 1 1 0 0 1 1 1 1 1 1 1 1 2 2 1 1 1 1 1 1 1 1 1 1 2 2 1 1 1 1 1 1 1 1 0 0 1 1 1 1 1 1 1 1 1 1 1 1 1 1 1 1 1 1 1 1 1 1 1 1 1 1 1 1 1 1 0 0 1 1 1 1 1 1 1 1 1 1 1 1 1 1 1 1 1 1 1 1 1 1 1 1 1 1 1 1 1 1 0 0 1 1 1 1 1 1 1 1 2 2 1 1 1 1 1 1 1 1 1 1 2 2 1 1 1 1 1 1 1 1 0 0 1 1 1 1 1 1 1 1 2 2 1 1 1 1 1 1 1 1 1 1 2 2 1 1 1 1 1 1 1 1 0 0 1 1 1 1 1 1 1 1 1 1 1 1 1 1 1 1 1 1 1 1 1 1 1 1 1 1 1 1 1 1 0 0 1 1 1 1 1 1 1 1 1 1 1 1 1 1 1 1 1 1 1 1 1 1 1 1 1 1 1 1 1 1 0 0 1 1 1 1 1 1 1 1 9 9 1 1 2 2 1 1 2 2 1 1 9 9 1 1 1 1 1 1 1 1 0 0 1 1 1 1 1 1 1 1 9 9 1 1 2 2 1 1 2 2 1 1 9 9 1 1 1 1 1 1 1 1 0 0 0 01 1 1 1 1 1 1 1 1 1 1 1 1 1 1 1 1 1 1 1 1 1 1 1 1 10 0 0 0 01 1 1 1 1 1 1 1 1 1 1 1 1 1 1 1 1 1 1 1 1 1 1 1 1 10 0 0 0 0 1 1 1 1 1 1 1 1 1 1 1 1 1 1 1 1 1 1 1 1 1 1 0 0 0 0 0 0 1 1 1 1 1 1 1 1 1 1 1 1 1 1 1 1 1 1 1 1 1 1 0 0 0 0 0 0 1 1 1 1 1 1 1 1 1 1 1 1 1 1 1 1 1 1 0 0 0 0 0 1 1 1 1 1 1 1 1 1 1 1 1 1 1 1 1 1 1 0 0 0 0 0 0 1 1 1 1 1 1 1 1 1 1 1 1 1 10 0 0 0 0 01 1 1 1 1 1 1 1 1 1 1 1 1 10 0 0 0 0 0 0 0 0 0 0 0 0 0 0 0 0 0
0 0 0 0 0 0 0 0 0 0 0 0 0 0 0 0 0 01 1 1 1 1 1 1 1 1 1 1 1 1 10 0 0 0 0 0 1 1 1 1 1 1 1 1 1 1 1 1 1 10 0 0 0 0 0 1 1 1 1 1 1 1 1 1 1 1 1 1 1 1 1 1 10 0 0 0 0 1 1 1 1 1 1 1 1 1 1 1 1 1 1 1 1 1 10 0 0 0 0 01 1 1 1 1 1 1 1 1 1 1 1 1 1 1 1 1 1 1 1 1 1 0 0 0 0 0 01 1 1 1 1 1 1 1 1 1 1 1 1 1 1 1 1 1 1 1 1 1 0 0 0 0 0 1 1 1 1 1 1 1 1 1 1 1 1 1 1 1 1 1 1 1 1 1 1 1 1 1 10 0 0 0 0 1 1 1 1 1 1 1 1 1 1 1 1 1 1 1 1 1 1 1 1 1 1 1 1 1 10 0 0 0 1 1 1 1 1 1 1 19 9 1 1 1 1 1 1 1 1 1 1 9 9 1 1 1 1 1 1 1 10 0 1 1 1 1 1 1 1 19 9 1 1 1 1 1 1 1 1 1 1 9 9 1 1 1 1 1 1 1 10 0 1 1 1 1 1 1 1 1 1 1 1 1 1 1 1 1 1 1 1 1 1 1 1 1 1 1 1 1 1 10 0 1 1 1 1 1 1 1 1 1 1 1 1 1 1 1 1 1 1 1 1 1 1 1 1 1 1 1 1 1 10 0 1 1 1 1 1 1 1 1 1 1 1 1 1 1 1 1 1 1 1 1 1 1 1 1 1 1 1 1 1 10 0 1 1 1 1 1 1 1 1 1 1 1 1 1 1 1 1 1 1 1 1 1 1 1 1 1 1 1 1 1 10 0 1 1 1 1 1 1 1 1 1 1 1 1 1 1 1 1 1 1 1 1 1 1 1 1 1 1 1 1 1 10 0 1 1 1 1 1 1 1 1 1 1 1 1 1 1 1 1 1 1 1 1 1 1 1 1 1 1 1 1 1 10 0 1 1 1 1 1 1 1 1 1 1 1 1 1 1 1 1 1 1 1 1 1 1 1 1 1 1 1 1 1 10 0 1 1 1 1 1 1 1 1 1 1 1 1 1 1 1 1 1 1 1 1 1 1 1 1 1 1 1 1 1 10 0 1 1 1 1 1 1 1 1 1 1 1 1 1 1 1 1 1 1 1 1 1 1 1 1 1 1 1 1 1 10 0 1 1 1 1 1 1 1 1 1 1 1 1 1 1 1 1 1 1 1 1 1 1 1 1 1 1 1 1 1 10 0 1 1 1 1 1 1 1 19 9 1 1 1 1 1 1 1 1 1 1 9 9 1 1 1 1 1 1 1 10 0 1 1 1 1 1 1 1 19 9 1 1 1 1 1 1 1 1 1 1 9 9 1 1 1 1 1 1 1 10 0 0 0 1 1 1 1 1 1 1 1 1 1 1 1 1 1 1 1 1 1 1 1 1 1 1 1 1 10 0 0 0 0 1 1 1 1 1 1 1 1 1 1 1 1 1 1 1 1 1 1 1 1 1 1 1 1 1 10 0 0 0 01 1 1 1 1 1 1 1 1 1 1 1 1 1 1 1 1 1 1 1 1 1 0 0 0 0 0 01 1 1 1 1 1 1 1 1 1 1 1 1 1 1 1 1 1 1 1 1 1 0 0 0 0 0 0 1 1 1 1 1 1 1 1 1 1 1 1 1 1 1 1 1 10 0 0 0 0 1 1 1 1 1 1 1 1 1 1 1 1 1 1 1 1 1 10 0 0 0 0 0 1 1 1 1 1 1 1 1 1 1 1 1 1 10 0 0 0 0 01 1 1 1 1 1 1 1 1 1 1 1 1 10 0 0 0 0 0 0 0 0 0 0 0 0 0 0 0 0 0
0 Zona del reflector
1 480 out 2 420 3 400 4 360 5 320 6 300 7 300 8 240 9 120 Figure 0.8:Control rods movement
The reactor is then disturbed about 250 s after the beginning of the transient with the same steam line pressure perturbation applied in the Case A (see section 5.2.2).
5.3 DATA AVAILABILITY
Not all the information necessary to perform the analyses carried out were available from the reactor plant, so the missing thermalhydraulic and neutronic data were taken from the PB2 Turbine Trip (TT2) Benchmark [16] assuming that the state of the reactor in the Low Flow Stability Tests was about the same. Consequently, it use was made of the cross-sections, and the Xenon and Samarium distributions provided in that Benchmark.
This choice is justified because only 10 days separate the two cycles of tests.
5.4 THERMALHYDRAULIC MODELLING
In order to simulate the Low Flow Stability Test Point 3, two models of the Peach Bottom vessel components and coolant loop were set up for the system code RELAP5/Mod3.3.
The only difference between these models concerns the core nodalization, which is made by a different number of T/H channels: respectively
by a single channel (see figure 5.9) and by 33 T/H channels (represented in figure 5.10).
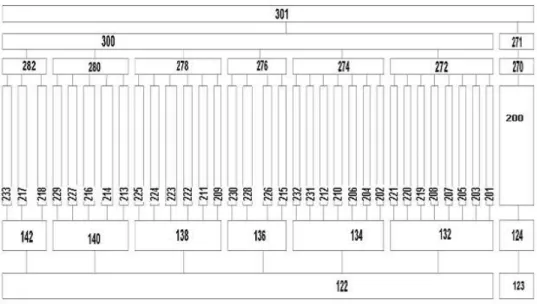
Figure 5.11 shows the entire RELAP5 nodalization adopted that provided the core model with 33 channels (the shaded area in the figure represents the reflector zones).
Figure 5.9: a) RELAP5 nodalization for the core modelled by a single T/H channel; b) correspondence between core thermal hydraulic model (1 channel) and 3-D neutron kinetics
Figure 5.11: RELAP5 nodalization of Peach Bottom-2
The correspondence between the plant component and their relative node number for the core modeling by 33 T/H channels and a single channel are provided in table 5-3 and in table 5-4
Table 5-3: Main characteristics of the nodalization for the RELAP5 input deck with 33 channels
PLANT COMPONENT NODE TYPE NODE NUMBER
Lower plenum Pipe Branch Pipe Branch 100 105 115 120
Lower plenum core inlet Branch 122
Lower plenum core bypass
inlet Branch 123
Core inlet Branches 132, 134, 136, 138, 140, 142
Internal bundle Pipe 201-233
Core bypass inlet Branch 124
Core bypass Pipe 234
Core bypass outlet Branch 270
Core outlet Branches 272, 274, 276, 278, 280, 282 Upper plenum core bypass
outlet Branch 271
Upper plenum core bypass
outlet Branch 300
Upper plenum Branch 301
Stand pipes Pipe 302
Separators Branch 310
Steam dome Branch Pipe
Pipe
312 314 316
Upper downcomer Annulus 324
Middle downcomer Annulus Branch 326 332
Lower downcomer Branch Annulus Branch Annulus Branch Annulus 334 336 338 340 360 368 Steam line Pipe Branch Pipe Branch Pipe Branch Pipe 380 382 384 386 388 390 392
Steam bypass chest Pipe 394
Steam bypass line Pipe 396
Steam bypass orifice Branch 398
Recirculation suction Pipe 400-450
Recirculation discharge Pipe 420-470
Pump Pump 410-460
Jet pump
• Throat
• Discharge Jetmixter Pipe 425-475 430-480 Turbine stop valve TSV Valve (motor valve) 10
Bypass valve BPV Valve (motor valve) 11
Feedwater Time. Dep. Vol. (Tmpdvol) 500
Turbine Time. Dep. Vol. (Tmpdvol) 675
Table 5-4: Main characteristics of the nodalization for the RELAP5 input deck with 1 channel
PLANT COMPONENT NODE TYPE NODE NUMBER
Lower plenum Branch Pipe
Pipe
100 105 115
Core inlet Branch 200
Core Pipe 223
Core bypass Pipe 230
Upper plenum Branch 300
Stand pipes Pipe 302
Separators Branch 310
Steam dome Branch Pipe
Pipe
312 314 316
Upper downcomer Annulus 324
Middle downcomer Annulus Branch 326 332
Lower downcomer Branch Annulus Branch Annulus Branch Annulus 334 336 338 340 360 368 Steam line Pipe Branch Pipe Branch Pipe Branch Pipe 380 382 384 386 388 390 392
Steam bypass chest Pipe 394
Steam bypass line Pipe 396
Steam bypass orifice Branch 398
Recirculation suction Pipe 400-450
Recirculation discharge Pipe 420-470
Pump Pump 410-460
Jet pump
• Throat
• Discharge Jetmixter Pipe 425-475 430-480 Turbine stop valve TSV Valve (motor valve) 10
Bypass valve BPV Valve (motor valve) 11
Feedwater Time. Dep. Vol. (Tmpdvol) 500
Turbine Time. Dep. Vol. (Tmpdvol) 675
Condenser Time. Dep. Vol. (Tmpdvol) 700
5.4.1 Recirculation loop
The recirculation system is responsible for maintaining the circulation of the coolant inside the reactor core. As previously mentioned, there are two recirculation loops; each pump drives 10 jet pumps. The main component of this system as well as its geometrical data is summarized in table 5-5 and table 5-6.
Table 5-5: Recirculation system geometrical data
ITEM LENGTH, m FLOW AREA, m2 EQUIVALENT
DIAMETER, m Recirculation Suction 1 19.54 0.339 0.657 Recirculation Suction 2 19.54 0.339 0.657 Pump 1 4.15 0.339 0.657 Pump 2 4.15 0.339 0.657 Discharge 1 32.92 0.264 0.16 Discharge 2 32.92 0.264 0.16
Table 5-6: Jet pump geometrical data
ITEM LENGTH, m FLOW AREA, m2 EQUIVALENT
DIAMETER, m Primary Tube Throat, cell 1 2.5766 0.0704-0.00354 0.2286-0.21224 Diffuser, cell 2 0.3053 0.0354-0.0505 0.21224-0.2535 Diffuser, cell 3 1.8865 0.0505-0.183 0.2535-0.4826 Discharge, cell 4 0.2432 0.183 0.4826 Side Tube
Drive line, cell 6 0.39675 0.0304 0.19685
Nozzle cell, cell 5 0.41893 0.0304-0.00525 0.19685-0.081788 A simplified sketch of the recirculation system and the jet pump model are shown in figure 5.12 and figure 5.13, respectively.
Figure 5.13:Jet pump schematization
The adopted model consists of lumping the twenty jet pumps into two equivalent ones. The jet pump model is made up of a side tube with two cells, the driveline and the nozzle suction, and a primary tube divided into four cells (Throat, Diffuser, and Discharge). Actual pump data are used to input pump performance parameters in the normal operating quadrants based on built-in curves for a pump of similar specific speed. Rated values for pump flow, head, and torque are based on actual pump data, as is the pump moment of inertia.
5.4.2 Steam line
In the Peach Bottom-2 reactor there are four main steam lines. They connect the upper part of the reactor vessel (and route steam generated in the core) to the turbine. Along the steam line there are 11 Safety Relief Valves (SRV). They open automatically when the pressure rises above a certain prescribed limit of about 7.7MPa.
A bypass system is connected upstream to the main steam line. The downstream of the steam bypass system is connected to the condenser. In this work the four real steam lines are lumped into one (as well as the safety relief valves), as shown in a simplified sketch (figure 5.14). The main steam line related reference data are reported in table 5-7.
Figure 5.14: Simplified sketch of the steam line Table 5-7: Steam line and bypass system geometrical data
ITEM LENGTH, m FLOW AREA, m2 EQUIVALENT
DIAMETER, m Steam line 1 1.80 1.133 0.6 Steam line 2 19.8 1.133 0.6 Steam line 3 31.5 1.133 0.6 Steam line 4 4.36 1.133 0.6 Steam line 5 46.4 1.133 0.6 Steam line 6 0.22 1.133 0.6 Steam line 7 29.1 1.133 0.6 Steam bypass 8 6.9 0.2767 0.403
Steam bypass Valve - 0.0613 -
Steam bypass 9 51.7 0.2650 0.194
5.4.3 Feedwater line
The feedwater lines are not modelled as fluid volumes. Instead, a fill junction is used to specify the feedwater mass flow as a boundary condition.
5.4.4 Reactor vessel
The Peach Bottom-2 vessel and its components are shown in figure 3.1. The adopted dimension and other geometric data are listed in table 5-8
Table 5-8: Reactor vessel geometrical data
ITEM LENGTH, m FLOW AREA, m2 EQUIVALENT
DIAMETER, m Lower plenum 5.267 11.102 0.2411 Core inlet 0.3646 8.2405 0.1135 Core bypass 4.2636 6.4155 0.052 Active core 3.6576 7.80 0.0136 Core exit 0.516 7.80 0.0136
Upper core plenum 1.524 17.709 4.7484
Standpipes 2.718 3.9328 0.15405 Steam separators 2.266 8.5164 0.2267 Steam dome 6.8024 26.1946 5.7751 Upper downcomer 2.8574 19.026 0.3326 Middle downcomer 2.1980 22.176 0.6433 Lower downcomer 7.4216 8.551 0.8508
The balance of plant was substituted by boundary conditions obtained utilizing a combination of calculated results and test data in order to reproduce the actual steady state conditions for the Low Flow Stability Test Point3. The boundary conditions chosen for the RELAP5 model are: feedwater pressure and temperature, turbine pressure and temperature, feedwater mass flowrate.
The total fuel power for Low Flow Stability Test Point 3 conditions was 59.2% of rated power or 1949.456 MWt. Assuming the heating distribution provided in the TT2 benchmark, the direct moderator heating induced by neutron slowing down and gamma absorption processes was distributed by the following fractions: 2.0 % for the in-channel moderator region and 1.7% for the bypass moderator region. As a consequence the power distribution at steady state is respectively 1877.326 MWt for the core heated region (fuel), 38.99 MWt for in-channel direct heating and 33.14 MWt for bypass direct heating.
5.4.5 Adopted core nodalizations
As above mentioned, two different nodalizations were realized to model the core: respectively with 1 and 33 T/H channels, in order to investigate the effect of the different number of T/H channels on the results.
The single channel nodalization (see figure 5.9) were realized lumping the entire core in one T/H channel and all the bypasses in other T/H channel. The core region is divided into 24 axial active meshes.
The Turbine Trip benchmark specifications provided a core T/H mapping made of 33 T/H channels (figure 5.15) and their characteristics [2].
Figure 5.15: Identification of the 33 thermalhydraulic channels
The mapping for 33 T/H channels nodalization (see figure 5.10) was modelled according with the following criteria:
• channels composed by fuel assemblies with a 7x7 lattice were not lumped
together with those made of 8x8 lattice in order to create each of the six equivalent channels;
• even channels made of core peripheral fuel assemblies were not mixed with
channels containing core central fuel assemblies
• finally, the new 33 T/H channels were created matching channels close in
the core position.
Hence starting from the centre the channels were grouped proceeding about for radial circles towards the core boundary in order to lump channels with characteristics (above all the fuel assembly normalized power) as similar as possible.
It should be noted from figure 5.15 that in the model with 33 T/H channels, only three of them (#17, #18, #33) belonged to the peripheral assemblies.
A bypass channel in which were lumped all the bypass regions was used even with the nodalization made of 33 T/H channels and the core region is still divided into 24 axial active meshes.
The core region is modelled according to the RELAP code requirements that allow for no more than nine branches for a single volume. Hence, for each branch, channels with common characteristics were joined together basically using the same logic utilized to lump the core in channels. These characteristics were the lattice type, the channel power, the relative position of the Fuel Assembly contained in the heat structure(or belonging to the branch component) and the inlet channel flow area.
All the characteristics adopted to model the core are described in table 5-9 for the 33 channels nodalizations.
Table 5-9: Data used for modelling 33 thermalhydraulic channels Channel Number # of FA in each Channel Type of Lattice # of Fuel Rod in each Channel
Flow Area for each Channel (m2) Heat Exchange Area for each Channel (m2) Mesh Eight (m) Wetted Perimeter for each Channel (m) Hydraulic Diameter of each Channel (m) 1 12 7x7 49 0.1227 89.6112 0.1524 32.851 0.0146 2 8 8x8 63 0.08014 76.8096 0.1524 24.432 0.0131 3 36 7x7 49 0.36081 268.8336 0.1524 98.553 0.0146 4 16 8x8 63 0.16028 153.6192 0.1524 48.864 0.0131 5 4 7x7 49 0.04009 29.8704 0.1524 10.950 0.0146 6 12 8x8 63 0.12021 115.2144 0.1524 36.648 0.0131 7 44 7x7 49 0.44099 328.5744 0.1524 120.454 0.0146 8 16 7x7 49 0.16036 119.4816 0.1524 43.801 0.0146 9 4 7x7 49 0.04009 29.8704 0.1524 10.950 0.0146 10 8 8x8 63 0.08014 76.8096 0.1524 24.432 0.0131 11 40 7x7 49 0.40090 298.7040 0.1524 109.943 0.0146 12 20 8x8 63 0.20035 192.0240 0.1524 61.080 0.0131 13 76 7x7 49 0.76171 567.5376 0.1524 208.057 0.0146 14 36 7x7 49 0.36081 268.8336 0.1524 98.553 0.0146 15 36 8x8 63 0.36064 345.6432 0.1524 109.943 0.0131 16 4 7x7 49 0.04009 29.8704 0.1524 10.950 0.0146 17 52 7x7 49 0.52117 388.3152 0.1524 142.355 0.0146 18 16 7x7 49 0.16036 119.4816 0.1524 43.801 0.0146 19 12 7x7 49 0.12027 89.6112 0.1524 32.851 0.0146 20 24 7x7 49 0.24054 179.2224 0.1524 65.702 0.0146 21 12 7x7 49 0.12027 89.6112 0.1524 32.851 0.0146 22 48 7x7 49 0.48108 358.4448 0.1524 131.404 0.0146 23 4 7x7 49 0.04009 29.8704 0.1524 10.950 0.0146 24 12 7x7 49 0.12027 89.6112 0.1524 32.851 0.0146 25 4 7x7 49 0.04009 29.8704 0.1524 10.950 0.0146 26 8 8x8 63 0.08014 76.8096 0.1524 24.432 0.0131 27 56 7x7 49 0.56126 418.1856 0.1524 153.305 0.0146 28 20 8x8 63 0.20035 192.0240 0.1524 61.080 0.0131 29 40 7x7 49 0.40090 298.7040 0.1524 109.504 0.0146 30 36 8x8 63 0.36064 345.6432 0.1524 109.943 0.0131 31 12 8x8 63 0.12021 115.2144 0.1524 36.648 0.0131 32 12 8x8 63 0.12021 115.2144 0.1524 36.648 0.0131 33 24 7x7 49 0.24054 179.2224 0.1524 65.702 0.0146
All the conditions and parameters (such as loss coefficients, pressure drops, boundary conditions, etc.) were set to obtain the same steady state conditions for the Low Flow Stability Test Point 3 with the two nodalizations, with the purpose of testing the actual effect of the number of T/H channels on the results: therefore the only difference among these nodalizations is the core modeling made by a different number of T/H channels.
5.5 NEUTRONIC MODELLING
The analyses were performed with the coupled RELAP5/PARCS codes.
The PARCS v-2.4 code uses the non-linear nodal method to solve the transient two energy group diffusion equations in three-dimensional geometry. In addition six delayed neutrons groups are also modelled. Two prompt and six delayed neutron groups are modelled. The energy release per fission for the two prompt neutron groups is 0.3213 × 10⁻¹⁰ J/fission and 0.3206 × 10⁻¹⁰ J/fission, and this energy release is considered to be independent of time and space. It is assumed that 2% of fission power is released as direct gamma heating for the in-channel coolant flow and 1.7% for the bypass flow.
Different fuel assembly types are considered within the core configuration as shown in table 3-4; anyway the type 1 is not used for Low Flow Stability Test Point 3 conditions because it was not present in the core at the cycle 2 when the analyses were executed. Through the correspondence reported in table 3-6, is possible to identify the radial distribution of these assembly types shown in figure 3.4 or figure 5.16.
Figure 5.16: Radial Distribution of Assembly Types
The core includes 435 fuel compositions distributed along the 5 fuel assembly (FA) types and 1 reflector type. Axially the core is divided into 26 axial planes where the first and the last one are reflector zones. Each composition is defined by material properties and burn up which depends on the exposure, the spectral history (void fraction) and control rod history, as well as for their delayed parameters (fraction of delayed neutron and their decay constant). All these data are supplied in the form of a data bank (cross-section library) in the Turbine Trip Benchmark. A complete set of diffusion coefficients, macroscopic cross-sections for scattering, absorption, and fission, as a function of the moderator density and fuel temperature is defined for each composition. The group inverse neutron velocities are also provided for each composition. Dependence of the cross-sections on the above variables is specified through a two-dimensional look-up table. Each composition is assigned to a cross-section set containing separate tables for the diffusion coefficients and cross-sections, with each point in the table representing a possible core state. The expected
range of the transient is covered by the selection of an adequate range for the independent variables shown in table 5-10
Table 5-10: Range of variables
Fuel Temperature (K) Rho Moderator (kg/m3)
400.0 800.0 1200.0 1600.0 2000.0 2400.0 141.595 141.595 141.595 141.595 141.595 141.595 400.0 800.0 1200.0 1600.0 2000.0 2400.0 226.154 226.154 226.154 226.154 226.154 226.154 400.0 800.0 1200.0 1600.0 2000.0 2400.0 299.645 299.645 299.645 299.645 299.645 299.645 400.0 800.0 1200.0 1600.0 2000.0 2400.0 435.045 435.045 435.045 435.045 435.045 435.045 400.0 800.0 1200.0 1600.0 2000.0 2400.0 599.172 599.172 599.172 599.172 599.172 599.172 400.0 800.0 1200.0 1600.0 2000.0 2400.0 779.405 779.405 779.405 779.405 779.405 779.405
A modified linear interpolation scheme (which includes extrapolation outside the thermalhydraulic range) is used to obtain the appropriate total cross-sections from the tabulated ones based on the reactor conditions being modelled. Table 5-11 shows the definition of a cross-section table associated with a composition. Table 5-12 shows the macroscopic cross-section table structure for one cross-section set. All cross-section sets are assembled into a cross-section library.
Table 5-11: Key to macroscopic cross-section tables Where:
- Tf is the Doppler (fuel) temperature (K)
- m is the moderator density (kg/m3)
- is the macroscopic cross-section (cm-1) Table 5-12: Macroscopic cross-section table structure
Group No.1
Diffusion Coefficient Table Absorption X-Section Table Fission X-Section Table Nu-Fission X-Section Table
Scattering From Group 1 to 2 X-Section Table Assembly Disc. Factor Table – W
Assembly Disc. Factor Table – S Detector Flux Ratio Table
Detector Microscopic Fission X-Section Table
Group No.2
Diffusion Coefficient Table Absorption X-Section Table Fission X-Section Table Nu-Fission X-Section Table Xe Macroscopic X-Section Table
Xe Microscopic X-Section Table Assembly Disc. Factor Table – W Assembly Disc. Factor Table – S
Detector Flux Ratio Table
Detector Microscopic Fission X-Section Table
Group No.3
Detector Flux Ratio Table
Detector Microscopic Fission X-Section Table Effective Delayed Neutron Yield in Six Group Decay Constants for Delayed Neutron Groups
Inv. Neutron Velocities
The cross-sections are provided in separate libraries for rodded (i.e., with control rods) and unrodded (i.e., without control rods) compositions. Appropriate functions are implemented inside the PARCS code for PBTT2 cross-section values; so the code reads directly from the cross-section library format provided by the benchmark specifications. The format of each library is as follows:
• The first line of data is used to show the number of data points used for the independent thermalhydraulic parameters. The parameters used in this benchmark include fuel temperature, moderator density.
• Each cross-section set is in the order shown in table 5-11. Each table is in the
format described in table 5-12. First, the values of the independent thermalhydraulic parameters (fuel temperature and moderator density) used to
Tf1 Tf2 Tf3 Tf4 Tf5 Tf6 m1 m2 m3 m4 m5 m6
1 2 …
specify that particular set of cross-sections are listed, followed by the values of the cross-sections20. Detector parameters21 are included after the two-group cross-sections followed by the delayed neutron parameters for six groups. Finally, the group inverse neutron velocities complete the data for a given cross-section set.
• The dependence on fuel temperature in the reflector cross-section tables is also modelled. This is because the reflector cross-sections are generated by performing lattice transport theory calculations, including the next fuel region. In order to simplify the reflector feedback modeling the following assumptions are made: an average fuel temperature value equal to 550 K is used for the radial reflector cross-section modeling in both the initial steady state and transient simulations, and the average coolant density for the radial reflector is equal to the inlet coolant density. For the axial reflector regions the following assumptions are made: for the bottom – the fuel temperature is equal to the inlet coolant temperature (per thermalhydraulic channel or cell) and the coolant density is equal to the inlet coolant density (again per channel); for the top – the fuel temperature is equal to the outlet coolant temperature (per channel) and the coolant density is equal to the outlet coolant density (per channel).
In all the calculations the decay power was take into account: the model used in PARCS includes six groups of decay heat precursor groups.
Three reflectors were modelled into the neutronics PARCS model: a reflector at the bottom plane, a reflector at the top plane and a radial reflector surrounding the core; anyway, the reflector data are all related to the single reflector assembly provided in the benchmark specifications.
5.5.1 BWR LPRM response model
There are a total of 43 instrument tubes with radial location according to figure 3.6. Within each instrument tube, the LPRM’s are located at 4 axial levels: Level A, Level B, Level C, and Level D; the axial location of the above levels is
20 Please note that the provided absorption section already take the Xenon thermal
cross-section into account; however the thermal macro and micro Xenon cross-cross-section are listed in the cross-section sets.
shown in figure 3.7. There were a total of 80 monitored points (20 per each axial level) during the transient. Therefore, comparisons can be performed between local experimental measured fluxes and code predictions as the average of each axial Level (A, B, C, and D).
For the purpose of comparing the three-dimensional (3-D) power distribution provided experimentally by local power range monitor (LPRM) measurements during the analyses, the following LPRM response model could be implemented in the 3-D neutronics code:
= Φ Φ = 2 1 det * ) , , ( * ) , , ( ) , , ( g ector g bundle g global g LPRM x y z x y z x y z R
σ
(5.1) where: global gΦ (x,y,z) is the homogeneous flux from the 3-D kinetics global solution
extrapolated at the detector location at the detector location. It could be obtained from the global core neutronics calculation by extrapolating the flux function to the detector location based on the specific code solution method;
bundle g
Φ (x,y,z) is the single assembly detector factor which is the ratio between the
flux in the detector location and the average flux of the neutronic cell (from lattice CASMO calculation): lattice avg g lattice ector bundle g z y x z y x, , ) det , , ( , , ) ( Φ Φ = Φ (5.2) ector gdet
σ
is the microscopic fission cross-section for fissile material of the fissionchamber.
5.6 3-D NEUTRONIC/THERMALHYDRAULIC
COUPLING
To couple RELAP5 and PARCS it is necessary to design a map (called Maptab, see section 4.3.2) that creates the association among T/H nodes (stated in RELAP5 model) and neutronic nodes (stated in PARCS model): this is a critical step for the coupling process because different associations can be generated. The association must be done both for the volume components and for the heat structure components. For this work two different Maptab sets were realized to be consistent with the two T/H RELAP5 nodalizations made of 1 and 33 channels. Special care was taken in the association of the neutronic reflector zones with T/H nodes: both the bottom and the upper reflectors were associated to inert structures (and to the corresponding volumes) present in the T/H model respectively at core inlet and outlet. The radial reflector was instead matched to the bypass volume and to its inert structure (i.e. without active heat generation): this choice was justified because the entire moderator surrounding the core flows at direct contact with the reflector assemblies, so with temperature values are actually close.
The correspondence among neutronic nodes (PARCS nodalization) and thermal hydraulic nodes (RELAP nodalization) used for the case of 33 T/H channels was illustrated in figure 4.4.