FORwARD MODELLINg OF MAgNETIC ANOMALIES
IN ARChAEOLOgICAL gEOPhySICS: A NEw SOFTwARE TOOL
A. Schettino, A. Ghezzi
School of Science and Technology – Geology Division, University of Camerino, Italy
Introduction. Although magnetic methods are generall� considered among the most
important non–destructive techniques in Archaeolog�, in most cases their usage limits to the acquisiton of vertical gradient data and their direct interpretation in terms of walls or other archaeological features, often without the support of an accurate geoph�sical anal�sis. Disadvantages in the acquisition and direct archaeological interpretation of gradient data include the following issues: 1. in most cases the location of a �uried artifact is laterall� displaced with respect to the corresponding anomal�� 2. important information a�out the ph�sical properties of an o�ject, which could have archaeological meaning, is ignored� 3. information a�out the �urial depth cannot �e easil� o�tained� 4. near�� o�jects generate complex anomalies (�� the superposition principle) that cannot �e interpreted �� the simple visual inspection of gradient maps. Finall�, �a��agh (2003) showed that the reduction of anthropogenic distur�ances and time variations of the geomagnetic field using appropriate filters gives �etter results compared to gradiometer measurements.
Here we descri�e an approach to magnetic prospecting and anal�sis in Archaeolog�, which is �ased on the acquisition of total field data, their reduction to magnetic anomalies, and a computer–assisted anal�sis of the resulting data set. �ur new software tool, ArchaeoMag, allows for the first time to reconstruct the geometr� and magnetization pattern of a �uried settlement through a trial–and–error procedure �ased on classical forward modelling algorithms. It also allows to determine whether an artifact has �een �urnt and eventuall� the approximate time of this event. In the next sections, we first review a method of acquisition and processing of magnetic data from an archaeological site. �hen, we descri�e the operation of ArchaeoMag and the �asic steps in forward modelling of archaeological anomalies. Finall�, we will discuss the potentialit� of this approach in difficult situations.
Methods. In a t�pical high–resolution magnetic surve�, total field magnetic data, T(x,y),
are usuall� acquired along a set of surve� lines. In the case of moderatel� distur�ed da�s (Kp
= 4) or when the data acquisition requires several hours, it is good practice to correct the data for the dail� variations of the geomagnetic field through a levelling procedure. In this instance, it is possi�le to start with the rapid acquisition along a transverse tie line T0 that crosses the entire surve� area. �hese data can �e considered instantaneous readings at time t = 0, �ecause
T0 is generall� travelled in onl� 1–2 min in the case of archaeological surve�s. �hen, the surve� is performed normall� following the surve� lines. �his method allows to �uild a diurnal drift function starting from the crossover errors εi(t) = Ti(t) – Ti(0). In most cases, the diurnal drift
curve can �e o�tained fitting a cu�ic pol�nomial. After the standard pre–processing step, this curve is then su�tracted from the raw data to remove the diurnal variations.
�he first processing step after despiking, drop–out removal, and levelling should �e the calculation of total field values at regular grid locations through a gridding algorithm. Although the general method to o�tain magnetic anomalies ΔT(x,y) from total field data T(x,y) is simpl� that of su�tracting the reference field intensit� F(x,y) at the same location, so that ΔT(x,y) =
T(x,y) – F(x,y), this approach does not generall� provide anomalies that are representative of
archaeological features. In fact, in this instance the magnetic anomalies will �e the expression of an anomalous field ΔF(x,y) that includes two sources. A major source, which is not relevant in archaeological studies, is associated with crustal magnetization and has magnitudes of the order of tens to hundreds n�. �he signal associated with archaeological o�jects is generall� much smaller, with rms magnitudes not exceeding few tens n�. Consequentl�, in this instance the procedure to calculate magnetic anomalies from total field data is slightl� more complicate, �ecause it is often necessar� to isolate a ver� small–amplitude signal from the o�served data. In our approach, magnetic anomalies are calculated su�tracting an N degree trend surface from the total field grid value T(x,y):
(1) Eq. (1) can �e justified noting that the Earth’s magnetic field is harmonic in the region outside the Earth’s surface, there�� it has continuous derivatives. Consequentl�, in an� sufficientl� small surve� area it can �e represented �� a �a�lor’s pol�nomial series with constant coefficients.
Calculation of model anomalies. �he computer program ArchaeoMag is designed to
operate on U�M georeferenced maps of archaeological anomalies, although in can �e also used in local (surve�) coordinates. �he program assumes that the anomalies have �een determined through the correct application of Eq. (1) or a similar method of total field data reduction. In other words, it assumes that the magnetic anomal� amplitudes reflect the true magnetization of the �uried archaeological features.
In addition to specif�ing input grids, the user selects a color scale for the representation of the magnetic anomalies and some am�ient parameters, which include sensor height, the geomagnetic field parameters (F,D0,I0), and the soil volume suscepti�ilit� χ0 in �I units. Reference field declination, D0, and inclination, I0, are used to calculate model anomalies starting from anomalous field vectors, while the field intensit�, F, is used with the soil suscepti�ilit� and the suscepti�ilit� of the �uried o�jects to determine the induced component of magnetization MI. �his approach clearl� requires a preliminar� soil sampling and anal�sis through a magnetic
suscepti�ilit� meter. Finall�, the surve� area parameters (corner coordinates and map resolution) are calculated automaticall� �� the program after the specification of an input magnetic anomal� grid.
ArchaeoMag allows to define four classes of shapes, corresponding to common archaeological
features: 1. spheres (magnetic dipoles), 2. rectangular prisms, 3. generic vertical prisms, and 4. stairwa�s. For an� o�ject, the program allows to specif� the minimum and maximum �urial depths, the magnetic suscepti�ilit�, χ, a cutoff distance �e�ond which the program does not calculate anomalies (for computing time optimization), and a remnant magnetization vector
(MR,DR,IR). �he program calculates automaticall� the induced magnetization vector, MI, and the
total magnetization vector, M, �� the following equations:
(2) (3)
Methods of forward modelling. Modelling of an� specific archaeological feature �� one
of the �asic ArchaeoMag shapes should start with a guess a�out the �urial depth and with a characterization of the NRM component, which is predominant in most of the situations that can �e studied �� magnetic methods. �he �urial depth influences the lateral width of an
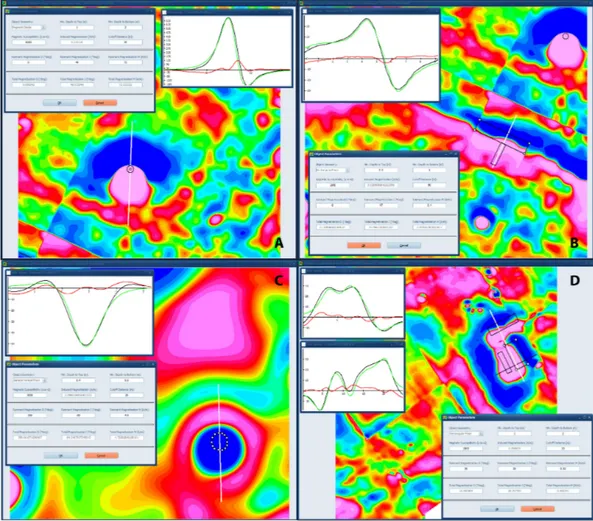
Fig. 1 - Four examples of archaeological anomalies that can onl� �e modelled �� sources with a significant component of remnant magnetization. �he magnetic profiles show o�served and model anomalies (�lack and green lines, respectivel�), and the error curve (o�served - calculated, in red) along selected traces (white lines). �he �uried o�jects arc indicated �� �lack lines and white dots. Model parameters are listed in the o�ject properties dialog �oxes. A: A strong dipole anomal� whose peak exceeds 620 n�, most pro�a�l� a furnace (Powell et al., 2002). B: A� - structure, pro�a�l� representing a com�ination of a segment of a long and 2m large WNW-E�E oriented wall and a transversal smaller wall. C: A small c�lindrical structure, 70 cm diameter �� 20 cm height, characterized �� a ver� anomalous inclination (I = –85°) of remnant magnetization. D: A composite anomal�, resulting from the superposition and coalescence of the anomalies associated with three distinct �uildings. �he upper profile refers to the �lack trace oriented W�W-ENE. �he parameters of the selected o�ject (delimited �� white dots) are listed in the dialog window. �he northernmost feature has D = 30°, I = 5°, M = 1.8 A/m, while the western prism has D = 30°, I = 60°, M = 0.3 A/m.
anomal�, which increases with the top depth z1, while the presence of a remnant magnetization component can �e easil� esta�lished �� the detection of one or more among the following features: 1. A magnetic anomal� amplitude exceeding a few n�� 2. A deviation of the strike of the simmetr� axis of a dipolar anomal� from the present da� reference field declination,
D0� 3. A deviation of the anomal� shape from the expected shape for the given reference field inclination, I0. Fig. 1 shows an example of o�served anomalies that can �e modelled �� o�jects having a remnant magnetization component.
In general, the o�servation of anomalies associated with induced magnetization requires one or more among the following conditions: 1) a strong suscepti�ilit� contrast with the surrounding soil� 2) a random arrangement of natural remnant magnetization (NRM) components (e.g., a random orientation of magnetite grain spins in a paramagnetic matrix, a random �uild–up of �ricks, etc.)� 3) a low Koenigs�erger ratio Q = MR/MI, and 4) the a�sence of near�� o�jects
with a significant NRM component. Examples of archaeological features whose anomalies are dominated �� induced magnetization contrasts are: graves, historical iron artifacts (Bevan, 2002), ditches and limestone walls. In contrast, remnant magnetization generall� produces much stronger anomalies in materials with high Koenigs�erger ratio or, more often, when the archaeological structures are fired materials (e.g., �ricks) or materials that have �een fired at a later time during historical or natural events. A forward modelling session of an� local surve� anomal� should start with the selection of an o�ject t�pe (dipole, rectangular prism, or general vertical prism) and the creation of 1–2 magnetic profiles, as illustrated in Fig. 1. At the next step, the user should inspect the magnetic profiles, in particular the error curve, in order to start an interactive trial–and–error procedure and determine a magnetization model that can explain
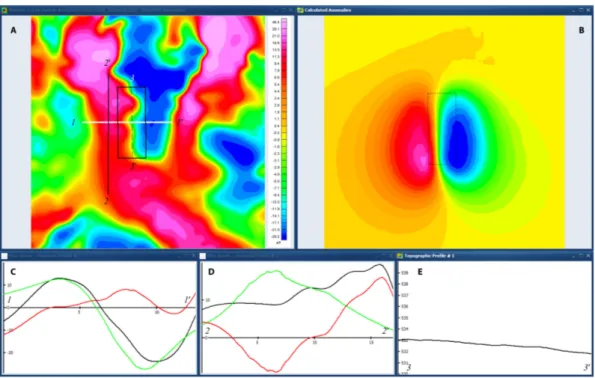
Fig. 2 - A rectangular prism model of o�served anomalies (A) along the hill slope (Antigonea archaeological park, southern Al�ania, �chettino et al., 2017). �hese data were acquired 0.5 m a�ove the terrain. �he average soil suscepti�ilit� was χ0 = 500x10-6, while the am�ient field parameters were: D
0 = 3.95°, I0 = 56.72°, F = 46336.00 n�. Panel (B) shows the model anomalies. calculated assuming χ0 = 3000x10-6, z
1 = 2 m, z2 = 3 m, and a NRM vector wih parameters D = 90°, I = –20°, MR = 0.9 A/m. Panels (C) and (D) illustrate magnetic profiles with model and o�served anomalies (green and �lack curves, respectivel�), and the error curve (in red). Finall�, Panel (E) shows a N-� topographic profile through the prism.
the o�served magnetic signal. At each iteration, the NRM parameters and eventuall� the depth and size of the o�ject are adjusted to progressivel� minimize the mismatch �etween the model and o�served anomalies along the profiles. �he final result is not necessaril� what we could find �� direct excavation, �ecause of the intrinsic am�iguit� of potential field data. However, the availa�ilit� of archaeological information can help to constrain materials and depths of the model o�jects, there�� allowing a realistic reconstruction of a �uried settlement.
Discussion. �he approach presented a�ove allows to create realistic magnetization models of
archaeological sites even in the case of complex topograph�, granted that appropriate acquisition and processing of total field data have �een performed. In ArchaeoMag, the o�served and model grid anomalies are automaticall� assigned an orthometric height according to an input digital terrain model for the surve� area. �herefore, an� o�ject in the model acquires local Cartesian coordinates depending from the �urial depth specified at the time of its definition as well as from its U�M coordinates. �hus, it is possi�le to o�tain an automatic terrain correction that accounts for the anomal� field distortion associated with topograph�. An example of application of ArchaoMag to a situation characterized �� rugged topograph� is illustrated in Fig. 2A. �hese data were acquired in 2015 along the �E slope of the Jermë hill, southern Al�ania (�chettino et
al., 2017). Apparentl�, a segment of the western �ranch of the two positive anomal� stripes could
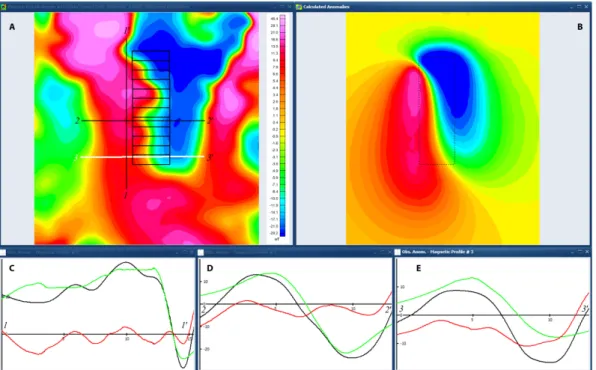
�e modelled �� a N–� oriented rectangular prism, as illustrated in Fig. 2. �his interpretation is partiall� supported �� the E–W profile shown in Fig. 2C. However, the N–� profile (Fig. 2D) shows a northward increase of the o�served anomalies, whereas the rectangular prism model predicts the opposite, according to the fact that the southern tip of this structure is closer to the surface than the northern end. As a consequence, the o�served anomalies cannot �e generated �� an o�ject having a flat upper surface. In Fig. 3 an alternative model is proposed, which is �ased on a stairwa� structure formed �� 12 rectangular prisms. In this instance, the �urial depth of each step slightl� rises downslope, accounting for the increased rate of accumulation in this direction. Undou�tedl�, this model provides a much �etter fit of the model anomalies to the o�served values in N–� direction, as shown in Fig. 3C.
As mentioned a�ove, the possi�ilit� to model NRM components in addition to induced
magnetization is an important feature of ArchaeoMag, which could �e used, in some circumstances, to estimate the age of firing events and help reconstructions of the historical development of a settlement. In fact, when firing is the onl� event responsi�le for the acquisition of NRM and it is possi�le to esta�lish that the artifact has not �een moved since that time, we can compare the model NRM declination and inclination with existing master curves of palaeosecular variations, o�taining an age for the magnetization event (e.g., Vigliotti, 2006).
Finall�, ArchaeoMag allows to export the magnetized �locks as a georeferenced text file that can �e su�sequentl� loaded in a �I� and integrated with other data sets for the stud� area. For example, it is possi�le to com�ine or compare magnetization maps with resistivit� or �PR data to �uild an integrated archaeological model. It should �e noted that the integration of magnetic anomalies with other geoph�sical data is not generall� a correct procedure, �ecause of the displacement of the o�jects with respect to the anomal� peaks. Conversel�, the exported
ArchaeoMag �locks provide a model of true archaeological features in their correct position. Conclusion. In the previous sections, we have presented a new approach to the use of
magnetic data in archaeological geoph�sics, which provides a greater quantit� of information and allows an eas� integration with other geoph�sical data. In this approach, total field data are acquired, filtered, and reduced to archaeological anomalies according to standard procedures. �hen, an interactive forward modelling software, ArchaeoMag, is used to create and edit magnetization models of �uried settlements. In addition, it allows to distinguish �etween induced and NRM components of magnetization, there�� allowing a fine cali�ration of the model and possi�l� a dating of firing events. In the present version, three �asic shapes and one composite o�ject can �e created using the ArchaeoMag �UI: Dipoles, rectangular prisms, general vertical prisms, and stairwa�s. Each o�ject can have specific magnetization parameters, size, and �urial depth. �he shapes can �e easil� edited, moved, rotated, or resized according to a trial–and–error procedure to o�tain a �etter fit of the model anomalies to the o�served values. Finall�, ArchaeoMag allows to load topographic data, in order to generate model anomalies that can �e directl� compared with the o�served data even in the case of rugged relief.
References
Bevan B.W.� 2002: �he magnetic properties of archaeological materials, �eosight �ech. Report No. 5, 2nd edition, 13 pp., D�I: 10.13140/R�.2.1.3505.5603.
Powell A.J., McDonnell J.�., Batt C.M. & Vernon R.W.� 2002: An assessment of the magnetic response of an iron-smelting site, Archaeometr�, 44(4), 651-665.
�chettino A., Çondi D., Perna R., Pierantoni P.P. & �hezzi A.� 2017: �earching for the Antigonea theatre: A magnetic surve� in an ancient Epirus cit�, Archaeological Prospection, 24, 3–15, D�I: 10.1002/arp.1549.
�a��agh J.� 2003: �otal field magnetic prospection: are vertical gradiometer measurements prefera�le to single sensor surve�? Archaeological Prospection, 10(2), 75-81.
Vigliotti L.� 2006: �ecular variation record of the Earth’s magnetic field in Ital� during the Holocene: constraints for the construction of a master curve, �eoph�s. J. Int., 165(2), 414-429.