52
Chapter 5
PLAGIOCLASE STABILITY MELTS CALCULATION
In this chapter a calculation using MELTS (Ghiorso et al. 1994) protocol is presented. MELTS simulations have been performed to establish the crystallization conditions, starting from the most primitive magma erupted during the 2001-2006 eruptive period.
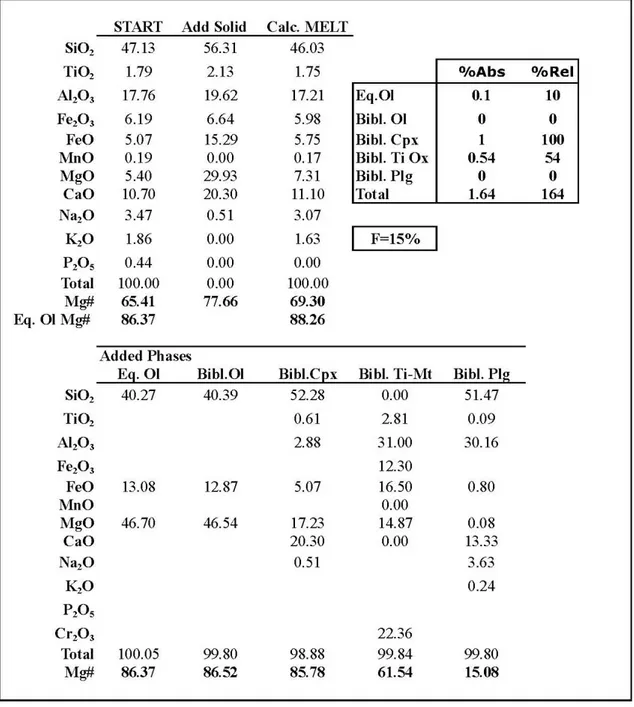
The starting melt has been selected from the emitted products of 2004/2005 eruption on the basis of Mg, Mg# and SiO2 contents. However, the selected magma was not a primitive,
despite its basic nature (Mg#=65). For this reason a re-equilibration has been performed adding a clinopyroxenitic assemblage of (Ol=6%, Cpx=61%, Ti-Mt=33%) for a total amount of 15% of fractionating solid. The composition of the equilibrium olivine of starting and arriving melt has been calculated. Re-equilibration process was stopped when olivine in arriving melt was Mg#=88 (Table 5.1).
The obtained magma after mantle re-equilibration was simulated as fractionating with MELTS software. Simulations consisted in decreasing temperature at steps ∆T=10°C, starting from the calculated liquidus temperature (T°C=1180-1170). Each run was done at different pressure from 2500 bars to atmospheric and increasing the water content in the magma from 0 wt% to 3.5%. Compositions of the equilibrium plagioclases have been plotted for pairs of P/H2O content and pressure (Fig. 5.1). Temperature lower limit was positioned at 1000 °C, a
comparable value with those of erupted magmas. Oxygen fugacity was constant at QFM+1 (where QFM is Quartz-Fayalite-Magnetite buffer).
Results are plotted in (Fig. 5.1). The thick line is the liquidus line of plagioclase, plotted for P (bars) and H2O (wt%) contents. To the left, plagioclase crystals are stable, to the left there
is no plagioclase on the liquidus; dotted lines link calculated runs in which plagioclase have the same composition. The dotted thick line is the volatile saturation curve, calculated with VolatileCalc.
Data indicate that plagioclase stability increase at lower pressure and it is strongly dependant on water content dissolved in the melt as also confirmed by several experimental studies (Grove & Baker, 1984; Baker & Eggler, 1987; Kinzler & Grove, 1992; Sisson and Grove, 1993a; Grove et al. 2003). The water content dissolved in the melt and at shallower pressure, An partitioning in the solid increase and a more calcic plagioclase is stabilized.
53 Model shows that most of the plagioclase cores crystallize between 2500 and 800 bars with compositions varying between An75 and An85 at conditions of volatile undersaturation of
the melt. At very shallow pressure (<800 bars) more calcic compositions are stable at H2O
dissolved >2.5%, at very shallow pressure. An88 is the most calcic plagioclase modeled by
MELTS and dotted lines are extrapolated.
Fig. 7.1 P(bars) vs. H2O (wt%) diagram, showing results of MELTS calculations. Thick line represents the liquidus line of plagioclase and composition of crystals is shown. Dotted lines are line with plagioclase of same composition. The blue line is the volatile saturation curve calculated with VolatileCalc.
54