C
HAPTER2.
M
ATERIALS AND METHODS2.1 – Phytoextraction experiments
2.1.1 – Chemicals
All chemicals used were analytical grade reagents and were obtained from Aldrich (Sigma-Aldrich Co., St. Luis, MO, USA) with the exception of [S,S]-EDDS that was obtained from Octel Company (Ellesmere Port, Cheshire, UK).
2.1.2 – Germination and tolerance index tests
For the germination test, seeds of nine crop species (B. carinata, Helianthus annuus, Lotus corniculatus, Phleum pratense, Secale cereale, Sorghum vulgare, Triticum aestivum, Trifolium alexandrinum, Zea mays) were surface sterilised for 10 min with NaClO (about 2% of active chlorine), rinsed in distilled water and germinated for the first 24 h in the dark and for other 24 h in the light at 20 °C in demineralised water with 50 µM Na2HAsO4, 20 µM CdSO4, 75 µM CuSO4, 200 µM Pb(NO3)2 and 750 µM
Zn(NO3)2, each added separately. The control was germinated in demineralised water.
After 48 h, the percentage of germinated seeds was determined. Seeds of the five species selected by germination test (B. carinata, Helianthus annuus, Secale cereale, Trifolium alexandrinum, Zea mays) were surface sterilised as described above, rinsed in demineralised water, germinated and grown for 5 days in demineralised water with 50 µM Na2HAsO4, 20 µM CdSO4, 75 µM CuSO4, 200 µM Pb(NO3)2 and 750 µM
Zn(NO3)2, each added separately. The control was grown in demineralised water. At
the end of the fifth day, seedlings were collected, washed with demineralised water and carefully dried with blotting paper.
The root length was measured and the tolerance index (TI) was calculated for each treatment as
where RL is the root length (cm).
2.1.3 – Hydroponic experiments
Seeds of the three species selected by germination test and tolerance index (B. carinata, S. cereale and T. alexandrinum) were surface sterilised as described above and rinsed in distilled water. Seeds were sown directly in plastic pots (22 cm in diameter and 25 cm high) with holes at the bottom and containing expanded clay. The pots were placed in plastic bins filled with 6 l of aerated nutrient solution composed of 0.25 mM NH4H2PO4, 1 mM Ca(NO3)2, 0.5 mM MgSO4, 1.5 mM KNO3, 11.5 µM H3BO3, 5 µM
Fe2(C4H4O6)3, 3.5 µM MnCl2, 0.03 µM MoO3, 0.3 µM ZnSO4, 0.12 µM CuSO4. The pH
was adjusted to 5.5. The three species were grown in hydroponic culture for four weeks at 400 µmol m-2 s-1 photon flux density, 16 h photoperiod, temperatures 22/20 °C
day/night and 75% relative humidity. In metal excess treatments, the nutrient solution was also added with each individual metal to reach a final concentration of 50 µM Na2HAsO4, 20 µM CdSO4, 75 µM CuSO4, 200 µM Pb(NO3)2 and 750 µM Zn(NO3)2.
In the following experiment, the selected B. carinata cv. 079444 was grown, using the same experimental conditions, in the simultaneous presence of As, Cd, Cu, Pb and Zn. Due to precipitation of salts, 10 mM NTA or 5 mM [S,S]-EDDS were added to keep metals in solution. The concentrations used represented the lowest concentrations to avoid salt precipitation.
All growth solutions were renewed every two days in order to maintain metal concentrations unchanged. Six pots per treatment were used with 10 seeds sown in each pot. After 4 weeks of growth, seedlings were collected, washed with deionised water and carefully dried with blotting paper. Plants were then separated into below- and above-ground parts, and root length and dry weights determined. Upon washing and drying at 110 °C for 24 h, the harvested material was ground, digested with
RL treated plants RL control plants
vessel and analysed for As, Cd, Cu, Pb and Zn using a Perkin-Elmer Optimal DV 2100 ICP OES. Standards (National Institute of Standards and Technology) and blanks were run with all samples to ensure accuracy and precision in the analyses. As for arsenic, preliminary tests showed that sample digestion by HNO3 resulted in a better recovery of
the metal in comparison with aqua regia and HNO3/H2SO4/HClO4 (10:1:4). The average
recovery of As was 91% and 87% for standard reference material (SRM 2704) and soil samples, respectively.
2.1.4 - Speciation modelling
Chemical speciation calculations concerning the hydroponic experiments were performed with the program Visual MINTEQ ver. 2.40b (Gustafsson, 2006).
2.1.5 - Pot experiments
The metal-contaminated area (As, Cd, Cu, Pb and Zn) is represented by a site used as a dump for pyrite ashes derived from the ore roasting processes for sulphur extraction. Preliminary tests showed that B. carinata performed poorly when sown in pots containing the contaminated soil. Two weeks after germination, seedlings appeared stunted compared to those grown on a standard soil, with leaves exhibiting extensive chlorosis and necrotic areas. After few days most seedlings died. A milder substrate was then prepared by mixing the contaminated soil with peat in a 2:1 ratio by volume. After mixing, the soil mixture was allowed to equilibrate for a period of four weeks, undergoing three cycles of saturation with water and air-drying before being re-mixed, characterised and finally planted. Soil characterisation was carried out according to Italian Standard Methods (Mi.P.A.F., 2000). The soil was then used to fill 22 cm diameter plastic pots (700 g soil per pot) and moistened with water to approximately 80% field capacity. Basal fertiliser (150, 75 and 95 mg Kg-1 soil N, P and K, supplied as
of B. carinata cv. 079444, at a density of 10 seeds per pot and placed outdoors on the soil surface. Following seedling emergence, the pots were thinned to five plants per pot. When soil moisture content decreased to 25% field capacity, pots were watered with 150 ml distilled water. After four weeks of growth (at the onset of flowering), plants were distributed into three groups. NTA or EDDS was added at 5 mmol Kg-1 soil, and
one set of plants was not amended with any chelator (NA) as a control. A randomised blocks design was used. Chelating agents were applied to the soil surface as solutions (100 ml). Following chelator application, soils were irrigated on a daily basis. Collection trays were placed under all pots to retain any leachate, which was re-applied to the soil in the pot. Plants (30 for each treatment) were harvested after one week from chelator application by cutting stems 1 cm above the soil surface. The above-ground parts were washed carefully with distilled water to remove any soil splash and oven-dried at 110 °C for 24 h. Dried material was then digested with concentrated HNO3 and
analysed for As, Cd, Cu, Pb and Zn as described above (see paragraph 2.1.3).
2.1.6 - Sequential extraction of metals
The European Community Bureau of Reference three steps sequential extraction procedure was followed (Rauret et al., 2000). The acid-solublephase (step 1),extracted with a 0.11 M acetic acid, is made up of exchangeable metals that are able to pass easily into water, for example, when the pH falls. It is the fraction with the most labile bond to the soil and, therefore, the most dangerous for the environment. The reducible phase (step 2), extracted with 0.5 M hydroxyl ammonium chloride, consists of metals bound to iron and manganese oxides that may be released if the soil changes from the oxic to the anoxic state. The oxidisable phase (step 3) was obtained following8.8 M H2O2 and
1 M ammonium acetate extractions and represents the amount of metals bound to organic matter and sulphides that can be released under oxidising conditions. After the sequential extraction steps, the residual metal content (fraction 4) was determined by digestion with aqua regia; this phase is the difference between the total metal content and the sum of the contents in the three previous phases. The metals found primarily in
this fraction are those that are associated with minerals, forming part of their crystalline structure and which, as a result, are unlikely to be released from soils. Metals in the solutions obtained following sequential extractions (fractions 1-3)and sample digestion (fraction 4) were determined as previously described (see paragraph 2.1.3).
2.1.7 - Desorption of metals from soil by chelators
The ability of chelators to desorb metals from the contaminated soil was examined using a consecutive solubilization approach with four extraction steps (Cooper et al., 1999). Chelator-based extraction solutions (5 mmol Kg-1 soil) were prepared by
dissolving EDDS in deionised water and the free acid form of NTA in NaOH at pH 7.0. For each treatment metal desorption was measured by placing 3 g of soil in a centrifuge tube and adding 30 ml extractant. Tubes were then capped, shaken for 16 h, and centrifuged at 17,400 g for 10 min. The supernatant was collected and the residue soil samples were re-suspended in 30 ml extractant. The above steps were repeated three times for a total of four consecutive extractions. Analysis of As, Cd, Cu, Pb and Zn in the combined supernatants was then carried out as previously described (see paragraph 2.1.3).
2.1.8 - Extractable metals in soil
Non–amended (NA) and NTA- or EDDS-amended soils were analysed for DTPA (diethylenetriaminepentaacetic acid)-extractable metals just after the harvest of B. carinata plants. 0.005 M DTPA, 0.01 M CaCl2 and 0.1 M triethanolamine (pH 7.3)
were added to the soil to give a 1:2 (w/v) soil:solution ratio (Mi.P.A.F., 2000). After shaking for 120 min, tubes were centrifuged at 17,400 g for 10 min and the supernatants collected after filtering through a Whatman No. 41 filter paper (pore size 20-25 µm). Analysis of As, Cd, Cu, Pb and Zn was performed as reported in paragraph 2.1.3.
In another experiment, DTPA-extractable metals were measured (Mi.P.A.F., 2000) in non-amended (NA), NTA- or EDDS-amended soils 2 and 7 days after the amendments.
2.1.9 – Determination of EDDS and NTA in soil
As amendments, 5 mmol Kg-1 soil EDDS or NTA were added to the mixed soil. The
extractable amount of chelators was determined 4 h, 2 and 7 days after the amendments. The extractable amount of EDDS and NTA was measured by placing 1 g soil in a centrifuge tube and adding 10 ml demineralised water. Tubes were then capped, shaken for 30 min and centrifuged at 14,000 g for 10 min. The supernatants were collected and the residue soil samples were re-suspended in 10 ml water. The above steps were repeated twice for a total of three consecutive extractions. Amounts of EDDS and NTA in the combined supernatants were then measured by forming their copper complexes. The supernatants were mixed with 5 mM CuSO4 resulting in the formation of Cu-NTA
or Cu-EDDS complexes. After the addition of the reagent, samples were incubated for 12 h at room temperature in the dark to allow the exchange between copper and the metals (such as Fe(III)) which are present in the soil. The precipitates, eventually present, were removed by filtration through 0.22 µm filter paper. Subsequently, the absorption of the filtrate was measured at 254 nm for Cu-NTA complex and at 670 nm for Cu-EDDS complex using a Cary (mod. 1E) UV-Vis spectrophotometer. Complexes quantification was obtained by the relationship absorbance vs concentration of standards.
2.1.10 – Wild species – assisted phytoextraction by B. carinata
The mixed contaminated soil, prepared as previously described (see paragraph 2.1.5), was used to fill 22 cm diameter plastic pots (700 g soil per pot) that were planted with seeds of three wild species, Pinus Pinaster, Plantago lanceolata and Silene paradoxa. Pots were placed outdoors on the soil surface. At the onset of flowering, the wild
species were harvested and the soil was analysed for DTPA (diethylenetriaminepentaacetic acid)-extractable metals as reported in paragraph 2.1.8 and for pH (Mi.P.A.F., 2000). Thereafter, the pots were planted with seeds of B. carinata cv. 079444, at a density of 10 seeds per pot and placed outdoors on the soil surface. One set of B. carinata seeds was planted in pots in which no wild species had previously been grown. Those plants were kept as control. The experimental design was a completely randomised blocks design. Following seedling emergence, the pots were thinned to five plants per pot. When soil moisture content decreased to 25% field capacity, pots were watered with 150 ml distilled water. After five weeks of growth, plants (30 for each treatment) were harvested by cutting stems 1 cm above the soil surface. The above-ground parts were washed carefully with distilled water to remove any soil splash and oven-dried at 110 °C for 24 h. Dried material was then digested with concentrated HNO3 and analysed for As, Cd, Cu, Pb and Zn as described above (see
paragraph 2.1.3).
2.1.11 – Flavonoids, organic and phenolic acids in root exudates
Seeds of Silene paradoxa, Plantago lanceolata and Pinus pinaster were sterilised with ethanol 70% for 20 s and with NaClO 2.5% for 20 min and washed three times with demineralised water. The seeds were then germinated for 3 days in the dark on floating trays containing 400 ml of continuously aerated nutrient solution (for nutrient solution composition see paragraph 2.1.3). The culture conditions were a 16 h (day) photoperiod, a 160 µmol m-2 s-1 photon flux density, a 23 ± 1 °C temperature and a 60/65% relative
humidity. After 15 days, the plants were removed from the floating trays and transferred to 25 ml vials, one plant per vial. The vial contained 20 ml of nutrient solution added with the five metals to reach a final concentration of 10 µg ml-1 Cd(NO
3)2, 10 µg ml-1
Pb(NO3)2, 10 µg ml-1 Zn(NO3)2, 80 µg ml-1 Cu(NO3)2 and 3 µg ml-1 Na2HAsO4. One set
of plants, kept as control, was transferred to vials containing 20 ml of nutrient solution. After 24 h, seedlings were removed from vials. The treatment and control solutions were lyophilised (Heto FD3) and the residue stored at –80 °C till analysed. Pending
analysis, the residue was dissolved in demineralised water and radical exudates were analysed for flavonoids, organic and phenolic acids with a Waters’s (Waters, Milford, MA, USA) HPLC system consisting of two 515 pumps and a 2487 programmable UV detector.
Organic acids were separated on a Waters Nova-Pack C18 reverse-phase column (150 x 3.9 mm; 4 µm; spherical; PS: 60 Å; CL: 4%; end-capped) and detected at 210 nm wavelength by Waters UV 2487. A phosphate buffer (KH2PO4/H3PO4) 10 mM pH=2.3
at a flow rate of 0.4 ml min-1 was used as mobile phase.
Phenolic acids and flavonoids were separated on a Waters Simmetry C18 reverse-phase column (150 x 3.9 mm; 5 µm; spherical; PS: 100 Å; CL: 19%; end-capped).
Phenolic acids were detected at 254 nm wavelength. Solvent A was 2% acetic acid and 30% acetonitrile and 2% acetic acid was used as solvent B. A linear gradient from 10% to 95% solvent B for 55 min was used at a flow rate of 1 ml min-1.
Unconjugated flavonoids were detected at 365 nm (quercetin and kaempferol) and 290 nm (naringenin). The mobile phase was 55% of methanol and 45% of 0.05% trifluoroacetic acid (TFA), eluted at a flow rate of 1 ml min-1.
Identification of flavonoids, organic and phenolic acids was obtained by comparison of their retention times with retention times of authentic standards (Sigma Chemical Co., St. Louis, MO, USA). Compounds quantification was obtained by the relationship peak area vs concentration of standards. Chromatogram analysis was performed by Millennium 32 (Waters). Total compounds concentrations were calculated as sum of individual amount.
2.1.12 – Statistical analysis
Results are the means ± SD of a number of replicates that varied among the experiments. The number of replicates and independent experiments, if present, is reported in the caption of each table or figure. Significance was calculated using Duncan’s Multiple Range Test (P ≤ 0.01).
2.2 – Arsenic
2.2.1 – Chemicals
Water was obtained from a Milli-Q purification system (18.2 MΩ·cm). 4-morpholineethanesulphonic acid (MES), sodium arsenate, sodium arsenite and all salts used for the nutrient solution were obtained from Sigma-Aldrich (Sigma-Aldrich Co., St. Luis, MO, USA). All chemicals used were analytical grade reagents.
2.2.2 - Plant growth
Seeds of Brassica carinata cv. 079444 were surface sterilised for 10 min with diluted NaClO (about 2% active chlorine) and directly sown in trays (22 cm in diameter and 25 cm high) with holes at the bottom containing expanded clay moistened with deionised water. After germination in the dark (about 3 days), seedlings were watered with nutrient solution (for nutrient solution composition see paragraph 2.1.3). Plants were grown for 15 days in a controlled environment growth cabinet (day/night period 16/8 h, day/night temperature 22/20 °C, relative humidity 75% and light intensity 400 µmol m-2
s-1 photon flux density). The nutrient solution was changed three times every week and
aerated continuously. The experimental design was completely randomised with each treatment replicated three times. Three independent experiments were performed.
2.2.3 - Root desorption procedure
15-day–old Brassica carinata roots were excised at the basal node and replicated samples of excised roots were incubated in 0.25 mM arsenite (NaAsO2) or arsenate
(Na2HAsO4·7H2O) for 30 min, washed with deionised water and then analysed
desorbing solution containing deionised water or 5 mM CaSO4 or 5 mM Na2HPO4.
Desorbing solutions were maintained at 4 °C, the volume of solution was 100 ml g-1
fresh root weight. At the end of the desorption period, the roots were washed and analysed for As concentration as reported in the paragraph 2.2.8. The results showed that the As concentration retained in the roots declined significantly (P ≤ 0.01) during the first 30 min; no further significant declines were detected between 30 and 45 min. Use of calcium sulphate or sodium phosphate didn’t cause significant differences from the water control; therefore deionised water was chosen as the best desorbing solution.
2.2.4 - Time-dependent kinetics of As(III) and As(V) uptake
Two weeks after germination, clay was removed from the roots and the intact plants were transferred to a pre-treatment solution containing 0.5 mM CaCl2 and 5 mM MES
with pH adjusted to 5.5. Twelve hours later, and 2 h into the light period, plants were removed from the pre-treatment solution and washed carefully with deionised water. The roots of B. carinata seedlings were then excised at the basal node, weighed and incubated in a test solution containing 0.25 mM arsenate (Na2HAsO4·7H2O) or arsenite
(NaAsO2) together with 5 mM MES with pH adjusted to 5.5. The uptake solution was
aerated vigorously and continuously. The temperature was maintained at 25 ± 0.5 °C. At 0, 5, 10, 15 and 30 min and thereafter every 30 min up to 3 h and then every hour up to 8 h, roots were removed from the test solution, washed with ice-cold water and incubated for 30 min in ice-cold (4 °C) deionised water to remove the adsorbed arsenic species from the free space of the roots. In another experiment the roots were incubated in the same test solutions at T = 5 °C for 0, 5, 10, 15, 30, 60 and 90 min before being removed from the test solution and treated as previously described. Stock solutions of arsenite and arsenate were prepared using sodium arsenite (NaAsO2) and sodium
2.2.5 - Concentration-dependent kinetics of As(III) and As(V) uptake
CaCl2 pre-treated roots of B. carinata seedlings were excised at the basal node and
incubated in test solutions containing different concentrations of arsenite or arsenate for 30 min. The temperature was maintained at 25 ± 0.5 °C. Test solution concentrations of arsenite and arsenate ranged between 0 and 2.5 mM. All test solutions contained MES 5 mM adjusted to pH = 5.5. In all experiments, at the end of incubation in test solutions, the roots were washed with ice-cold water and incubated for 30 min in ice-cold (4 °C) deionised water.
2.2.6 - Arsenate and arsenite influxes at different phosphate concentrations
CaCl2 pre-treated roots of B. carinata plants were excised at the basal node and
incubated for 30 min in uptake solutions containing 0.25 mM arsenate (Na2HAsO4·7H2O) or arsenite (NaAsO2) and different phosphate concentrations ranging
from 0 to 2.5 mM. All test solutions contained MES 5 mM adjusted to pH = 5.5. The temperature was maintained at 25 ± 0.5 °C. In all experiments, at the end of incubation in test solutions, the roots were washed with ice-cold water and incubated for 30 min in ice-cold (4 °C) deionised water to remove the absorbed arsenic species from the root free spaces.
2.2.7 - Measurement of membrane integrity
CaCl2 pre-treated roots of B. carinata were excised at the basal node and incubated for
30 min in uptake solutions containing different amounts (0.1, 0.25, 0.5, 1, 1.5 and 2.5 mM) of arsenate (Na2HAsO4·7H2O) or arsenite (NaAsO2). One set of roots was
incubated in demineralised water and kept as control. Treated and untreated roots were rinsed in deionised water and gently transferred into plastic vials containing deionised water. After 60 min, aliquots of all aqueous solution were sampled for K+
determination. Rootswere then immersed for 5 min in liquid nitrogen and placed again in the same vials containing the leachate. They were gently stirred for another 60 min prior to measuring the total K+ leached from the killed cells. The relative leakage ratio
was calculated as the ratio between the final and the initial K+ concentrations (Quartacci
et al., 2001). Potassium released was measured as reported in the paragraph 2.2.8.
2.2.8 - Arsenic and potassium determination
The root samples for metal analyses were microwave digested with concentrated nitric acid (w/v = 1/10) (see paragraph 2.1.3) in a Teflon pressure digestion vessel. Arsenic concentrations in the samples were determined by ICP (Mod. OPTIMAL DV 2000, Perkin Elmer, Thornill, ON, Canada). Potassium contained in solute leakage solutions was determined by atomic absorption spectrometry (Mod. 373,Perkin Elmer, Thornill, ON, Canada). Standards (National Institute of Standard and Technology) and blanks were run with all samples to ensure accuracy and precision during analyses.
2.2.9 - Statistical analysis
Results are the means ± SD of three replicates, analysed in triplicate, of three independent experiments. Significance was calculated using Duncan’s Multiple Range Test (P ≤ 0.01). Curve fitting was done using the computer package Microsoft Excel (Microsoft Office 2000 Professional, USA) and kinetic parameters were assigned, when it was possible, by fitting the data to an additive Michaelis-Menten function using an interactive computer program that minimizes the sums of squares.
2.3 – Copper
2.3.1 – Uptake kinetics
2.3.1.1 – Chemicals
Water was obtained from a Milli-Q purification system and had a resistance greater than 18.2 MΩ·cm. Nitrilotriacetic acid (NTA), 4-morpholineethanesulphonic acid (MES), copper sulphate, lead nitrate and all salts used for the nutrient solution were obtained from Sigma-Aldrich (Sigma-Aldrich Co., St. Luis, MO, USA). [S,S]-EDDS was obtained from Octel Company (Ellesmere Port, Cheshire, UK). All chemicals used were analytical grade reagents.
2.3.1.2 - Plant culture
Seeds of Brassica carinata cv. 079444 were surface sterilised for 10 min with diluted NaClO (about 2% active chlorine) and sown in trays (22 cm in diameter and 25 cm high) with holes at the bottom containing clay moistened with deionised water. After germination in the dark (about 3 days), seedlings were watered with nutrient solution (for nutrient solution composition see paragraph 2.1.3). Plants were grown 15 days in a controlled environment growth cabinet (day/night period 16/8 h, day/night temperature 22/20 °C, relative humidity 75% and light intensity 400 mmol m-2 s-1 photon flux
density). The nutrient solution was changed three times every week and aerated continuously. The experimental design was completely randomised with each treatment replicated three times. In some cases, three independent experiments were performed.
2.3.1.3 - Time-dependent kinetics of Cu(II) uptake
Two weeks after germination, clay was removed from the roots and the intact plants were transferred to a pre-treatment solution containing 0.5 mM CaCl2 and 5 mM MES
with pH adjusted to 5.5. Twelve hours later, and 2 h into the light period, the plants were removed from the pre-treatment solution and washed carefully with deionised water. The roots of B. carinata seedlings were then excised at the basal node, weighed and incubated in a test solution containing 50 µM copper sulphate (CuSO4) together
with 5 mM MES with pH adjusted to 5.5. The uptake solution was aerated vigorously and continuously. The temperature was maintained at 25 ± 0.5 °C. At 0, 5, 10, 15 and 30 min and thereafter every 30 min up to 3 h and then every hour up to 8 h, roots were removed from the test solution, washed with ice-cold water and incubated for 30 min in ice-cold (4 °C) 5 mM lead nitrate to remove the adsorbed copper from the free space of the roots. Stock solutions of copper sulphate were prepared using copper sulphate from Aldrich (Sigma-Aldrich Co., St. Luis, MO, USA).
2.3.1.4 - Concentration-dependent kinetics of Cu(II) uptake
CaCl2 pre-treated roots of B. carinata seedlings were excised at the basal node and
incubated in test solutions containing different concentrations of copper sulphate for 30 min. The temperature was maintained at 25 ± 0.5 °C. Test solution concentrations of copper ranged between 0.12 (control) and 300 µM. All test solutions contained MES 5 mM adjusted to pH = 5.5. In all experiments, at the end of incubation in test solutions, the roots were washed with ice-cold water and incubated for 30 min in ice-cold 5 mM Pb(NO3)2.
2.3.1.5 - Measurement of membrane integrity
CaCl2 pre-treated roots of B. carinata were excised at the basal node and incubated for
30 min in uptake solutions containing different amounts (10, 25, 50, 100, 150, 300 µM) of copper sulphate (CuSO4). One set of roots were incubated in 0.12 µM CuSO4 and
kept as control. All samples were subsequently desorbed for 30 min with ice-cold (4 °C) 5 mM Pb(NO3)2. Treated and untreated roots were rinsed in distilled water and gently
transferred into plastic pots containing aerated distilled water. After 60 min, aliquots of all aqueous solutions were sampled for K+ determination. Roots were then immersed for
5 min in liquid nitrogen and placed again in the same vials containing the leachate. They were gently stirred for another 60 min prior to measuring the total K+ leached
from the killed cells. The relative leakage ratio was calculated as the ratio between the final and the initial K+ concentrations (Quartacci et al., 2001). Potassium released was
measured as reported in the section 2.3.1.7.
2.3.1.6 - Concentration-dependent uptake kinetics of Cu-NTA and Cu-EDDS complexes
CaCl2 pre-treated roots of B. carinata seedlings were excised at the basal node and
incubated in test solutions containing different concentrations of copper (from 0.12 to 300 µM) together with 5 mM MES (pH = 5.5) and [S,S’]-EDDS or NTA. The chelators were added at a 5 mM concentration in one experiment and at a 2.5 mM concentration in another experiment. The temperature was maintained at 25 ± 0.5 °C. In all experiments, after the incubation in test solutions, the roots were washed with deionised water and incubated for 30 min in ice-cold (4 °C) 5 mM Pb(NO3)2 to remove the Cu+2
2.3.1.7 - Copper and potassium determination
The root samples for metal analyses were digested with concentrated nitric acid (w/v = 1/10) (Izzo et al., 1991) in a Teflon pressure digestion vessel in a microwave. Copper concentrations in the samples and potassium contained in solute leakage were determined by atomic absorption spectrometry (Mod. 373, Perkin-Elmer, Thornill, ON, Canada). Standards (National Institute of Standard and Technology) and blanks were run with all samples to ensure accuracy and precision during analyses.
2.3.1.8 – Statistical analysis
Results are the means ± SD of three replicates, each analysed in triplicate, of three independent experiments. Significance was calculated using Duncan’s Multiple Range Test (P ≤ 0.01). Curve fitting was done using the computer package Microsoft Excel (Microsoft Office 2000 professional, USA) and kinetic parameters were assigned, when it was possible, by fitting the data to additive Michaelis-Menten functions using an interactive computer program that minimizes the sums of squares.
2.3.2 – Copper, NTA and [S,S]-EDDS accumulation in plant tissues
2.3.2.1 – Copper, NTA and [S,S]-EDDS determination in plant tissues
Chemicals were obtained from the companies reported in the section 2.3.1.1. Seeds of Brassica carinata were germinated and grown as described in paragraph 2.3.1.2. Two-weeks-old seedlings were removed from the nutrient solution and the intact plants were transferred to a pre-treatment solution containing 0.5 mM CaCl2 and 5 mM MES
with pH adjusted to 5.5. Twelve hours later, and 2 h into the light period, the pre-treatment solution was replaced with pre-treatment solutions containing 5 mM MES, 300
µM CuSO4 and 5 mM EDDS or NTA with a final pH adjusted to 5.5. One set of
seedlings was incubated in a solution containing 5 mM MES and 300 µM CuSO4 with a
final pH adjusted to 5.5 and kept as control. After 20 min, 3, 6, 12, 24, 36, 48 and 72 h of exposure, plants were removed from the treatment solutions and separated into below- and above-ground parts. Three replicates were used for each treatment and three plants per treatment were pooled. The roots were washed with ice-cold demineralised water and incubated for 30 min in ice-cold (4 °C) 5 mM lead nitrate to remove the adsorbed copper from the free space of the roots. After the desorption, roots were carefully dried and the above- and below-ground parts were weighed.
Fresh material was oven dried at 110 °C for 24 h and then digested with concentrated HNO3 (Izzo et al., 1991) in Teflon pressure digestion vessels in a microwave. The Cu
concentration in roots and shoots of treated and untreated plants was determined by flame atomic absorption as described in the paragraph 2.3.1.7.
Fresh material was also used to determine total EDDS or NTA in roots and shoots. Plant material was ground and extracted with 3 ml of 50% (v/v) ethanol, heated at 80 °C for 15 min, cooled to room temperature and centrifuged at 14,000 g for 10 min at room temperature. The supernatant was collected and the residue was re-suspended in 3 ml of 50% (v/v) ethanol. The above steps were repeated twice for a total of three consecutive extractions. The combined supernatants were stored at –80 °C till analysed by high pressure liquid chromatography (HPLC) for total EDDS or NTA. NTA and EDDS were analysed using a Waters Spherisorb ODS2 C18 reverse-phase column (250 x 4.6 mm; 5 µm; spherical) and detected at 254 nm wavelength by Waters UV 2487.
Pending analysis, the supernatants for EDDS determination were diluted 4:1 with a solution of 0.001 M FeCl3 in 0.01 M HCl to convert the different EDDS species into
Fe(III)-complexes and filtered through a 0.45 µm filter. A 15% methanol and 85% tetrabutylammoniumbromide (0.02 M) was used as mobile phase with a flow rate of 1 ml min-1 (Metsärinne et al., 2001). The samples for NTA analysis were mixed with 10
mM CuSO4 to convert NTA in Cu(II)-complex and filtered through a 0.45 µm filter. A
90% methanol and 0.4% tetrabutylammonium hydroxide was used as mobile phase with a flow rate of 0.2 ml min-1 (Nancharaiah et al., 2006).
2.3.2.2 – Statistical analysis
Results are the means ± SD of three replicates analysed in triplicate. Significance was calculated using Duncan’s Multiple Range Test (P ≤ 0.01). A completely randomised bocks design was used.
2.3.3 – Copper transport in xylem sap
2.3.3.1 – Chemicals
Water was obtained from a Milli-Q purification system and had a resistance greater than 18.2 MΩ.cm. Copper sulphate, all amino acids used as standards, all buffers and
reagents for cytosolic contamination analyses were obtained from Sigma-Aldrich (Sigma-Aldrich Co. St. Luis, MO, USA). (-)-Nicotinamine was obtained from T. Hasegawa Co., LTD (Kawasaki-shi, Japan). All chemicals used were analytical grade reagents.
2.3.3.2 – Xylem sap collection
Brassica carinata plants were grown as described in paragraph 2.3.1.2. Three weeks after germination, plants were removed from nutrient solution and transferred to the treatment solutions. The experimental set up was arranged in a complete randomised blocks design with three replicate blocks per each copper concentration. The treatment solution was a modified nutrient solution (for nutrient solution composition see paragraph 2.1.3) containing 0, 2.5 and 5 µM Cu supplied as CuSO4. The normal nutrient
was adjusted to 5.5. pH and copper concentration of the culture solutions were monitored and the solutions were renewed every day. Plants were grown in treatment solutions for 3 days before harvest. At harvest, the B. carinata stems were severed using a stainless-steel razor blade at about 2 cm above media surface perpendicularly to the stem axis. To avoid contamination of the xylem exudates with the cell sap, the first drop of exudates was discarded. The plants remained in the treatment solutions. The decapitated stumps were wiped gently and fitted with Tygon tubing and the xylem sap was collected all over the night. The saps were filtered immediately (0.45 µm) and frozen at –80 °C until needed.
2.3.3.3 – Xylem sap analysis
The xylem pH was measured directly with Metrohm 654 pH-meter (Metrohm LTD, Herisau, SW). Total Cu concentrations in xylem saps were measured using an atomic absorption spectrophotometer (Mod. 373, Perkin-Elmer, Thornill, ON, Canada). Free Cu2+ concentrations were measured directly with a cupric electrode (Orion 9629BN
IonplusTM Cupric Electrode; Thermo Orion, Beverly, MA, USA) which only responds to
Cu2+ ions in solution.
Contamination of the xylem sap by cytosolic enzymes was assessed in each sample as in Lòpez-Millàn et al. (2000). Cytosolic malate dehydrogenase (c-mdh; EC 5.3.1.9) and cytosolic hexose phosphate isomerase (c-hpi; EC 1.1.1.37) were used as cytosolic contamination markers for xylem sap. The activity of c-hpi was determined using Fru-6-P as substrate, which is converted by c-hpi into Glc-6-Fru-6-P. This is then oxidized by exogenous glucose-6-phosphate dehydrogenase and the simultaneous reduction of NADP+ was measured from the increase in A
340. The final reaction mixture (pH = 8)
was 50 mM Tris [tris(hydroxymethyl)-aminomethane], 5 mM MgCl2, 1 mM NaCl, 0.4
mM NADP+, 0.46 U ml-1 glucose-6-phosphate dehydrogenase and 1.4 mM Fru-6-P. The
activity of c-mdh was determined using oxalacetate as substrate and measuring the decrease A340 due to the enzymatic oxidation of NADH. The final reaction mixture (pH
two markers in xylem sap was checked against the corresponding activities in plant tissue homogenates. To measure these enzymatic activities plant tissues were homogenized with 2 ml of a buffer (pH = 8) containing 100 mM HEPES [4-(2-hydroxyethyl)-1-piperazineethanesulphonic acid], 30 mM sorbitol, 2 mM dithiothreitol, 1mM CaCl2, 1% (w/v) bovine serum albumin and 1% polyvinylpyrrolidone. The
supernatant was collected after 10 min centrifugation at 10,000 g and analysed immediately.
2.3.3.4 – Amino acids detection in B. carinata xylem sap
Major amino acids in xylem exudates of B. carinata were separated by reversed phase high performance liquid chromatography (RP-HPLC) and quantified by UV detection. Before separation, amino acids were converted into their phenylthiocarbamyl (PTC) derivatives (Gonzàlez-Castro et al., 1997). 0.5 ml of standard solution or B. carinata xylem saps were transferred into a flask and vacuum dried at 40 °C. 0.5 ml of methanol/water/triethylamine (2/2/1 v/v/v) were added to the residue and then vacuum removed at 40 °C. Next, 0.5 ml of the derivatising reagent methanol/water/triethylamine/phenylisothiocyanate (7/1/1/1 v/v/v) were added, the flask was shaken and left to stand at room temperature for 20 min. Finally, the solvents were removed under a nitrogen stream and the flask was sealed and stored at 4 °C.
A Waters’s (Waters, Milford, MA, USA) HPLC system consisting of two 515 pumps, a 2487 programmable UV detector was used. A C18 Waters Spherisorb ODS2 column (4.6
x 250 mm; 5 µm; spherical) was used for all separations. The column temperature was controlled at 40 ± 0.5 °C using a Recipe HPLC Thermostat HT 3000. The sample injection volume was 20 µl. The wavelength was set at 254 nm. Eluent A was an aqueous buffer prepared by adding 0.5 ml L-1 of triethylamine to 0.14 M ammonium
acetate and titrating it to pH 6.2 with glacial acetic acid . A 60/38/2 (v/v) of acetonitrile/water/isopropanol was used as eluent B. The gradient program is shown in Table 2.1. The separation between threonine (Thr) and γ-aminobutyric acid (GABA)
Retention times of amino acids were checked using authentic standards (Sigma-Aldrich Co., St Luis, MO, USA) and their quantification was obtained from the relationship peak area vs concentration of standards. Chromatogram analysis was performed by Millennium 32 (Waters).
2.3.3.5 – Free Cu2+ concentration vs pH titrations
The stability of Cu-complexes containing carboxylic acid functional groups is normally sensitive to solution pH. The proportion of free Cu2+ ions varies with solution pH
providing a “signature” for the Cu-organic complex system. A cupric electrode (Orion 9629BN IonplusTM Cupric Electrode; Thermo Orion, Beverly, MA, USA) was used to
measure the free Cu2+ ion concentration in amino acid solutions, plant saps and
simulated saps at varying solution pH values.
Xylem sap (5 ml) collected from B. carinata treated with 5 µM CuSO4 was transferred
into 10 ml vials and its pH was set at 6.5. Then, the pH of the solution was decreased stepwise from 6.5 to 3 while the solution free Cu2+ concentrations and pH were
Table 2.1. Gradient program employed for the separation of PTC-amino acids
Time
Flow rate
(ml min-1) % Eluent A % Eluent B
0 1.0 90 10 12 1.0 70 30 20 1.0 52 48 22 1.0 0 100 24 1.0 0 100 30 1.5 0 100 37 1.0 90 10
monitored. Solution of 10 mM KOH and HNO3 were used to adjust the pH. Since the
total volume of these adjustments represented less than 0.4% of the total solution volume, no corrections for dilution were made.
Thereafter, in order to establish the importance of each amino acid detected in the xylem in Cu transport, simulated xylem saps were prepared and titrated as above described. The simulated saps contained single amino acid or a combination of amino acids, and copper at the concentrations found in the real xylem.
The xylem sap of plants treated with 0 µM CuSO4 had a xylem copper concentration
that was too low (0.01 µg ml-1 xylem total Cu concentration) to be detected by the
cupric electrode. To solve this problem, an exogenous amount of copper was added to the xylem sap till the Cu concentration detected in the xylem of B. carinata treated with 5 µM CuSO4 was reached. Good performances of the cupric electrode were found with
that amount of copper. The titration of the modified xylem sap was conducted as previously described. Also in this case, simulated saps were prepared and titrated.
2.3.3.6 - Statistical analysis
Results are the means ± SD of three replicates, each analysed in triplicate, of three independent experiments. Significance degree was calculated using Duncan’s Multiple Range Test (P ≤ 0.01).
2.4 – Genetic engineering of tobacco plants
2.4.1 – Plasmid construction
Total RNA from A. thaliana was isolated as described in paragraph 2.4.4. Polyadenylated mRNAs were obtained using Oligotex mRNA Spin-Column (Clontech). The first-strand cDNA was prepared from 1 µg of mRNA. MT2b gene was isolated from cDNA of the genome of A. thaliana using specific primers AtMT2bfw
(5’-CGGAATTCCATGTCTTGCTGTGGAAGCTG-3’) and AtMT2brev
(5’-CCGCTCGAGCGCCTTCATTTGCAGGTACAAGGGTTG-3’) containing the
restriction sites EcoR1 and Xho1, respectively. The product of PCR was cloned into pGEM-T Easy Vector (Promega) and sequenced. Once the sequence was confirmed, the AtMT2b sequence was cleaved with the opportune restriction endonucleases and cloned into the EcoR1-Xho1 replacement region of the pENTR4 vector (Invitrogen) and thereafter into the Gateway destination vector pK2GW7,0 by recombination. The Agrobacterium tumefaciens strain C58 pMP90 was used to host the plasmid. The Agrobacterium was transformed by electroporation.
2.4.2 – Tobacco transformation procedure
The day before transformation, a little droplet of glycerol stock of the AtMT2b Agrobacterium tumefaciens strain was transferred to 50 ml of growing solution (Table 2.2) containing 50 mg l-1 gentomicine, 34 mg l-1 rifampicine and 100 mg l-1
spectinomicine. Since the antibiotics are labile, all media containing these substances were freshly prepared just before use and the media were cooled to about 50 °C before their addition. After an overnight incubation, the bacteria were spun down for 15 min at 2500 rpm in the cold room (4 °C). The supernatant was discarded and the pellet was washed with 25 ml of washing solution (Table 2.2). Cells were spun down again for 10 min at 2500 rpm in the cold room (4 °C), the supernatant discarded and cells diluted
1:10 with sterile demineralised water. The optical density (OD) was measured at 660 nm. An OD660 of 2.0 proved to be optimal for transformation.
Leaf explants were taken from plants growing in the greenhouse. Not fully expanded leaves of young plants are better for an easy transformation. Leaves were surface sterilised by shortly dipping them in 70% ethanol. Then, the leaves were incubated for 10 min in 0.5% hypochlorite followed by 5 rinses in sterile demineralised water within a period of 10 min. The leaves were cut into explants of maximum 0.5 x 0.5 cm in a sterile petridish. All sides of the explants were wounded. A sharp scalpel, renewed frequently, was used. The explants were added to a petridish containing 20-25 ml of the diluted overnight grown Agrobacterium tumefaciens culture so that all explants were floating.
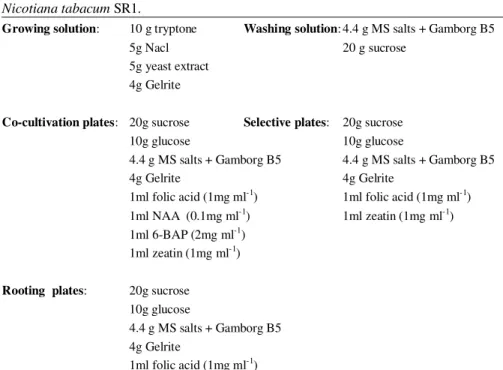
Table 2.2. Composition of media used for Agrobacterium-mediated transformation of
Nicotiana tabacum SR1.
Growing solution: 10 g tryptone Washing solution: 4.4 g MS salts + Gamborg B5
5g Nacl 20 g sucrose
5g yeast extract 4g Gelrite
Co-cultivation plates: 20g sucrose Selective plates: 20g sucrose
10g glucose 10g glucose
4.4 g MS salts + Gamborg B5 4.4 g MS salts + Gamborg B5
4g Gelrite 4g Gelrite
1ml folic acid (1mg ml-1) 1ml folic acid (1mg ml-1)
1ml NAA (0.1mg ml-1) 1ml zeatin (1mg ml-1)
1ml 6-BAP (2mg ml-1)
1ml zeatin (1mg ml-1)
Rooting plates: 20g sucrose 10g glucose
4.4 g MS salts + Gamborg B5 4g Gelrite
1ml folic acid (1mg ml-1)
All media were adjusted to pH = 5.8, autoclaved at 110 °C for 10 min. The hormones and vitamins were co-autoclaved. Antibiotics were added after cooling. NAA = α-naphtalenacetic acid; BAP =
6-The explants were incubated 10-15 min to allow the bacteria to contaminate the explants and thereafter were transferred to co-cultivation plates (Table 2.2), 10-15 explants per plate. Explants and bacteria were co-cultivated for 2-3 days at 25 °C under day-night regime. Thereafter, explants were transferred to selective medium plates (Table 2.2) supplanted with 500 mg l-1 carbenicillin and 300 mg l-1 kanamycin. To avoid
the escapes, the edges of the explants were perfectly in touch with the medium. The first week, the plates were checked every 2 days for fungi and were renewed every 2-3 weeks. After 3-6 weeks green shoots started to develop from the callus. These plantlets were separated into single plants and cultured on rooting media plates (hormone free medium supplanted with 500 mg l-1 carbenicillin and 300 mg l-1 kanamycin) (Table
2.2). At this stage, removal of all traces of callus from the base of plantlets was essential. Roots appeared in 1-2 weeks. After rooting, the plants were removed from plates, the gelrite was carefully washed away from roots and the plants were planted in soil and grown in the greenhouse at 400 µmol m-2 s-1 photon flux density, 16 h
photoperiod, temperatures 22 °C day/night and 75% relative humidity. DNA and RNA analyses were performed in order to confirm the transformation and test the expression of the inserted gene. Transformed plants were allowed to set seeds. Seeds of T1 plants were collected.
2.4.3 – Confirmation of tobacco transformation
125 mg of fresh tissue of potentially transformed tobacco plants were taken to extract DNA. The fresh material was transferred into 2 ml screw-capped microfuge tube, frozen in liquid nitrogen and ground up until a fine powder was obtained. 600 µl of pre-heated (65 °C) reagent A (Table 2.3) were quickly added and mixed thoroughly. Thereafter, 200 µl of pre-heated (65 °C) reagent B (Table 2.3) were added and mixed by inversion. The final mixture was incubated for 10 min (at maximum) at 65 °C and then transferred to ice for 20 min. 500 µl of ice-cold (0 °C) chloroform were added and the mixture was shaken on the tilt shaker for 10 min at room temperature. After 10 min of centrifugation, 700 µl of the upper phase were transferred to fresh tubes and 450 µl of isopropanol at
room temperature were added. The mixture was gently mixed by inversion to precipitate the DNA. The DNA was collected by 10 min of centrifugation. The supernatant was discarded and 1 ml of 70% ethanol was added to wash the precipitate. The mixture was spun down for 2 min and the supernatant discarded again. The residue was vacuum dried for 15 min and resuspended in 30 µl of sterile demineralised water. To increase the solubility, the solution was incubated at 37 °C for 15 min. The quality, concentration and nature of the extracted DNAs were checked by PCR.
PCRs with chromosomal DNA of potentially transformed tobacco plants as template and 35Sfw CATTGCCCAGCTATCTGTCAC-3’) and AtMT2brev (5’-CCGCTCGAGCGGGTTGATTTGGAGGTACAAGGGTTG-3’) as primer pair were used to verify the insertion of the AtMT2b gene and therefore used as an indicator of successfully transformed plants. The DNA fragments were separated by gel-electrophoresis on a 1% agarose gel. Plants were checked also for their RNA expression as reported in paragraph 2.4.4.
2.4.4 – RNA isolation, Northern-Blot Analysis and RT-PCR
200/400 ng of fresh plant material were taken to extract total RNA. Plant fresh material was transferred into 2 ml screw-capped microfuge tubes, frozen in liquid nitrogen and Table 2.3. Composition of the reagents used for DNA extraction
Reagent A
0.27% SDSReagent B
5 M Potassium Acetate 400 mM Tris.HCl pH=860 mM EDTA 150 mM NaCl
10 mM 2-mercaptoethanol 1% polyvinylpyrrolidone
Trisbase (tris(hydroxymethyl)aminomethane) pH = 8, 0.1 M NaCl, 0.02 M EDTA] and 500 µl of phenol:chloroform:isoamylalcohol (25:24:1 v/v/v) were added to the tube. The mixture was shaken thoroughly and centrifuged for 5 min. The upper layer was transferred to a clean tube and 500 µl of phenol:chloroform:isoamylalcohol (25:24:1 v/v/v) were added. The mixture was shaken thoroughly and centrifuged for 5 min. Finally, the upper layer was transferred into a clean tube and 500 µl of 4 M LiCl were added to precipitate the RNA. The solution was incubated overnight in cold chamber (4 °C) to favour the precipitation; thereafter total RNA was collected by centrifugation at 4 °C for 15 min. The supernatant was discarded and 180 µl 70% ethanol were added to wash the residue. The mixture was spun down for 5 min and the supernatant was discarded again. The residue was air dried for 15 min and resuspended in 50 µl sterile demineralised water. RNA was then quantified by determining the OD (Optical Density) at 260 nm of a 100 x diluted solution. 1 OD unit was equal to 4 µg/µl RNA. 8 µg RNA were separated by gel-electrophoresis on a 1.3% agarose gel and vacuum blotted onto Hybond N+ nylon membrane (Amersham) according to standard
procedures. RNA isolation and blotting was independently repeated three times. A PCR fragment representing the complete A. thaliana MT2b gene was amplified on tobacco shoot DNA using a PCR with specific primers AtMT2bfw
(5’-ATGGTTGCGGAGGTTGCAAA-3’) and AtMT2brev
(5’-CCGGAAGCCTCGTACTGAG-3’) and used as a template for the synthesis of the 32
P-labeled probe. For RNA blot hybridisation, the membrane was pre-hybridised at 65 °C in solution containing 7% sodium dodecyl sulphate (SDS), 0.5 M sodium phosphate (pH = 7.2), 1 mM EDTA (pH = 8) and 1% BSA (Albumin) and consequently hybridised with the 32P-labeled probe. After an overnight incubation at 65 °C, the membrane was
washed twice with 1 x SSC (0.015 M sodium citrate, 0.15 M NaCl, pH = 7), 0.1% SDS at 65 °C and exposed on a Phosphor Imager screen.
In addition, analysis of the relative gene expression was also performed using Real-Time Quantitative PCR (RT-PCR) and the 2-∆∆C
T method (Livak and Schmittgen, 2001).
Total RNA was isolated as previously described. The cDNA was synthesised from 5 µg of total RNA by reverse transcription with the M-MLV reverse transcriptase. For RT-PCR analysis, 2 µl single-stranded cDNA from each samples were added to RT-PCR
buffers, deoxynucleoside triphosphates and enzymes. The mixture was then split into
aliquots. The specific primers for AtMT2b (qAtMT2bfw
5’-ATGGTTGCGGAGGTTGCAAA-3’ and qAtMT2brev
5’-CCGGAAGCCTCGTACTGAG-3’) and Nicotiana tabacum MT2b (NtMT2b) as control (NtMT2bfw GTGGCTGTGGAGGATGTGG-3’ and NtMT2brev 5’-TGTTGCTTTCTCAGCAGATC-3’) were added; all the tubes were subjected to the same thermal cycler program. RT-PCR products were quantified as reported in the paper of Livak and Schmittgen (2001). Three replicates of each sample were quantified.
2.4.5 – Experimental conditions and design
Among the lines analysed, two lines, M9 and M10, were chosen for arsenic accumulation and tolerance experiments. M9 is a medium expressor while M10 is a high expressor. T1 seeds of the chosen different expression lines (M9 and M10) were germinated in soil and then transferred to polyethylene pots containing 1 l of nutrient solution composed of 1.5 mM KNO3, 0.4 mM Ca(NO3)2, 100 µM NH4H2PO4, 0.25 mM
MgSO4, 20 µM Fe(Na)-EDTA, 1 µM KCl, 25 µM H3BO3, 2 µM MnSO4, 2 µM ZnSO4,
0.1 µM CuSO4 and 0.1 µM (NH4)6Mo7O24 in demineralised water buffered with 2 mM
MES, pH = 5.5, adjusted with KOH. Solutions were renewed weekly and plants were grown in a growth chamber (250 µmol m-2 s-1 photon flux density, 14 h photoperiod,
temperatures 20/15 °C day/night and 75% relative humidity). After 2 weeks of pre-culture, transformed plants were exposed to a range of NaAsO2 concentrations (0 – 12
µM). Roots were stained with active coal powder and rinsed with demineralised water prior to exposure (Schat and Ten Bookum, 1992). As(III) tolerance was assessed from root elongation throughout 5 days exposure. For each treatment, 12 plants of either expression lines were used.
Arsenic uptake and translocation was determined in root and shoot material of 4 individual plants per treatment. Root material was carefully rinsed with demineralised water. Arsenic was determined by digesting 50-100 mg of oven-dried plant material in 2
°C, after which the volume was adjusted to 5 ml with demineralised water. Arsenic was determined on a flame atomic spectrophotometer (Perkin Elmer, 2100), coupled to a MHS-10 hydride system. Blanks of reagents and standardised reference material (SRM) were included in all analytical schemes (Buffalo River Sediment, SRM 2704).
2.4.6 – Statistical analysis
Results are the means ± SD of a number of replicates that varied among the experiments. The number of replicates is reported in the caption of each figure. Two ways ANOVA at P ≤ 0.01 or P ≤ 0.05 was used to evaluate the transformation effect (Plant type), the As(III) concentration effect (As conc) and their interaction.
References
Cooper EM, Sims JT, Cunningham SD, Huang JW, Berti WR. Chelate-assisted
phytoextraction of lead from contaminated soils. J. Environ. Qual. 28, 1709-1719, 1999.
Gonzàlez-Castro MJ, Lòpez-Hernàndez J, Simal-Lozano J, Oruna-Concha MJ.
Determination of amino acids in green beans by derivatization with phenylisothiocianate and high-performance liquid chromatography with ultraviolet detection. J. Chrom. Sci. 35:181-185, 1997.
Gustafsson JP. Visual MINTEQ ver. 2.40b KTH, Dept. of Land and Water Resources Engineering, Stockholm, 2006.
Izzo R, Navari-Izzo F, Quartacci MF. Growth and mineral absorption in maize
seedlings as affected by increasing NaCl concentrations. J. Plant Nutr. 14, 687-699, 1991.
Livak KJ, Schmittgen TD. Analysis of relative expression data using real-time
quantitative PCR and the 2-∆∆CT method. Methods 25, 402-408, 2001.
López-Millán AF, Morales F, Abadía A, Abadía J. Effects of iron deficiency on the
composition of the leaf apoplastic fluid and xylem sap in sugar beet. Implications for iron and carbon transport. Plant Physiol. 124, 873-884, 2000.
Metsärinne S, Tuhkanen T, Aksela R. Photodegradation of
ethylenediaminetetraacetic acid (EDTA) and ethylenediamine disuccinic acid (EDDS) within natural UV radiation range. Chemosphere 45, 949-955, 2001.
Mi.P.A.F. (Ministero delle Politiche Agricole e Forestali). Metodi di analisi chimica del suolo. Franco Angeli Editore, Milan, 2000.
Nancharaiah YV, Schwarzenbeck N, Mohan TVK, Narasimhan SV, Wilderer PA, Venugopalan VP. Biodegradation of nitrilotriacetic acid (NTA) and ferric-NTA
complex by aerobic microbial granules. Water Res. 40, 1539-1546, 2006.
Quartacci MF, Cosi E, Navari-Izzo F. Lipids and NADPH-dependent superoxide
production in plasma membrane vesicles from roots of wheat grown under copper deficiency or excess. J. Exp. Bot. 52, 77-84, 2001.
Rauret G, lopez-Sanchez JF, Sahuquillo A, Barahona E, Lachica M, Ure A, . EUR Report 19503 EN, CEC, Brussels, 2000.
Schat H, Ten Bookum WM. Genetic control of copper tolerance in Silene vulagris. Heredity 68, 219-229, 1992.