Assessment of required storage capacity for storing
regulated Onshore wind energy resulting from feed-in
management in Lower Saxony
Master Degree in Energy Engineering
Author:
Muhammad Umer RASHID
Matricola: 875144
Academic Year 2018-2019
Thesis Supervisors:
Engr. Valentin ILEA (Politecnico Di Milano)
Engr.Ann-Kathrin FRIES (TU Clausthal Germany)
Acknowledgement:
This opportunity give me the chance to thank my parents for their love, guidance and support in joyous moments and in difficult times during these years outside my home and country. Without them this day would not have come, and I would not be doing in my life, what I am doing today. I would also like to express my thankfulness to my grandfather for always being a source of inspiration and a mentor whom I have always looked up to for seeking advice and guidance.
A second thank to the Energy Department of Politecnico di Milano and TU Clausthal, with whom I got this opportunity to make my thesis during Erasmus exchange in Germany. This was a very exciting opportunity and I have learned a lot during my stay in Germany.
In particular, I am very grateful to Professor. Valentin Ilea and Advisor in TU Clausthal Ann-Kathrin Fries, for giving me the opportunity to carry out this thesis under their able supervision. I really appreciate for the time they have given me, despite being very busy, and for guiding me at the best of their capabilities whenever required. With their calm, courteous and professional attitude, as well as with great rigor, they have both motivated me a lot during the time of my thesis.
Gracing this moment I want to recognise the efforts of all the people who have been close to me in time here in Milan and Clausthal during my degree and otherwise. My colleagues, classmates and friends for supporting me in the hard time and always being a family away from home.
Table of Contents:
ACKNOWLEDGEMENT: ... III TABLE OF CONTENTS: ... V LIST OF FIGURES ... VII LIST OF TABLES ...VIII
ABSTRACT ... 9
1. PREVIOUS WORK ... 10
2. INTRODUCTION ... 13
1.1. Current energy market situation in Germany ... 15
2.2 Feed-in Management (Einspeisemanagement) ... 20
3. DISTRIBUTION NETWORK IN NORTHERN LOWER SAXONY ... 25
4. REGULATED WIND ENERGY IN LOWER SAXONY... 28
5. METHODOLOGY ... 32
5.1 Selection of grid nodes for analysis ... 33
5.2 Evaluation of wind power at selected grid nodes ... 35
5.3 Time series of wind power considering feed-in management ... 38
5.4 Parameters for storage estimation ... 40
6. STORAGE CAPCITY AND POWER CALCULATION ... 46
7. CONCLUSION ... 49
List of Figures
FIGURE 1.1 OVERVIEW OF RES DISPERSION IN SH IN 2012 SOURCE BASED ON [7] ... 11
FIGURE 2.1SHARE OF ENERGY SOURCES IN GROSS POWER PRODUCTION FOR GERMANY ... 14
FIGURE 2.2 CHALLENGES FACED BY GERMANY UNDER CURRENT SCENARIO ... 16
FIGURE 2.3 ENERGY IMBALANCE BETWEEN NORTH AND SOUTH OF GERMANY SOURCE: AMPRION ... 17
FIGURE 2.4 DIAGRAMMATIC COMPARISON OF NETWORK CAPACITY AND THE INSTALLED CAPACITY ... 18
FIGURE 2.5 STATUS OF TRANSMISSION GRID PLANNING AND DEVELOPMENT IN GERMANY . 19 FIGURE 2.6 SCHEMATIC OVERVIEW OF FEED-IN MANAGEMENT SOURCE: STROMNETZ.BERLIN ... 21
FIGURE 2.7 GROWTH OF WIND GENERATION IN GERMANY SOURCE: THE WIND POWER ... 22
FIGURE 2.8 FEED IN MANAGEMENT ANALYSIS SOURCE: FRAUNHOFER.DE ... 23
FIGURE 3.1 GRID NETWORK ACROSS GERMANY SOURCE: POWERMAP EUROPE ... 26
FIGURE 3.2 OFF-SHORE WIND POWER CONNECTED TO LOWER SAXONY SOURCE: FINO1.DE . 27 FIGURE 4.4.1 WIND POWER ACROSS GERMANY SOURCE: FRAUNHOFER.DE ... 29
FIGURE 4.4.2 WIND TURBINES ACROSS LOWER SAXONY DATA SOURCE: ENERGIEATLAS ... 31
FIGURE 5.1 LOCATION OF SELECTED GRID NODES DATA SOURCE: ENERGIEATLAS ... 34
FIGURE 5.2 POWER CURVE OF THE WIND FARM ... 37
FIGURE 5.3 ACTUAL POWER GENERATION PER HOUR ... 37
FIGURE 5.4 TIME SERIES OF ORIGINAL VS REDUCED POWER ... 39
FIGURE 5.5 TIME SERIES OF FEED-IN MANAGEMENT INTERVALS ... 40
FIGURE 5.6 CHARGING CYCLES OF STORAGE SOURCE [1] ... 41
pag. VIII
List of Tables
TABLE 1 ECONOMIC FIGURE OF 2012 SOURCE [1] ... 12
TABLE 2 FEED-IN MANAGEMENT DURATIONS OF SELECTED GRID NODES ... 34
TABLE 3 COST COMPARISON OF LEAD ACID AND LI-ION FOR RENEWABLE ENERGY ... 44
TABLE 4 ECONOMIC FIGURES FOR 2018 ... 45
TABLE 5 STORAGE RESULTS... 47
Abstract
Germany is currently on the verge of undergoing a major shift from conventional fossil fuel and nuclear power plants in favor of renewable power production which can only be successful if there is parallel enhancement in distribution framework to reinforce a very different kind of energy system. In the federal state Lower Saxony (ND) situated in northwestern Germany, which accounts for a big share in renewable energy, the currently installed capacity of distributed onshore wind power is 11,335.959 Mw with a total of 6,657 operational wind turbines according to the source https://www.thewindpower.net/zones_en_2_260.php.
However the distribution network is not able to deal with growing and fluctuating wind energy during peak wind speed hours. At the moment, this causes network bottlenecks or congestions and requires corrective measures such as Einspeisemanagement (Feed-in management) and Re-dispatchment to tackle the problem when encountered. Focus on only feed-in management was taken into account for the year 2018 for the development of this research.
Einspeisemanagement (Feed-in management) is a specially regulated grid security measure to relieve bottle necks by respective grid operators. As a compensation hundreds and millions of euros are paid by distribution operators to the producers every year due to the under developed grid and if the situation persists this cost is likely to see a rise of 1 billion euros as a result of feed-in management and re-dispatch every year.
The purpose of this thesis was to investigate at which voltage level and at which grid nodes in Lower Saxony feed-in management was used frequently for on-shore wind farms. For this purpose, the publications of the grid operators regarding feed-in management were used. Based on this, three suitable substations were selected for different operating voltage levels considering the longest intervals of feed-in management durations over a year. Analyzing the reduction of regulated wind energy due to feed-in management the necessary storage power and capacity needed to completely store the yield losses was calculated.
After estimation of storage capacity, storage cycles, utilization time and efficiencies were incorporated. A brief economic analysis showed that adoption of storage for storing energy lost as a result of feed-in management has few short term economic benefits, considering the cost of available technology and the achievement of breakeven point. But the storages can we used in future for other RES that might be attached to the grid at the selected grid nodes as grid security feature.
pag. 10
1. Previous work
The use of energy storage systems for reducing the yield losses effecting primarily the renewable energy sources has been studied and analyzed scarcely in the past with the aim of feasibility in the German distribution and transmission network. The studies carried out by the research institutes have been in test phase to study the economic feasibility and the operational harmony with the German grid regulations. A study of similar nature has been carried out with the collaboration of two companies Ecofys Germnay GmbH and Fraunhofer which is a German research organization, on the State of Schleswig-Holstein (SH). SH is situated in the northern most part of Germany.
SH accounts for the highest share of renewable energy sources, recorded at 100% in 2014 [1].Therefore the effect of feed-in management could easily be observed in this state, a smart choice for selection of state was made. The stats showed that in 2012 around 70% of the congestion management in Germany was performed in the this state. Almost 2 to 3% of the renewable power generation In this state was cut down[2][3][4].
An analysis was therefore performed on the high resolution feed-in management data in dimensions of space and time for the historical years. Based on the analysis possible energy storage solutions on the distribution network were discussed to storage the yield losses until 2022 [1]. From the transmission network perspective an analysis on congestion management was carried out for 2025 scenario to evaluate likely gains of newer energy storage solutions[1].
The Power system in SH is currently operated by three main operators[1]
•TenneT-TSOGmbH(>110kV) •E.ON-NetzGmbH(110kV)
• Schleswig-Holstein Netz AG (<110 kV)
The installed scope of the renewable energy sources in the state of SH is 5.2GW which narrates for 7% of the installed capacity in Germany[1]. It was recorded in the year 2013 that 80% of the renewable installed in the state was connected to the network of S-H Netz AG [1]. Due to the fact that this state accounts for a high share of wind generation around 80% of the installed wind power was attached to the medium voltage level [5]. All the three operators, in particular S-H Netz performs feed-in management because most of the wind power is connected to their grid. The figure below gives an idea of the allocation of renewable energy sources in the state recorded in 2012.
The geographical location of SH also makes it quite interesting from the network point of view. The state also provides as a mean for export of energy from Germany to other countries neighboring Germany. So the dynamics of the grid of this state were quite complicated and posed different operating conditions. SH Ecofys and Fraunhofer IWES carried out the research separately on the distribution and the transmission level and studied the potential benefits of implementing different kinds of energy storage systems for reducing yield losses due to curtailment actions.
For the distribution network, the congestion management were classified as permanent and temporary in nature in order to classify possible energy storage applications. Operational requirements of the proposed energy storage application were characterized in order to define distinct case use for gird nodes under consideration. Finally an economic assessment of the possible energy storage solutions were made. Ecofys assessed the characteristics of feed-in management actions applied during recent years with detailed experimental and factual data collected from the network operators functioning across the state. The investigation of curtailment management actions showed that the storage's cycling concentration related to curtailment will below whereas power intensity is likely high for the specific case use for which the systems were proposed.
For the transmission network the analysis was performed on hourly basis simulating the possible renewable energy generation and capacity time series for a 2025 plot [1]. The feed-in management effects on the transmission grid level were evaluated by using a residual load analysis. A comparison of adverse continuing
pag. 12
load against current and future transfer capacities in SH it was obvious an appreciable amount of extra situations for a potential use of storage systems occur with current transfer capacities. The stated situations however could eradicate with the planned expansions of the transmission grid network across the state. This expansion however is facing a lot of backlash due to public protests worsening the situation.
In the next step calculation of the specific annual amount of depreciation (€/kWh) and the resulting power generation costs (€/MWh) for different technologies.
Table 1 economic figure of 2012 source [1]
At the end of the analysis a conclusion was extracted that the economic benefits of reducing RES-E losses do not offset the costs of storage. Hence, application of storage for reducing congestion losses is viably only if part of the investment costs are socialized in one way or another. Finally, the analysis identifies a number of arguments supporting the development of storage technologies and describe framework conditions which could be changed to support storage projects.
2. Introduction
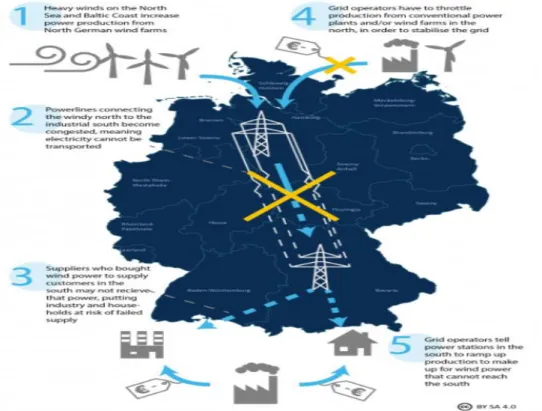
There has been a keen emphasis on Energiewende by successive German governments– which is the country’s dual move away from fossil fuels and nuclear power in favor of an energy system based almost entirely on renewable, is facing grave challenges. To achieve this ambitious target increasing the share of renewable power supply currently at 37% up to 100 % by 2050 [18], the power network systems needs to be enhanced proportionally. But at the moment country’s grid is just not up to the job of making proper use of all the renewable power currently generated. It is considered that Germany cannot meet this ambitious target set by the government without major new cross-country power connections between north and south Germany. Public protest and resistance has been a hurdle in building them over the past several years. An underdeveloped grid is already costing consumers hundreds of millions of euros and the costs are expected to rise to almost 1 billion euros per year if the situation goes on in the same manner [18].
The energy transition’s big success to date has been government’s encouragement for rapid growth of renewable power generation, which covered 34 percent of German power consumption in 2017 – up from 3.2 percent in 1991. But the biggest share i.e. almost 17% of this is from wind power, mainly generated in the country’s north, and in order to make proper use of it, the electricity grid has to be up for the job of transporting it to where it’s needed – in particular the industrial south and west of the country. Right now, the situation is contradictory and that’s putting the brakes on further expanding renewable capacity – which should be accelerating if Germany is to reach its targets for cutting greenhouse gas emissions.
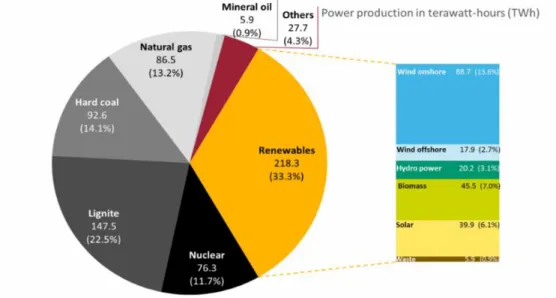
The figure below gives a pictorial view of the significance of wind energy and in particular onshore wind energy in Germany. Of the installed renewable power recorded in year 2017, 13.6% was the due to contribution of onshore wind energy in the national grid. This number was followed by solar energy at 6.1%. Wind farms all across Germany have become more and more common in recent years, due to a good wind corridor resulting from northern winds, and less densely populated lands available in the northern part of the country.
pag. 14
Figure 2.1Share of energy sources in gross power production for Germany source BDEW 2017 estimate
The power imbalances in the system and inflexible renewable power generation is costing the country close to one billion euro each year. Germany’s last nuclear power stations situated in the south is scheduled to shut down over the next five years, therefore and even more essential need for north south connection is required for utilizing the northern wind thousands of kilometres from where it’s produced. It could still be arguable that a more radically decentralised power system could fend off the need for new high-voltage cross-country connections, there is a unanimity between government, the grid regulator and most experts that the infrastructure is needed – and fast. The European Commission is also on the verge of piling on the pressure on Germany, with and eminent threat to split Germany into two power-market bidding zones i.e. north zone and south zone if network congestions aren’t resolved by 2025.
Yet public protests are holding up strong against power lines near residential areas, which have annihilated the expansion projects down in disputes where the new power lines should be located. Also the margin of profits for grid operators – some of them belonging to ailing large utilities such as RWE and E.ON – stand to make from expanding the system have also raised suspicion over whether development on this scale is really necessary in the current situation or not. Analyst are of the opinion that It’s not just the big transmission lines that need major development, the vast and long-overlooked network of low and medium
voltage distribution grid must be updated in the coming years for a modern, interconnected energy system that incorporates storage capacity, electric cars and as well as fluctuating renewable power generation.
Beyond all the concerns and hindrance coming In the way of grid expansion , it is still unclear whether more power lines than currently planned will be necessary as more and more renewable power is generated, or if existing capacities might be sufficient if better utilised by a “smart” automated system. But task at hand is to tackle the issue on short term basis , for that a lot of solutions are being looked at accompanying some necessary grid expansions to cut short as much as possible the huge amount being paid currently as a result of feed-in management and re-dispatch of energy across Germany. The attachment of storage systems with the grid nodes is a also under discussion to using the yield losses resulting from fluctuating renewable energy and make the grid more stable based on supply and demand of energy. Speaking of now a lot of energy is currently unable to enter the grid due to feed-in management and goes waste. It is of key importance to save as much of that energy as possible to be used at a later stage when the grid limit is on a lower side able to take some extra energy i.e. in time of low wind speed.
1.1. Current energy market situation in Germany
In 2017, 33.3 percent of power production in Germany was from renewable sources – 2.7 percent offshore wind, 13.5 percent onshore wind, and 6.1 percent photovoltaic (PV) solar. namely Schleswig-Holstein, Lower Saxony, Mecklenburg Vorpommern, Brandenburg and Saxony-Anhalt accounts for over two thirds of Germany’s onshore wind capacity is installed in the northern and north-eastern states. Meanwhile, large metropolitan areas and power-hungry industry are largely located in the south and west of the country.
Bavarian state government warns that it will face a 3-gigawatt (GW) capacity shortfall once the last nuclear power plant has gone offline in 2023 and the northern states of Schleswig-Holstein and Lower Saxony produces more power than it can use itself, while the. There will be surplus power in the windy north and an electricity deficit in the industrial south.
pag. 16
Figure 2.2 Challenges faced by Germany under current scenario Source:cleanenergywire.org
To carry so much power the 35,000 km lines currently linking north south of the country were never intended to carry so much load. Specially on windy days, large volumes of cheap renewable wind power flood the electricity market, pushing down the wholesale energy price and favouring customers in southern Germany (and Austria – as the two countries are currently part of a joint power market) to buy from north. But the wind power cannot be transported to these interested customers, so grid operators must quickly instruct the producers in the south to generate power and pay above-market rates for it to balance the market and avoid the grid instability. Between 2014 and 2015 the volume of these “re-dispatch” measures rose more than times compared to previous years. At the same time, renewable power production in the north has to be curtailed because it cannot be transported anywhere. This situation is represented pictorially in the following figure.
Figure 2.3 Energy imbalance between north and south of Germany source: AMPRION
There are two solutions currently under play to tackle these bottle necks:
• Re-dispatch: in a situation of oversupply, the grid operator forces a power
station to lower production in a region, and directs another plant in a low-production region to increase the low-production.
• Feed-in management: If too much renewable energy in our network flows through weather or technology, it must be regulated and cut short to avoid bottle necks. This “feed-in management” results in compensation costs because wind farms must be paid when their turbines are switched off.
This concept is represented in a better way with the diagram below. Whenever the network transportation capacity falls short of the generated power , a grey area if formed called congestion. This can compromise the security of grid and needs to be dealt with either of the two solutions described above.
pag. 18
Figure 2.4 diagrammatic comparison of network capacity and the installed capacity Source: Ecofys
Re-dispatch are also caused due to high amounts of conventional power blocking the grid and causing bottle necks, and rare events such as an increase in electricity demand in the neighbouring countries like France, Italy, Austria and/or Switzerland due to reduced water levels in reservoirs of hydro power plants or safety shut-downs of nuclear power plants.
The compensation costs accounted as a result of Re-dispatch and feed-in management costs up to 880 million euros in 2015. They reduced to 593 million euros in 2016 as a result of less windy year – but are expected to have risen again in 2017. In the northern state of Schleswig-Holstein alone, where 72.3 percent of feed-in management measures were recorded in 2016, these costs amounted to 273 million euros according to an estimate.
As a result of grid stability measures Transmission grid operators calculated that feed in management measures were required 329 days last year. Completion of the Thüringer Strombrücke line between the state of Saxony-Anhalt and southern Germany have brought some relief to the transmission grid zone operated by 50Hertz in the East of Germany, resulting in lowered re-dispatch costs in 2017. But other bottlenecks still remain abundantly, and will likely result in costs rise to over 1 billion euros for re-dispatch and feed-in management every year.
The proposal agreed on by transmission grid operators and federal government of Germany is accelerated development of more north-south power lines. By 2025 a total of 4,650 kilometres of new transmission lines are expected to be ready, including four north-south connections built as direct-current high-voltage lines.
So far, 900 kilometres have already been built. The figure below represents the status of transmission grid under planned and the ones already developed.
Figure 2.5 Status of transmission grid planning and development in Germany Source: Bundesnetzagentur 2018.
In Germany, on average it takes around 10 years for a power line to get through planning and commissioning phase. General opinion is of growth and progress, but as soon as it effects the people and their surrounding they don’t opt for change and development. The state governments are not also always successful in convincing the people that the development if for their own benefit. Protests are held for the plan of passing high tension wires near villages, suggesting a measure to install conventional power sources in the south to meet the need. A lot of similar political agendas and public protests have been a hindrance in the German vision of enhancing renewable energy share in central grid and enhancing the network capacity to transport it where it’s needed and when its needed.
pag. 20
2.2 Feed-in Management (Einspeisemanagement)
Abbreviated term Einspeisemanagement also referred to Eisman or Eismann, is the regulation made by the network operators over the transmission of electricity from renewable energy and CHP. This forced regulation of the feed becomes necessary when the individual sections of a distribution or transmission system are overloaded and as a result a bottle neck threatens the security of supply. Again and again, the electricity network therefore reaches its capacity limits. This means that the electricity generated by EEG systems can no longer be removed at some point.
In this case, the plants are regulated. Temporarily feed of the plants is reduced in terms of the generated electricity or in extreme cases not in the network. This action is called power management. Depending on the situation, 60, 30, percent of the actual production is reduced and the remaining is fed in the grid. This prevents the power management, generation plants are completely off and protects parts of the network such as overhead power lines or transformers against overload. The power management enables the optimal use of the networks. Once again normal single dining conditions, production line feeds back without restrictions.
Control systems automatically calculate which systems must reduce their feed-in power. In this case, sends a signal to the plants. The plants are then prompted their Injectability, depending on the requirement, down to 40 or in extreme cases zero percent where by all the power is cut from the plant. We therefore ensure that at all times as much electricity as possible is fed from renewable energy sources. The critical power situation has ended, the system feeds back without restrictions.
In order to understand the operation of feed-in management a schematic overview is shown in the picture below. At 1 the transmission network operator is constantly observing the network based on balancing values. The bottle neck of the grid is set as benchmark and whenever the production feed-in power exceeds the bottle neck limit of the network a signal to the distribution operator is sent at 2. The distribution network operator performs the feed-in management with a priority given to the renewable sources. The conventional power producers are only allowed a feed-in to stabilize the grid. At 3 the action of feed-in management is performed with a preset percentage of step reduction carried out in the feed-in. The power production units attached at 4 are then compensated as per market rate depending on the duration of feed-in management duration and the percentage reduction.
The power grids are designed to transport any locally generated electricity. Currently, the number of production plants is growing but faster than the expansion of network for a larger energy transport. If then strong wind energy or technical circumstances provide for a lot of renewable energy, sometimes selectively simply too much can push it into the net. In such a case the legislator has exceptionally authorized network to regulate the power generated with a capacity of greater than 100 kilowatts of renewable energy or combined heat and power. This however only if this current network capacity within the scope of the network would be overloaded.
German power network that is in turn integrated into a European power network. Within the current network occurring bottlenecks regulate network technically and commercially. The upstream high - and high-voltage grids operate comes to bottlenecks in upstream networks, these operators may require that low voltage grid operators decentralized production lines in its network also with the inclusion of power management measure.
In the context of the EEG, the power management (EinsMan) is still of great importance. Network operators are obliged to inform the operator no later than on the day before, otherwise immediately of expected time, scope, and duration of the scheme according to EEG 2017 § 14. It is important that the priority for electricity from renewable energy sources is maintained (just as for electricity from coal mine gas and Combined heat and power), if not other systems on the network
pag. 22
must be for reasons of system security. Operators of regenerative systems, which are still throttled receive a financial compensation under the hardship scheme in section 15 of the Act. The EinsMan under the hardship scheme in EEG 2017 are affected operators of new equipment for 95% of the lost revenue to compensate (was the compensation in full before 2012). From more than 1% of lost revenue each year, the plant operator will receive 100% compensation. The cost can kill the operators on the network charges, but only, if they have exhausted all measures to increase network capacity.
Depending on the feed-in power, different techniques are used, remotely transmit the signal to reduce the supply. The technology used to implement the reduction depends on the performance of the system. Learn which technology you use is, we individually after applying for your network connection.
Operators receive financial compensation, if the operator reduces the feed-in power due to a power shortage or to expose. The compensation covers 95 percent of the lost revenue. To get additional expenses of which the savings will be deducted. However: exceed the lost revenue in one year a percent of annual revenues, 100 percent be compensated from then on. Exceptions apply for investment in direct marketing.
Figure 2.7 Growth of wind generation in Germany source: The wind power
The graph above taken from the source thewindpower.net for Germany shows how over the period of time, wind power production has boomed in the country.
He year 2017 marks the biggest growth in terms of installed wind capacity across the country. With greater wind generation the problem of losses due to limited transmission capacity were rising.
The comparison chart drawn by Fraunhofer further makes an analysis of the previous years in Germany. Taking a close look at the year 2016 and 2015, a notice in drop of losses can be seen represented by the green bar. Presumably this was due to a low wind year leading to lower generation of wind power. The analysis further stated that 93.5% of the congestion management occurred on the generated wind energy, with a concentration of 94% across the northern federal states of Germany.
Thus from the economic point of view as well as society prospective, it is essential that the yield losses Germany is facing at the moment needs to be cut short as much as possible also leading to lesser compensation costs. A lot of solutions are under discussion at the moment between the government, network operators, experts and power producers. It is of a general opinion that the ultimate solution would be grid expansion to allow more energy to flow through it. But it is a long
pag. 24
process facing many legal legislations and public protests. A quick solution in the current scenario can be useful saving energy and cutting cost. Among these solutions, energy storage systems is the most discussed solution.
Seeing the nature of feed-in managements from the graph discussed above, it can be seen that there is a lot of variation in the trend, and the natural source causing excessive generation is beyond the control of mankind. This causes uncertain pattern in the amount of feed-in management actions occurring over the course of different years and makes the situation quite uncertain in terms of storage system application. Each grid node of the transmission system has different rated power attached and also geographical locations plays a key role for the natural source impact i.e. wind speed and solar radiation intensity.
3.
Distribution network in Northern Lower
Saxony
Germany’s power grid ranks among the most reliable in the world, despite an increasing share of fluctuating renewable energy sources. The government has made the extension of the grid a priority to maintain this high level of resilience. Germany is experiencing a continuous growth in renewable power generation, causing an upheaval in the traditional supply chain for electricity. In 2017, 33.3 percent of all generated power came from renewable sources, mostly from biomass plants and volatile sources, such as wind and solar PV. The grid system, which was built to deliver electricity from large power stations (via the transmission network) to some large (industries) but mostly small consumers (households - via the distribution network) is being upended by hundreds of thousands of small renewables installations (over 1.5 million solar PV installations and 30,000 wind turbines), which are feeding into the distribution grid at lots of decentralised locations. Keeping the grid stable during times of high influx of variable renewables and organising the interaction between the transmission and distribution grids are among the challenges faced by Germany’s grid operators.
The distribution grid brings power directly to consumers and is operated by a large number of regional and municipal operators (887, as of November 2016). The total length of Germany’s distribution grid is 1,679,000 kilometres. It transmits power at three different voltage levels:
• The high voltage grid (approx. 77,000 km) transmits power at 60 kV to 220 kV and is used for the primary distribution of electricity to transformer substations in population centers or to large, energy-intensive companies in the industrial sector.
• The medium voltage grid (approx. 479,000 km) transmits power at 6 kV to 60 kV to smaller regional substations and larger consumers, such as factories or hospitals.
• The low voltage grid (approx. 1,123,000 km) transmits power at 230 V or 400 V to private households and other smaller private consumers.
pag. 26
The distribution system in Northern Lower Saxony is typified by three major network operators which are allocated to different voltage levels:
•TenneTTSOGmbH(220kV-380kV), •AvaconGmbH(110kV-220kV) •EWE-NETZ(<110kV).
With a total installed capacity of 11,335 MW and 6,657 [10] operational wind turbines, Lower Saxony accounts for the biggest share in terms of installed wind power when compared to other states. This is mainly due to the high wind corridor coming from the north of Germany and less densely populated land. Adding more to the importance of state of Lower Saxony is the fact that even with such large production of wind energy the share in net electrical energy consumption is only 24.95% of entire Germany, which is considerably low. So the huge amount of cheap renewable energy needs to be transported somewhere where it can utilized beneficially. The figure below shows the grid network across Germany with different voltage levels an yellow dots representing major generating plants.
Figure 3.1 Grid network across Germany source: Powermap Europe
Due to the major share of wind power in German network, around 80% of the generation is connected to the medium voltage level of the distribution operators. The three listed major distribution operators frequently perform congestion
management actions due to network congestions on the instructions of network operators. Chiefly Avacon cut short the distributed power units, because most wind power units are connected to its network. It is also interesting to note that out of total power generation in Germany Lower Saxony accounts for only 25% of consumption.
The distribution grid can suffer from bottlenecks just as much as the transmission grid, but a major grid expansion is not the solution. However, with 98 percent of the renewable power generators connected to the distribution grid, there is a clear need to update the infrastructure to cope with the increasingly bi-directional flow of power. But dealing with prosumers (households that not only consume power from the grid but also feed electricity into it from their rooftop solar PV panels) requires the installation of new (smart) technology. This involves investment in smart meters or local distribution substations, more accurate weather forecasting equipment that inform the grid management, and a range of new software – all to make the grid more transparent and controllable from afar. The lower the voltage level, the less information and communication technology has been installed, simply because it wasn’t needed before prosumers entered the market.
Along with covering vast onshore wind farm across Lower Saxony , the major off-shore wind farms of Germany are connected to the grid of Lower Saxony further signifying the critical nature of the grid across the state. With so many wind farm producing fluctuating energy with the wind speed all the grid operators have to perform feed-in management and compensate the producers.
pag. 28
4. Regulated wind energy in Lower Saxony
Since the purpose of this thesis was considering primarily onshore wind power which is a paramount pillar of Germany’s transition away from high-carbon electricity generation goal in years to come. Germany has been the torch bearer in the field of installing onshore wind power capacity in Europe for many years. With a gross expansion of about 5,300 megawatts (MW), 2017 saw the strongest capacity growth ever. But expansion slowed down by more than half in 2018, when only 2,402 MW were added [8].Lower Saxony defends its position as the German state with the most onshore capacity (currently 10,582 MW). That’s more than a fifth of Germany’s overall onshore wind power capacity. In second place is Schleswig-Holstein with 6,863 MW, closely followed by Brandenburg with 6,794 MW. Lower Saxony was again also the state that added the most new capacity year-on-year, accounting for almost 27% of all of the onshore capacity constructed in Germany last year. North Rhine-Westphalia also created a large amount of new capacity last year. It accounted for 16 per cent of Germany’s new onshore capacity, putting it in second place. There are now 3,630 wind-powered installations operating in North-Rhine Westphalia, with a combined capacity of almost 5,500 MW. When it comes to total installed onshore capacity, North-Rhine Westphalia is now in fourth place, relegating Saxony-Anhalt into fifth.
In 2018, onshore wind power fed about 89.5 terrawatt hours (TWh) of electricity in the German national grid. By the end of 2018, a total of 29,213 onshore turbines were in operational and attached to the grid across the country [8]. With a total recorded capacity of 52,931 MW, onshore wind turbines generated almost 15 % of Germany's power mix in 2018, making them the single most important renewable energy source by far[8]. Average turbines generated up to 3 million kWh annually, equaling the consumption of 1,000 average households according to an estimate.
Majority of the wind turbines so far have been commissioned in northern Germany, where favourable wind conditions also aided to flourish the industry’s early development. Among these areas Lower Saxony leads the production from wind power with a total of 11,225 MW and the most number of wind turbines in any state. With the closure of the sole nuclear plant in the south of the country this number had to be increased even further to meet the demand.
The conditions are quite favourable for wind power production in the north of Germany particularly in the province of Lower Saxony , because of the terrain, strong northern wind with good average recorded wind speed during most of the year and less densely populated land. Because the government has also encouraged several wind turbine manufacturers in recent years to add more turbines it is not wrong to consider that wind power is becoming a key source in terms of power production across Germany in recent years.
Figure 4.4.1 Wind Power across Germany source: fraunhofer.de
Compared to previous years the power out evolved by 4 percent in the year 2018. Industry magazine Wind Journal stated that, 2018 was accounted for peak wind power feed-in particularly on 8 December, when wind turbines running at maximum rated capacity of 44,730 MW [8], fed into the grid. This was more than three times as much as the combined capacity of all of the country’s active nuclear plants at that time [8].
Germany normally see’s peak wind power generation during winters, which acts as an equity for lower power generation from solar power plants during that time. But the issue of wind power’s fluctuating generating nature also becomes more prominent during the colder and darker months of the year, when the majority of
pag. 30
Germany’s power thirst still has to be covered by conventional power plants due to their stable generating nature. A period of still days with no wind recorded wind speed - “Dunkelflaute” as called in German - depicts that besides few solar hours typical for the winter months, this phase of the year can bring the wind power output as low as 1,000 MW for an entire day.
Apart from the transformation to tenders, the federal government also extended support to an annual onshore expansion capacity of 2,800 MW until 2019 [8] and dedicated their efforts to slowly expand this “expansion corridor” deciding to carry on this work until 2019. 2019 will also be the first year in which only installations that have won an auction receive support.
Every year, some onshore wind-powered installations are of course dismantled or decommissioned. In 2017, this happened exactlty 387 times. There are various reasons why this may happen. Installations may have reached the end of their operating life or they may be subject to repowering. This is a process that involves existing installations being replaced with more modern ones that operate in the same location, but can generate much more electricity in a more efficient way. This can be seen from the average performance of old and new installations: the installations that have been dismantled had an average capacity of 1,200 kilowatts, compared to more than 3,000 for the new ones. In 2015, 315 installations began their operation.
These figures for 2017 were provided by German WindGuard GmbH, the company commissioned by Arbeitsgemeinschaft Offshore-Windenergie, the WindEnergie association, the Offshore Wind Energy Foundation, the WAB agency, and VDMA Power Systems to provide data on Germany’s on and offshore capacity every six months. Furthermore, the Onshore Wind Energy Agency used the register of facilities populated by the Bundesnetzagentur to find out about the number of wind turbines that were newly installed in 2017. Whilst the results of the two studies are close, the slightly different methods used have resulted in minor differences in the findings.
To identify location of each wind turbine across Lower Saxony, regulated open source data from Energie-Atlas Niedersachsen was taken. To Visually analyze the location, manufacturer, rated power, swept area and rotor diameter of each wind turbine a specialized geographical mapping software “ArcGIS” was used. The file containing the data was reverified from German ministry of energy and power.
The figure below was taken during the process and as it can be seen that a good visual representation of each wind turbine across lower Saxony is seen. Most of the wind turbines were clustered in form of wind parks in the north western coastal line , having a good average wind speed. Also seen in the figure, are two off shore wind parks situated in the north sea. By looking at the metrological date from the German weather service which is federal authority of the federal ministry of transport and digital infrastructure was noticed a significantly greater wind corridor in the north western coastal region of the state.
pag. 32
5. Methodology
The Methodology used to estimate the battery power and capacity for each specific grid node consisted of several steps. This procedure is explained with the help of flow chart below.
The algorithm required for the estimation of required storage capacity at each selected grid node connected to different voltage level required a different approach. Since the wind speeds varied significantly at each location and so did the power produced. The feed-in management data for the selected grid nodes also depended on the grid operator and the situation of the grid. There a different solution was suggested for each node and then observed economically, weather the solution is feasible or not.
The methodology is explained in detail theoretically in the sections below:
Selection of grid nodes based on
feed-in management time
wind speed per hour at selected grid nodes
from the weather stations
wind power evaluated Power= 0.5 x ρ x A x
Cp x V3 x Ng x Nb
Using MATLAB code for implimenting feed-in management time over production Considering battery efficiency and SOC
range Considering discharging time and
network capacity
Possible battery type at the selected grid
node
Economic investment required at the selected grid node
The solution suggested is economically feasible
5.1 Selection of grid nodes for analysis
The selection of grid nodes for development of this thesis was based on the criteria of maximum feed-in management duruation during a year. The year 2018 was taken as a sample year. The examined system level was distribution side of the network. Since most onshore wind turbines were connected to the network of meidum and low voltage levels , Avacon and EWE-Netz were taken under considration. As noticed most of the offshore wind turbines were connected to Tennet, it was ignored as operator since the focus of the research was pivoted around onshore wind turbines.
Based on the open source feed-in management or einspeisemanagement data from the selected grid operator’s websites, three grid nodes belonging to each operator were selected based on longest aggregated feed-in management duration for the year 2018. Each of these grid nodes are named after the city or town in which they are located. The three selected grid nodes based on feed-in management durations for the year 2018 were:
A diversty of data set for the purpose of reseach was taken under consideration, due to the fact that for specific case use the operational requirements of energy storage can vary. The grid nodes are geographically also situated in different average wind speed corridores. The intensity of congestion management occuring at the selected grid nodes was recorded highest during 2018. The congestion management data comprised of start time and date, end time and date and the precentage reduction in the power before being fed into the network at the selected gird node. It was interestingly noticed at a reduction of either 30 present or 60 precent was recorded in publised data based on the situation. Considering the fact that, a big chunk of power production in lower saxony was from onshore wind other renewable sources were considerably small in terms of generation capacity and were ignored. So , the feed-in management affected greatly the wind turbines.
(110-220 kV)
1. Emden
2. Damsum
3. Schwittersum
(< 110kV)
1. Burhafe
2. Manslagt
3. Carolinensiel
pag. 34
GRID NODE RATED
POWER MW AGGREGATED FEED-IN DURATION 2018 LONGEST RECORDED FEED-IN FEED-INTERVAL 2018 Burhafe 38.05 260:42 31:31 manslagt 8.06 159:22 13:02 Carolinensiel 14.24 156:18 27:23 Emden 187.43 347:50 82:31 Damsum 39.05 159:15 31:31 Schwittersum 40.2 98:19 37:45
Table 2 Feed-in management durations of selected grid nodes
As the table shows, the selected grid nodes were sorted out based on aggregated longest feed-in management duration during the year 2018. The locations varied depending on the situation of the grid in the respecttive region. Among these grid nodes Emden, located in the western coastal region of Germnay had the most number of wind turbines connected to it. This was verified with the help of ArcGIS as seen in the fure below. It was assumed that the wind farm situated close to the grid node was conencted to that grid node because the data on actual grid connecttion point was not known.
Figure 5.1 Location of selected Grid nodes data source: Energieatlas Emden
Manslagt Schwittersum Carolinensiel
Damsum Burhafe
5.2 Evaluation of wind power at selected grid nodes
After selection of grid nodes at two voltage levels, the next step was to find the generated wind energy attached to the nodes. For this purpose few pre-requisite values were required before the calculation could be made.
1. Average wind speed in m/s: The most important data for the evaluation of generated wind power by the turbines connected to the selected grid nodes was wind speed data. Open source data from The Deutscher Wetterdienst or DWD [8] was taken for the weather stations close to the selected grid nodes. The average wind speeds in m/s for the year 2018 were taken with a step of one hour. It was assumed at the wind turbines worked under average wind speed recorded by the respected weather station. Overall, 2018 was a good year in terms of recorded wind speed.
2. Turbine manufacturer: The turbine manufacturer details were taken from the file from Energie Atlas Niedersachsen used to visually see where each onshore turbine Is located in Lower Saxony. For majority of the cases, manufacturer name and turbine model code was stated in the given file. For the cases in which the rotor diameter was missing in the file, manufacturer code and information was used for getting the rotor diameter in meters from the website thewindpower.net.
3. Rotor Diameter in meters: In the data of Energie Atlas Niedersachsen, for some turbines connected to the selected grid node the rotor diameter was given. For the missing values the manufacturer name and rated power was taken in as reference and the rotor diameter was search from manufacturer websites.
4. Rotor swept area: The swept area of the rotor was calculated from the rotor diameter information for each turbine using the formula π r2 with
pag. 36
5. Efficiency values: The gearbox efficiency was taken was 98% and the organic electric efficiency was assumed as 97%. The assumption of these values were rather optimistic considering the fact turbines of different nature and different components were used at different locations. So in order to consider a value for all, these values were assumed.
6. Coefficient of power for wind turbine: This coefficient accounts for how efficiently the installed wind turbine converts the wind energy in the air flowing past the rotor blades into electrical energy to be fed in the grid. The maximum of this efficiency is known as Betz limit with a value of 59.3%. The value for this research for real case scenarios was taken as 38.5%. Since some turbines in the selected grid nodes were more efficient and some were less. The stated value was considered as mean value of most turbines connected to the selected grid node.
7. Wind power in kW at grid node: With all the above information the theoretical power produced per hour for turbines of different diameter attached to the gird node was evaluated separately. The combined sum of these powers gave the power generated per hour in kW at the selected grid node. Wind power was assumed constant during an hour of generation. As per the power curve of the turbine, it was noted that during the high wind speed, the wind turbine operated at the rated power thus generating the maximum output using the formula stated below.
𝑃 =𝜌
2∙ 𝐴 ∙ 𝐶𝑝∙ 𝑉
3∙ 𝑁 𝑔∙ 𝑁𝑏
As an example , shown below is the visual representation of the grid node “Emden”. Taking a look at the power curve of the selected grid nodes for the entire 2018 year , it was noticed that during high wind speeds, the wind farm generated theoretical power as much as rated power. Rated power was generated at around 13 m/s which was roughly the maximum or rated wind speed recorded throughout the year. During the durations of recorded wind speed of 13 m/s or more the turbine produced rated power, or operated at maximum output.
Figure 5.2 Power curve of the wind farm
The time series graph shown below represents the wind power variation per hour the period of year 2018. Corresponding to the high wind speeds in the first quarter of the year, greater wind power generation is observed and the wind park produces up to rated power.
Figure 5.3 Actual power generation per hour 0 20 40 60 80 100 120 140 160 180 200 0 2 4 6 8 10 12 14 16 18 W ind P o wer MW Wind speed m/s
Annual Power curve
0 20 40 60 80 100 120 140 160 180 200 1 /0 1 /2 01 8 0 0: 00 1 /1 2 /2 01 8 1 0: 00 1 /2 3 /2 01 8 2 0: 00 2/ 04 /2 01 8 06 :0 0 2/ 15 /2 01 8 16 :0 0 2 /2 7 /2 01 8 0 2: 00 3 /1 0 /2 01 8 1 2: 00 3 /2 1 /2 01 8 2 2: 00 4 /0 2 /2 01 8 0 8: 00 4 /1 3 /2 01 8 1 8: 00 4 /2 5 /2 01 8 0 4: 00 5 /0 6 /2 01 8 1 4: 00 5 /1 8 /2 01 8 0 0: 00 5 /2 9 /2 01 8 1 0: 00 6 /0 9 /2 01 8 2 0: 00 6 /2 1 /2 01 8 0 6: 00 7 /0 2 /2 01 8 1 6: 00 7/ 14 /2 01 8 02 :0 0 7/ 25 /2 01 8 12 :0 0 8 /0 5 /2 01 8 2 2: 00 8 /1 7 /2 01 8 0 8: 00 8 /2 8 /2 01 8 1 8: 00 9 /0 9 /2 01 8 0 4: 00 9 /2 0 /2 01 8 1 4: 00 1 0 /0 2 /2 01 8 0 0: 00 1 0 /1 3 /2 01 8 1 0: 00 1 0 /2 4 /2 01 8 2 0: 00 1 1 /0 5 /2 01 8 0 6: 00 1 1 /1 6 /2 01 8 1 6: 00 1 1 /2 8 /2 01 8 0 2: 00 1 2 /0 9 /2 01 8 1 2: 00 12 /2 0/ 20 18 2 2: 00 W ind P o wer MW
Time with 1 hour step
pag. 38
An evaluation of similar nature was carried out for all the six selected grid nodes. The first quarter of 2018 was recorded as high wind speed time and therefore powers up to rated powers were recorded for each grid node.
The representation of results in form of time series graph gave an idea at what time of the year, peak power production has occurred and the congestion management correspondingly would have acted to lessen the feed-in power by a certain percentage acting a mean to ease off the network congestion.
The mathematical representation for evaluating wind power(P) is given by: 𝑃 =𝜌 2∙ 𝐴 ∙ 𝐶𝑝∙ 𝑉 3∙ 𝑁 𝑔∙ 𝑁𝑏 where, 𝜌 = Density of air in kg/m3 𝐴 = Swept area of rotor (m2)
𝐶𝑝 = Coefficient of performance taken as 0.358 for the analysis 𝑉3 = wind velocity or wind speed (m/s)
𝑁𝑔 = Generator conversion efficiency taken as 0.98 for the analysis
𝑁𝑏 = Gear box bearing efficiency taken as 0.99 for the analysis
5.3 Time series of wind power considering feed-in
management
Feed-in management data was taken from the website of grid operators Avacon and EWE-Netz for the respective selected grid nodes at different voltage levels. To observe the impact of feed-in management durations and percentage reductions on the wind power generation data a MATLAB code was developed. The purpose of the code was to overlap the feed-in management actions on the original generated production before being fed in the grid. Because the feed-in management data was per minute and the wind power generation was per hour, to make the x-axis of time linear for graphical representation the code was considered to access the data and print the values of power production from wind
turbines per minute. Thus making the entries on x-axis to be 525,600. So with the code power per minute was achieved. The graph shown below is for grid node “Emden”. The blue lines represent the original power produced by the wind turbines attached to the selected grid node. The orange lines however represent the power being fed in the grid after performing feed-in management at grid distribution network. The difference between these two lines represents the yield losses in MW per minute.
Figure 5.4 Time series of original vs reduced power
A zoomed in view of the analysis obtained from this code, focused only on the feed-in management intervals is given below for the grid node “Emden”. As seen in the initial development phase of the graphical results, during peak production hours, the power coming from the wind turbines connected to the grid was reduced by 60 percent. So a huge power was being cut down during this feed-in management interval in order to stabilize the grid and maintain its integrity. The longest interval recorded was 82 hours with a reduction of 60 percent in the original production. The feed-in management in 2018 at the discusses grid node occurred for about 5 percent during the entire 2018 year. The graph below shows only that 5 percent that was of key importance resulting in yield losses.
pag. 40
Figure 5.5 Time series of feed-in management intervals
This analysis of feed-in management on top of original power production formed basis for calculation of battery power and capacity to be designed at each selected grid node. This also showed graphically how much and when the battery needs to be discharged, for another charging cycle to store next feed-in management interval. An analysis of similar nature was done for each of the six selected grid nodes for different voltage levels. The percentage reductions and feed-in intervals varied a lot as compared to other grid nodes, highlighting the fact that a storage of different nature has to be designed for each selected grid node.
5.4 Parameters for storage estimation
Based on the approach of specific case use to reduce yield losses, certain parameters were taken under consideration when estimating the storage. The operational requirement of the storage were linked to these parameters.
1. Operational cycles:
One of the key parameter to draft an energy storage is to identify the extent or range of operational cycles. This is of key importance because it impacts the level of utilization. As the data of the feed-in management from the operator depicts, that several feed-In management actions occurred in a consecutive manner which short intervals between them. Also emphasizing on the fact that the storage once charged, needs adequate time and network capacity to
discharge its power back to the grid to be recharged again. Keeping in mind these concerns, several feed-in management actions that were close enough were aggregated into a single charging cycle. The figure below represents the schematic view of this consideration for the grid node “Manslagt” where the feed-in managements occurring during one day after short intervals were combined in one charging cycle.
Figure 5.6 charging cycles of storage source [1]
Another factor that depended on the charging cycles was the power conversion rate. The power conversion rate effects the design of the storage system for the specific case use. The calculation was based on the estimated maximal power flows at the investigated substation during the congestion management action.
2. Battery efficiency and SOC:
A rather logical supposition was made considering the discharging of storage system. The gird bottleneck limit was not available as open source data due to sensitivity, so a logical supposition had to me made to consider the discharging and charging of the storage system selected. It was considered to assume that for discharging at least 24 hours duration will be available until next charging cycle and the grid capacity will be assumed sufficient enough to take the discharge from the battery. The battery efficiency was considered as 90 percent taking into account that different nature of storage system has to be used for different grid node. This was rather too simplistic approach and hence a tighter band for charging and discharging was considered according to the intermediate green line as shown in the graph below for the SOC of battery. With this approach the battery is charged up to 85% of its maximum capacity
pag. 42
and then discharged to as low as 25%. With this tighter band the operational life of expensive battery solution can be significantly enhanced.
Figure 5.8 Capacity loss as a function of charge and discharge bandwidth
source: Battery university
With this assumption, the energy actually stored in the battery is 90 percent of the yield losses produced due to feed-in management action at a grid node. Then following the SoC range, that energy is stored in the battery.
3. Duration of utilization:
Other than the operational cycles of storage for a specific case use, the potential load time was another key parameter for storage estimation. The feed-in management durations published for a selected grid node was considered as a simple yet quite reasonable approximation for the determination of duration of utilization.
4. Nature of storage:
Renewable energy sources such as wind and sun do not provide a steady stream of energy, nor do they always harmonize with user demand. Large energy storage systems (ESS) called load leveling or grid storage batteries are needed to provide a seamless supply of energy.
Storing energy to supply peak shaving power is not new. Hydroelectric power stations use excess electricity to pump water back up to the reservoir at night for use the next day. With an efficiency factor of 70–85 percent, pumped hydro is easier to manage than adjusting the generators to the exact power need. Pumping compressed air into large underground cavities and underwater balloons are also being used to store energy.
Flywheels also serve as energy storage. Large electric motors rev up one-ton flywheels when excess energy is available to supply brief energy deficiencies. High-speed flywheels spin at over 30,000 rpm on magnetic bearings in a vacuum chamber. Electric motors/generators with permanent magnets charge and discharge the kinetic energy on demand.
Modern flywheels replace steel with carbon fibers to withstand higher rotations of up to 60,000 rpm. Energy increases by the square of speed, providing four times the power at a reduced weight. Should the flywheel fail, the housing prevents shrapnel from escaping.
Using flywheels to store kinetic energy is not new. In the 1940s and 1950s, city busses in Switzerland were powered by flywheels. An electric motor would spin a 3-ton flywheel to 3,000 rpm in 3 minutes. Turning into a generator, the motor would then transform the energy back into electricity. Each charge would yield for 6km (3.75mi) on a flat road. The bus was pollution-free but the gyroscope action resisted changing direction on a windy road.
Taken a brief look at the historical date of feed-in management data for the selected grid nodes it was observed that the feed-in management actions over the period of time were vacillate in certain locations with time and they developed in another way when compared to other grid nodes over time. Load
leveling is gravitating towards Li-ion because of small footprint, low maintenance and long life. Li-ion does not suffer from sulfation as lead acid does when not fully charged periodically. This can be a major drawback with installations when demand exceeds supply. Li-ion also has the benefit of being light-weight and semi-portable for installations in remote locations. The negatives of Li-ion are its high price and low performance at cold temperature. A further drawback is the inability to charge below freezing.
Li-ion has come down in price and Table 1 provides a cost comparison with lead acid for grid storage applications. Although the initial price of Li-ion is higher than lead acid, the cost per cycle is lower in deep-cycle applications. Li-ion is said to gain in market share but lead acid will keep its stronghold. Li-Li-ion has a higher initial cost but is lower on the cost per cycle.
pag. 44
Lead acid Li-Ion
Battery cost 17,816 € 46321.60 €
Life span 500 cycles at 50% DoD 1,900 cycles at 90% DoD
Cost per cycle 35.6 € 24.9 €
Table 3 Cost comparison of lead acid and Li-ion for renewable energy
The energy output of a large wind turbine is 1 MW or more, the biggest units have grown to 10MW. Several turbines form a wind farm that produces 30-300MW. TO fathom a megawatt, 1MW feeds 50 houses or a superstore. Not all renewable energy systems include load leveling batteries. The batteries simply get too large and the investment cannot always be justified. If supported by batteries, a 30MW wind farm uses a storage battery of about 15MW. This is the equivalent of 20,000 starter batteries or 176 Tesla S 85 EVs with an 85kWh battery each. The cost to store energy in a battery is high, and some say it doubles the cost to a direct supply.
The battery management system (BMS) keeps the battery at about 50 percent charge to allow absorbing energy on wind gusts and delivering on high load demands. Modern BMS can switch from charge to discharge in less than a second. This helps stabilize the voltage on transmission lines, also known as frequency regulation.
Taking into account these observations and considering the fact that most energy storage systems have a life of 5 to 30 years [15], the working circumstances for storage systems keep varying throughout their life time in order to cut short the damage done due to losses. Therefore the storage systems have to be semi mobile, flexible in capacity and modular in nature. Currently only electrochemical energy storage systems is a good match for the demand of working conditions so, that is why batteries were considered for the development of this analysis.
5. Procurement cost:
The goal was to store as much energy as possible which was lost as result of
feed-in management at the selected grid nodes. So a consideration was made that the accumulated energy can be stored with acquisition cost of 0 €/MWh.
However an economic analysis was made with the consideration of usage of different technologies at the selected grid nodes. [15].
Technology Specific annual amount of depreciation (€/kWh) Generation Cost (€/kWh) PbSO4 50 600 Li-Ion 110 1300 NaS 90 1150 Redox-Flow 70 1250
Table 4 Economic figures for 2018
When comparing the figures from the table with the current feed-in tariff in Germany of less than 100 €/MWh or the market value of wind energy of less than 40 €/MWh, the stored energy costs about 10 times more. In general, the high generation costs are mainly caused by the low number of operational cycles. Regarding the chosen assumptions and their positive influence on the economic figures, the calculation describes a quite optimistic scenario. In conclusion, for this specific application batteries cannot be operated profitably.
In the next step, a sensitivity analysis was done to reflect possible developments of technology costs until 2022.Based on different scenarios in the generation costs for PbSO4 varies between 400 and 1,800 €/MWh. Even, in a strongly progressive scenario the profit margin for this single application is negative. As a single application cannot reach a positive margin, the combination of various operating concepts for energy storage systems may improve the cost-effectiveness. First of all, reserve power markets promise significant higher specific revenues per MWh, but in principle, possible combinations should be assessed first to determine if they are technically feasible and compliant with regulations. Especially the combination of reserve control and congestion management is determined by strong technical conflicts.
![Figure 1.1 overview of RES dispersion in SH in 2012 source based on [7]](https://thumb-eu.123doks.com/thumbv2/123dokorg/7511741.105299/11.892.201.726.201.436/figure-overview-res-dispersion-sh-source-based.webp)
![Table 1 economic figure of 2012 source [1]](https://thumb-eu.123doks.com/thumbv2/123dokorg/7511741.105299/12.892.143.674.386.522/table-economic-figure-source.webp)