Chapter 6
DISCUSSION OF ACHIEVED RESULTS
6.1 Steady State conditions
Preliminary checks were executed to prove the correctness of the thermal-hydraulic and neutronic
nodalizations developed. In particular, a steady state transient at HFP was executed by the RELAP5
code in a stand-alone mode, with zero dimensional neutron kinetic. The main plant parameters (e.g.
total power, mass of the plant, coolant temperatures) were calculated in order to compare them with
the design values. In Table 6.1.1 is reported the list of these parameters. As can be seen, they fulfill
the established design values. In Appendix A are reported the time trend of the most significant
variables.
A check of the main parameters was also executed coupling the RELAP5 with the PARCS code, in
order to estimate the correctness of the 3D neutronic nodalization. There were checked the same
parameters used for the RELAP5 in stand alone mode, the axial power distribution for the fuel at
the BOL and at the EOC and the 3D core parameters distribution. These relevant core parameters
are showed in figures 6.1.3-8 for the HFP with BOL and EOC fuel.
Fig. 6.1.1 – HFP BOL axial power
0 0.2 0.4 0.6 0.8 1 1.2 1.4 1.6 0 50 100 150 200 250 300 350 400 450
Core Height
Normalized Power
Normalized Power
Fig. 6.1.2 – HFP BOL 3D normalized power distribution
Fig. 6.1.4 – HFP BOL 3D Assemblywise Moderator temperature
Fig. 6.1.5 – HFP EOC axial power
0 0.2 0.4 0.6 0.8 1 1.2 1.4 0 50 100 150 200 250 300 350 400 450 Core Height Normalized Power Normalized Power
Fig. 6.1.6 – HFP EOC 3D normalized power distribution
Table 6.1.1 – Steady State conditions – RELAP5 stand alone at HFP
QUANTITY
Unit
DESIGN
RELAP5
(41 channel)
Notes
Primary circuit balance
MWth
3000
3000
Secondary circuit balance
MWth
750
752
1 SG
PRZ pressure
MPa
15.7
15.7
SG pressure
MPa
6.3
6.4
Secondary side
SG outlet
Core inlet temperature
°K
562
563.05
Core outlet temperature
°K
593
593.62
SG inlet plenum temperature
°K
593
591.9
Design value is
not consistent
with core outlet
temperature
SG outlet plenum temperature
°K
559
562.2
SG feed–water temperature
°K
493
547
Economizer not
modeled
MCP speed
Rad/s
104.2
104.2
RPV pressure losses
MPa
0.368
0.350
Core pressure losses
MPa
0.142
0.15
MCP head
MPa
0.74/0.54
0.55
Steam Generator pressure losses
MPa
0.12
0.122
Primary side
circuit
PS total mass inventory
ton
-
221.6
SG SS mass inventory
ton
-
37.8
One SG
PS total loop coolant flow rate
Kg/s
18250
18192
SG feed-water mass flow-rate
Kg/s
408
408
One SG
Core flow-rate
(active region)
Kg/s
–
17321
Core bypass flow-rate
(LP–UP)
%
(Kg/s)
–
5.1%
(871)
DC – UH and HL nozzle bypass
Kg/s
–
240
PRZ liquid level
m
8.45
8.47
SG SS level
m
2.55
1.80
The calculated
value is the level
where void
fraction becomes
larger then 0.5
6.2 Reference cases calculations
There were executed as reference cases, a rod ejection transient with the reactor at HFP and HZP
and with the fuel at BOL and EOC. Thus, a total of four reference case was analyzed (see Table
5.2.1).
6.2.1 HZP – BOL case
The results of this transient are shown in the figures below. As reported in Table 5.2.1, this transient
generate a modest increase in the energy of the fuel; only 26.2 cal/g were obtained as peak fuel
enthalpy for the FA that experienced the rod ejection. This ‘hot spot’ value was located at 1.41 m of
height from the bottom part of the FA. The low value of the energy release was explained by these
considerations:
•
CR worth not particularly high (0.95 $)
•
High delayed neutron fraction (
b) – 0.00729 – because the fuel was at the BOL
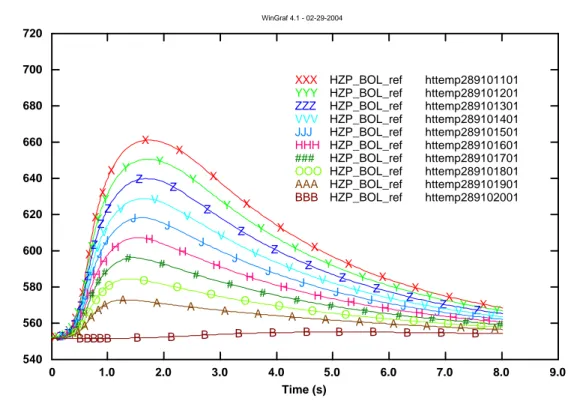
The overall reaction of the system to the transient was generally good. In fact, despite the great
power burst (Fig. 6.2.1.1) the pressure in the UH has a small fluctuation (Fig. 6.2.1.5) as the fuel
center-line temperatures (peak on plan 8) increases only of 100 degrees. The clad temperatures are
also not of safety concern.
Figure 6.2.1.1 – Reactor Power
0 1.0 2.0 3.0 4.0 5.0 6.0 7.0 8.0 9.0 Time (s) 0 1 2 3 4 5 6 7 x 10 8 Power (W) WinGraf 4.1 - 02-29-2004 XXX HZP_BOL_ref rktpow3d0 X X X X X X X X X X X X X X X X X X X XFigure 6.2.1.2 – Reactivity trend
-10 -8 -6 -4 -2 0 2 -1 0 1 2 3 4 5 6 7 8 9 Time (s) Reactivity ($) Reactivity
Figure 6.2.1.3 – Energy Released – CR ejected FA
0 1 2 3 4 5 6 7 8 9 0 50000 100000 150000 200000 250000 300000 350000 400000 450000 500000 550000 600000 650000 700000 750000 800000 8500003
4
5
6
7
8
9
10
11
12
Energy Released (J)
Time (s)
Figure 6.2.1.4 – Energy Released – CR ejected FA
0 1 2 3 4 5 6 7 8 9 0 100000 200000 300000 400000 500000 600000 700000
13
14
15
16
17
18
19
20
21
Energy Released (J)
Time (s)
Figure 6.2.1.5 - PRZ pressure
0 1.0 2.0 3.0 4.0 5.0 6.0 7.0 8.0 9.0 Time (s) 1.56 1.57 1.57 1.57 1.57 1.57 1.58 1.58 1.58 x 10 7 Pressure (Pa) WinGraf 4.1 - 02-29-2004 XXX HZP_BOL_ref p26010000 XXXXXXXXX X X X X X X X X X X XFigure 6.2.1.6 – UH pressure
0 1.0 2.0 3.0 4.0 5.0 6.0 7.0 8.0 9.0 Time (s) 1.57 1.58 1.58 1.58 1.58 1.58 1.59 1.59 x 10 7 Pressure (Pa) WinGraf 4.1 - 02-29-2004 XXX HZP_BOL_ref p150080000 XXXXX X XX X X X X X X X X X X X XFigure 6.2.1.7 – HL temperature
0 1.0 2.0 3.0 4.0 5.0 6.0 7.0 8.0 9.0 Time (s) 551.60 551.80 552.00 552.20 552.40 552.60 552.80 553.00 Temperature (°K) WinGraf 4.1 - 02-29-2004 XXX HZP_BOL_ref tempf200010000 XXXXXXXX X X X X X X X X X X X XFigure 6.2.1.8 – Fuel CL Temperature – plans # 1 to 10
0 1.0 2.0 3.0 4.0 5.0 6.0 7.0 8.0 9.0 Time (s) 540 560 580 600 620 640 660 680 700 720 740 Fuel CL temperature (°K) WinGraf 4.1 - 02-29-2004 XXX HZP_BOL_ref httemp289100101 XXXXX XX XX X X X X X X X X X X X
YYY HZP_BOL_ref httemp289100201
YYY Y Y Y Y Y Y Y Y Y Y Y Y Y Y Y Y Y ZZZ HZP_BOL_ref httemp289100301 ZZZ Z Z Z Z Z Z Z Z Z Z Z Z Z Z Z Z VVV HZP_BOL_ref httemp289100401 VV V V V V V V V V V V V V V V V V V JJJ HZP_BOL_ref httemp289100501 JJ J J J J J J J J J J J J J J J J HHH HZP_BOL_ref httemp289100601 H H H H H H H H H H H H H H H H H H ### HZP_BOL_ref httemp289100701 # # # # # # # # # # # # # # # # # #
OOO HZP_BOL_ref httemp289100801
O O O O O O O O O O O O O O O O O
AAA HZP_BOL_ref httemp289100901
A A A A A A A A A A A A A A A A A BBB HZP_BOL_ref httemp289101001 B B B B B B B B B B B B B B B B
Figure 6.2.1.9 – Fuel CL Temperature – plans # 11 to 20
0 1.0 2.0 3.0 4.0 5.0 6.0 7.0 8.0 9.0 Time (s) 540 560 580 600 620 640 660 680 700 720 Fuel CL temperature (°K) WinGraf 4.1 - 02-29-2004 XXX HZP_BOL_ref httemp289101101 XXX X X X X X X X X X X X X X X X X XYYY HZP_BOL_ref httemp289101201
YYY Y Y Y Y Y Y Y Y Y Y Y Y Y Y Y Y Y ZZZ HZP_BOL_ref httemp289101301 ZZ Z Z Z Z Z Z Z Z Z Z Z Z Z Z Z Z Z VVV HZP_BOL_ref httemp289101401 VV V V V V V V V V V V V V V V V V V JJJ HZP_BOL_ref httemp289101501 JJ J J J J J J J J J J J J J J J J HHH HZP_BOL_ref httemp289101601 HH H H H H H H H H H H H H H H H H ### HZP_BOL_ref httemp289101701 ## # # ## # # # # # # # # # # # #
OOO HZP_BOL_ref httemp289101801
OO O OO O O O O O O O O O O O O
AAA HZP_BOL_ref httemp289101901
AA AAA A A A A A A A A A A A A BBB HZP_BOL_ref httemp289102001 BBBBB B B B B B B B B B B B
Figure 6.2.1.10 – Clad Surface Temperature – plan # 1 to 10
0 1.0 2.0 3.0 4.0 5.0 6.0 7.0 8.0 9.0 Time (s) 550.0 552.0 554.0 556.0 558.0 560.0 562.0 Clad temperature (°K) WinGraf 4.1 - 02-29-2004 XXX HZP_BOL_ref httemp289100112 XXXXX XXX X X X X X X X X X X X X
YYY HZP_BOL_ref httemp289100212
YYYY Y Y YY Y Y Y Y Y Y Y Y Y Y Y Y ZZZ HZP_BOL_ref httemp289100312 ZZZ Z Z Z ZZ Z Z Z Z Z Z Z Z Z Z Z VVV HZP_BOL_ref httemp289100412 VV V V V V V V V V V V V V V V V V V JJJ HZP_BOL_ref httemp289100512 JJ J J J J J J J J J J J J J J J J HHH HZP_BOL_ref httemp289100612 HH H H H H H H H H H H H H H H H H ### HZP_BOL_ref httemp289100712 # # # # # # # # # # # # # # # # # #
OOO HZP_BOL_ref httemp289100812
O O O O O O O O O O O O O O O O O
AAA HZP_BOL_ref httemp289100912
A A A A A A A A A A A A A A A A A BBB HZP_BOL_ref httemp289101012 B B B B B B B B B B B B B B B B
Figure 6.2.1.11 – Clad Surface Temperature – plan # 11 to 20
0 1.0 2.0 3.0 4.0 5.0 6.0 7.0 8.0 9.0 Time (s) 550.0 552.0 554.0 556.0 558.0 560.0 562.0 Clad temperature (°K) WinGraf 4.1 - 02-29-2004 XXX HZP_BOL_ref httemp289101112 XXX X X X X X X X X X X X X X X X X XYYY HZP_BOL_ref httemp289101212
YYY Y Y Y Y Y Y Y Y Y Y Y Y Y Y Y Y Y ZZZ HZP_BOL_ref httemp289101312 ZZZ Z Z Z Z Z Z Z Z Z Z Z Z Z Z Z Z VVV HZP_BOL_ref httemp289101412 VV V V V V V V V V V V V V V V V V V JJJ HZP_BOL_ref httemp289101512 JJ J J J J J J J J J J J J J J J J HHH HZP_BOL_ref httemp289101612 HH H H H H H H H H H H H H H H H H ### HZP_BOL_ref httemp289101712 ## # # # # # # # # # # # # # # # #
OOO HZP_BOL_ref httemp289101812
OO O O O O O O O O O O O O O O O
AAA HZP_BOL_ref httemp289101912
AA A A A A A A A A A A A A A A A BBB HZP_BOL_ref httemp289102012 BB B B B B B B B B B B B B B B
6.2.2 HFP – BOL case
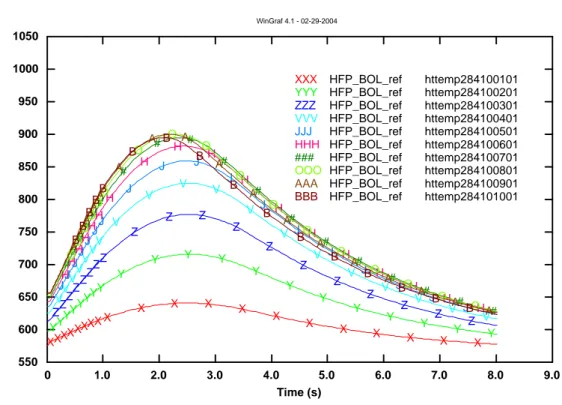
The results of this transient are shown in the figures below. As reported in Table 5.2.1, this transient
caused a peak fuel enthalpy of 63.9 cal/g localized in the FA that experienced the rod ejection. In
particular, this value was found at 1.41 m of height from the bottom part of the FA.
It has to be noted that the energy increase of the fuel, for this type of transient (HFP), is smaller than
the HZP case. In fact, the higher value that was found here, compared to the HZP case, was due
mainly to the energy previously stored into the fuel because it was operating at an higher
temperature. Thus, the power burst generated an increase of energy like the 10% of the initial stored
energy. For the HZP, instead, there was an increase like the 300% of the initial stored energy. This
different behavior can be explained by the fact that at the HFP case there was a greater value of the
Doppler effect caused by the higher starting fuel temperature.
Furthermore, the same considerations reported for the HZP – BOL case for explain the low value of
the energy release, are also here suitable:
•
CR worth not particularly high (0.2263 $)
•
High delayed neutron fraction (
b) – 0.00729 – because the fuel was at the BOL
Figure 6.2.2.1 – Reactor Power
0 1.0 2.0 3.0 4.0 5.0 6.0 7.0 8.0 9.0 Time (s) 0 .5 1 1.5 2 2.5 3 3.5 4 4.5 x 10 9 Power (W) WinGraf 4.1 - 02-29-2004 XXX HFP_BOL_ref rktpow3d0 X XXXXX X X X X X X X X X X X X X X
Figure 6.2.2.2 – Reactivity trend
-18 -16 -14 -12 -10 -8 -6 -4 -2 0 2 -1 0 1 2 3 4 5 6 7 8 9 Time (s) Reactivity ($) ReactivityFigure 6.2.2.3 – Energy released – CR ejected FA
0 2 4 6 8 0 100000 200000 300000 400000 500000 600000 700000 800000 900000 1000000 1100000 1200000 1300000 1400000 1500000 1600000
3
4
5
6
7
8
9
10
11
12
Energy Release (J)
Time (s)
Figure 6.2.2.4 – Energy released – CR ejected FA
0 2 4 6 8 0 250000 500000 750000 1000000 1250000 150000013
14
15
16
17
18
19
20
21
Energy Released (J)
Time (s)
6.2.2.5 – PRZ pressure
0 1.0 2.0 3.0 4.0 5.0 6.0 7.0 8.0 9.0 Time (s) 1.56 1.56 1.57 1.57 1.57 1.57 1.57 1.58 1.58 1.58 x 10 7 Pressure (Pa) WinGraf 4.1 - 02-29-2004 XXX HFP_BOL_ref p26010000 XXXXXXXX X X X X X X X X X X X XFigure 6.2.2.6 – UH pressure
0 1.0 2.0 3.0 4.0 5.0 6.0 7.0 8.0 9.0 Time (s) 1.54 1.55 1.56 1.57 1.58 1.59 1.6 x 10 7 Pressure (Pa) WinGraf 4.1 - 02-29-2004 XXX HFP_BOL_ref p150080000 XXXX XXXXX X X X X X X X X X X XFigure 6.2.2.7 – HL temperature
0 1.0 2.0 3.0 4.0 5.0 6.0 7.0 8.0 9.0 Time (s) 570.0 575.0 580.0 585.0 590.0 595.0 600.0 Temperature (°K) WinGraf 4.1 - 02-29-2004 XXX HFP_BOL_ref tempf200010000 XXXXXXXX X X X X X X X X X X X XFigure 6.2.2.8 – Fuel CL Temperature – plans # 1 to 10
0 1.0 2.0 3.0 4.0 5.0 6.0 7.0 8.0 9.0 Time (s) 550 600 650 700 750 800 850 900 950 1000 1050 Fuel CL temperature (°K) WinGraf 4.1 - 02-29-2004 XXX HFP_BOL_ref httemp284100101 XXXX XXXXX X X X X X X X X X X XYYY HFP_BOL_ref httemp284100201
YY YY YYY Y Y Y Y Y Y Y Y Y Y Y Y Y ZZZ HFP_BOL_ref httemp284100301 ZZ ZZ ZZ ZZ Z Z Z Z Z Z Z Z Z Z Z VVV HFP_BOL_ref httemp284100401 VV VV VV V V V V V V V V V V V V V JJJ HFP_BOL_ref httemp284100501 JJ JJ JJ J J J J J J J J J J J J HHH HFP_BOL_ref httemp284100601 H H H HH H H H H H H H H H H H H H ### HFP_BOL_ref httemp284100701 # # # # ## # # # # # # # # # # # #
OOO HFP_BOL_ref httemp284100801
O O O O OO O O O O O O O O O O O
AAA HFP_BOL_ref httemp284100901
A A A A A A A A A A A A A A A A A BBB HFP_BOL_ref httemp284101001 B B B BB B B B B B B B B B B B
Figure 6.2.2.9 – Fuel CL Temperature – plans # 11 to 20
0 1.0 2.0 3.0 4.0 5.0 6.0 7.0 8.0 9.0 Time (s) 550 600 650 700 750 800 850 900 950 1000 1050 Fuel CL temperature (°K) WinGraf 4.1 - 02-29-2004 XXX HFP_BOL_ref httemp284101101 X X X X X X X X X X X X X X X X X X X X
YYY HFP_BOL_ref httemp284101201
Y Y Y Y Y Y YY Y Y Y Y Y Y Y Y Y Y Y Y ZZZ HFP_BOL_ref httemp284101301 Z Z Z Z Z ZZ Z Z Z Z Z Z Z Z Z Z Z Z VVV HFP_BOL_ref httemp284101401 V V V V V VV V V V V V V V V V V V V JJJ HFP_BOL_ref httemp284101501 J J J J JJ J J J J J J J J J J J J HHH HFP_BOL_ref httemp284101601 H H H HH HH H H H H H H H H H H H ### HFP_BOL_ref httemp284101701 ## ## ## # # # # # # # # # # # #
OOO HFP_BOL_ref httemp284101801
OO OOO O O O O O O O O O O O O
AAA HFP_BOL_ref httemp284101901
AA AAA A A A A A A A A A A A A BBB HFP_BOL_ref httemp284102001 BBBBB B B B B B B B B B B B
Figure 6.2.2.10 –Clad Temperature – plans # 1 to 10
0 1.0 2.0 3.0 4.0 5.0 6.0 7.0 8.0 9.0 Time (s) 560.0 565.0 570.0 575.0 580.0 585.0 590.0 Clad temperature (°K) WinGraf 4.1 - 02-29-2004 XXX HFP_BOL_ref httemp284100112 XXXXXX XX X X X X X X X X X X X XYYY HFP_BOL_ref httemp284100212
YYYY YYYY Y Y Y Y Y Y Y Y Y Y Y Y ZZZ HFP_BOL_ref httemp284100312 ZZ ZZ ZZZ Z Z Z Z Z Z Z Z Z Z Z Z VVV HFP_BOL_ref httemp284100412 VV VV VV V V V V V V V V V V V V V JJJ HFP_BOL_ref httemp284100512 J JJ JJ JJ J J J J J J J J J J J HHH HFP_BOL_ref httemp284100612 H H HH HH H H H H H H H H H H H H ### HFP_BOL_ref httemp284100712 # # ## ## # # # # # # # # # # # #
OOO HFP_BOL_ref httemp284100812
O O O OO O O O O O O O O O O O O
AAA HFP_BOL_ref httemp284100912
A A A A A A A A A A A A A A A A A BBB HFP_BOL_ref httemp284101012 B B B BB B B B B B B B B B B B
Figure 6.2.2.11 –Clad Temperature – plans # 11 to 20
0 1.0 2.0 3.0 4.0 5.0 6.0 7.0 8.0 9.0 Time (s) 565.0 567.5 570.0 572.5 575.0 577.5 580.0 582.5 585.0 587.5 Clad temperature (°K) WinGraf 4.1 - 02-29-2004 XXX HFP_BOL_ref httemp284101112 XX X X X X X X X X X X X X X X X X X X
YYY HFP_BOL_ref httemp284101212
Y Y Y Y Y Y Y Y Y Y Y Y Y Y Y Y Y Y Y Y ZZZ HFP_BOL_ref httemp284101312 Z Z Z Z Z Z Z Z Z Z Z Z Z Z Z Z Z Z Z VVV HFP_BOL_ref httemp284101412 V V V V V V V V V V V V V V V V V V V JJJ HFP_BOL_ref httemp284101512 J J J J J J J J J J J J J J J J J J HHH HFP_BOL_ref httemp284101612 H H H H H H H H H H H H H H H H H H ### HFP_BOL_ref httemp284101712 # # # # # # # # # # # # # # # # # #
OOO HFP_BOL_ref httemp284101812
O O O O O O O O O O O O O O O O O
AAA HFP_BOL_ref httemp284101912
A A A A A A A A A A A A A A A A A BBB HFP_BOL_ref httemp284102012 B B B B B B B B B B B B B B B B
6.2.3 HZP – EOC case
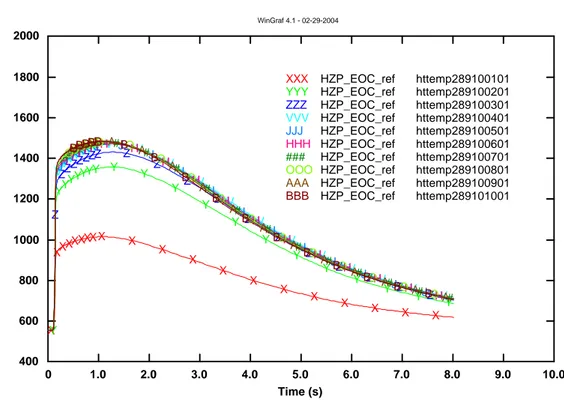
The results of the transient are shown in the figures below. As reported in Table 5.2.1, this was the
transient that caused the most severe increase of the energy released to the fuel. The FA that
experienced the rod ejection had an overshot of power that caused a peak fuel enthalpy of 81.0
cal/g. This maximum value was found at an height of 3.0 m from the bottom part of the FA.
The behavior of this HZP case, with fuel at the EOC, can be explained by these considerations:
•
CR worth particularly high (1.573 $)
•
Lower delayed neutron fraction (
b) – 0.0055
•
Small feedback negative reactivity inserted by the Doppler effect; the fuel starts the transient
with a low temperature (552 °K)
These conditions caused a super prompt critical reactivity insertion (Fig. 6.2.3.2); the consequences
were a sharp increase in the fuel and clad temperature for the FA that experienced the rod ejection
(Hot channel) and for its neighbor FAs. Details of their main parameters trend are reported in
Appendix B.
In Figure 6.2.3.12-13 there is reported the time trend of the void fraction and the coolant
temperature at the exit of the Hot Channel; it can be seen that there is not ebullition, so the coolant
remained in a subcooled state.
In Figure 6.2.3.7 there is also reported the time trend for coolant temperature in the Hot Legs. It can
be noted that its slight increase caused an increase in the UH pressure (Fig. 6.2.3.6).
All the values assumed by the parameter were not of safety concern.
Figure 6.2.3.1 – Reactor Power
0 1.0 2.0 3.0 4.0 5.0 6.0 7.0 8.0 9.0 Time (s) -.2 0 .2 .4 .6 .8 1 1.2 1.4 x 10 11 Power (W) WinGraf 4.1 - 02-29-2004 XXX HZP_EOC_ref rktpow3d0 X X XXXXXX X X X X X X X X X X X X
Figure 6.2.3.2 – Reactivity trend
-12 -10 -8 -6 -4 -2 0 2 4 -1 0 1 2 3 4 5 6 7 8 9 Time (s) Reactivity ($) ReactivityFigure 6.2.3.3 – Energy released – CR ejected FA
0 1 2 3 4 5 6 7 8 9 0 500000 1000000 1500000 2000000 2500000 3000000 3500000 4000000 4500000 5000000 5500000 6000000 6500000 7000000
3
4
5
6
7
8
9
10
11
12
Energy Released (J)
Time (s)
Figure 6.2.3.4 – Energy released – CR ejected FA
0 1 2 3 4 5 6 7 8 9 0 500000 1000000 1500000 2000000 2500000 3000000 3500000 4000000 4500000 5000000 5500000 6000000 6500000 7000000 7500000 800000013
14
15
16
17
18
19
20
21
Y Axis Title
X axis title
Figure 6.2.3.5 – PRZ pressure
0 1.0 2.0 3.0 4.0 5.0 6.0 7.0 8.0 9.0 Time (s) 1.56 1.57 1.57 1.57 1.57 1.57 1.58 1.58 x 10 7 Pressure (Pa) WinGraf 4.1 - 02-29-2004 XXX HZP_EOC_ref p26010000 XXXXXXXX X X X X X X X X X X X XFigure 6.2.3.6 – UH pressure
0 1.0 2.0 3.0 4.0 5.0 6.0 7.0 8.0 9.0 Time (s) 1.57 1.58 1.59 1.6 1.61 1.62 1.63 1.64 1.65 x 10 7 Pressure (Pa) WinGraf 4.1 - 02-29-2004 XXX HZP_EOC_ref p150080000 XX X X X X X X X X X X X X X X X X X XFigure 6.2.3.7 – HL temperature
0 1.0 2.0 3.0 4.0 5.0 6.0 7.0 8.0 9.0 Time (s) 550.0 552.0 554.0 556.0 558.0 560.0 562.0 564.0 566.0 Temperature (°K) WinGraf 4.1 - 02-29-2004 XXX HZP_EOC_ref tempf200010000 XXXXXXXX X X X X X X X X X X X XFigure 6.2.3.8 – Fuel CL Temperature – plans # 1 to 10
0 1.0 2.0 3.0 4.0 5.0 6.0 7.0 8.0 9.0 10.0 Time (s) 400 600 800 1000 1200 1400 1600 1800 2000 Fuel CL temperature (°K) WinGraf 4.1 - 02-29-2004 XXX HZP_EOC_ref httemp289100101 X XXXXXXXX X X X X X X X X X X XYYY HZP_EOC_ref httemp289100201
Y YYY YYYY Y Y Y Y Y Y Y Y Y Y Y Y ZZZ HZP_EOC_ref httemp289100301 Z ZZZ ZZZZ Z Z Z Z Z Z Z Z Z Z Z VVV HZP_EOC_ref httemp289100401 VVV VVVV V V V V V V V V V V V V JJJ HZP_EOC_ref httemp289100501 JJJ JJJJ J J J J J J J J J J J HHH HZP_EOC_ref httemp289100601 HHHHH H H H H H H H H H H H H H ### HZP_EOC_ref httemp289100701 ##### # # # # # # # # # # # # #
OOO HZP_EOC_ref httemp289100801
OOOOOO O O O O O O O O O O O
AAA HZP_EOC_ref httemp289100901
AAAAA A A A A A A A A A A A A BBB HZP_EOC_ref httemp289101001 BBBBB B B B B B B B B B B B
Figure 6.2.3.9 – Fuel CL Temperature – plans # 11 to 20
0 1.0 2.0 3.0 4.0 5.0 6.0 7.0 8.0 9.0 Time (s) 400 600 800 1000 1200 1400 1600 1800 2000 Fuel CL temperature (°K) WinGraf 4.1 - 02-29-2004 XXX HZP_EOC_ref httemp289101101 X XXX XXXX X X X X X X X X X X X X
YYY HZP_EOC_ref httemp289101201
Y YYY YYYY Y Y Y Y Y Y Y Y Y Y Y Y ZZZ HZP_EOC_ref httemp289101301 Z ZZZZZZZ Z Z Z Z Z Z Z Z Z Z Z VVV HZP_EOC_ref httemp289101401 VVV VVVV V V V V V V V V V V V V JJJ HZP_EOC_ref httemp289101501 JJJJ JJJ J J J J J J J J J J J HHH HZP_EOC_ref httemp289101601 HHHHHH H H H H H H H H H H H H ### HZP_EOC_ref httemp289101701 ###### # # # # # # # # # # # #
OOO HZP_EOC_ref httemp289101801
OOOOOO O O O O O O O O O O O
AAA HZP_EOC_ref httemp289101901
AAAAA A A A A A A A A A A A A BBB HZP_EOC_ref httemp289102001 BBBBB B B B B B B B B B B B
Figure 6.2.3.10 – Clad Temperature – plans # 1 to 10
0 1.0 2.0 3.0 4.0 5.0 6.0 7.0 8.0 9.0 Time (s) 540.0 550.0 560.0 570.0 580.0 590.0 600.0 610.0 620.0 630.0 640.0 Clad temperature (°K) WinGraf 4.1 - 02-29-2004 XXX HZP_EOC_ref httemp289100112 X X XX XX XX X X X X X X X X X X X XYYY HZP_EOC_ref httemp289100212
Y Y Y Y Y YYY Y Y Y Y Y Y Y Y Y Y Y Y ZZZ HZP_EOC_ref httemp289100312 Z ZZ Z Z Z ZZ Z Z Z Z Z Z Z Z Z Z Z VVV HZP_EOC_ref httemp289100412 V VV V V VV V V V V V V V V V V V V JJJ HZP_EOC_ref httemp289100512 J JJ J J JJ J J J J J J J J J J J HHH HZP_EOC_ref httemp289100612 H HH H H H H H H H H H H H H H H H ### HZP_EOC_ref httemp289100712 ### # # # # # # # # # # # # # # #
OOO HZP_EOC_ref httemp289100812
OOO O O O O O O O O O O O O O O
AAA HZP_EOC_ref httemp289100912
AAA A A A A A A A A A A A A A A BBB HZP_EOC_ref httemp289101012 BB B B B B B B B B B B B B B B
Figure 6.2.3.11 – Clad Temperature – plans # 11 to 20
0 1.0 2.0 3.0 4.0 5.0 6.0 7.0 8.0 9.0 Time (s) 540 560 580 600 620 640 660 Clad temperature (°K) WinGraf 4.1 - 02-29-2004 XXX HZP_EOC_ref httemp289101112 X X X X XXX X X X X X X X X X X X X X
YYY HZP_EOC_ref httemp289101212
Y Y Y Y YY Y Y Y Y Y Y Y Y Y Y Y Y Y Y ZZZ HZP_EOC_ref httemp289101312 Z Z Z ZZZZ Z Z Z Z Z Z Z Z Z Z Z Z VVV HZP_EOC_ref httemp289101412 V V V VVVV V V V V V V V V V V V V JJJ HZP_EOC_ref httemp289101512 J J J J JJJ J J J J J J J J J J J HHH HZP_EOC_ref httemp289101612 H H HHHHH H H H H H H H H H H H ### HZP_EOC_ref httemp289101712 # # #### # # # # # # # # # # # #
OOO HZP_EOC_ref httemp289101812
O OOOOO O O O O O O O O O O O
AAA HZP_EOC_ref httemp289101912
A AAAA A A A A A A A A A A A A BBB HZP_EOC_ref httemp289102012 B B BBB B B B B B B B B B B B
Fig. 6.2.3.12 – FA Channel outlet temperature
0 1.0 2.0 3.0 4.0 5.0 6.0 7.0 8.0 9.0 Time (s) 540.0 550.0 560.0 570.0 580.0 590.0 600.0 610.0 620.0 630.0 Temperature (°K) WinGraf 4.1 - 03-02-2004 XXX HZP_EOC_ref tempf289200000 XX X X X X XXX X X X X X X X X X X XFig. 6.2.3.13 – FA Channel Void Fraction
0 1.0 2.0 3.0 4.0 5.0 6.0 7.0 8.0 9.0 10.0 Time (s) 0 .2 .4 .6 .8 1 1.2 x 10 -6 Void Fraction WinGraf 4.1 - 03-02-2004 XXX HZP_EOC_ref voidg289010000
YYY HZP_EOC_ref voidg289020000
ZZZ HZP_EOC_ref voidg289030000
VVV HZP_EOC_ref voidg289040000
JJJ HZP_EOC_ref voidg289050000
HHH HZP_EOC_ref voidg289060000
### HZP_EOC_ref voidg289070000
OOO HZP_EOC_ref voidg289080000
AAA HZP_EOC_ref voidg289090000
BBB HZP_EOC_ref voidg289100000
CCC HZP_EOC_ref voidg289110000
DDD HZP_EOC_ref voidg289120000
EEE HZP_EOC_ref voidg289130000
FFF HZP_EOC_ref voidg289140000
GGG HZP_EOC_ref voidg289150000
III HZP_EOC_ref voidg289160000
LLL HZP_EOC_ref voidg289170000
MMM HZP_EOC_ref voidg289180000
NNN HZP_EOC_ref voidg289190000
Fig. 6.2.3.14 – FA Channel flowrate
0 1.0 2.0 3.0 4.0 5.0 6.0 7.0 8.0 9.0 Time (s) 96.0 98.0 100.0 102.0 104.0 106.0 108.0 110.0 Mass flowrate (Kg/s) WinGraf 4.1 - 03-04-2004 XXX HZP_EOC_ref mflowj289010000 X X X X X X XX X X X X X X X X X X X XFig. 6.2.3.15 –Core flowrate
0 1.0 2.0 3.0 4.0 5.0 6.0 7.0 8.0 9.0 Time (s) 1.85 1.86 1.86 1.86 1.86 1.87 1.87 1.87 1.87 1.88 1.88 x 10 4 Mass flowrate (Kg/s) WinGraf 4.1 - 03-04-2004 XXX HZP_EOC_ref mflowj100010000 X X X X X XX X X X X X X X X X X X X X
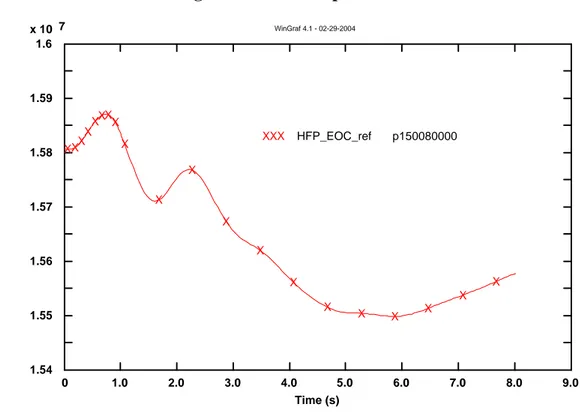
6.2.4 HFP – EOC case
The results of this transient are shown in the figures below. As reported in Table 5.2.1, the peak fuel
enthalpy was 59.5 cal/g. It was released in the FA that experienced the rod ejection (‘Hot Channel’)
at 0.7 m of height from its bottom part. Also in this case, as in the HFP – BOL case, there was a
small quantity of energy released to the fuel, because the higher temperature of the fuel itself (i.e. a
greater Doppler effect). The energy increase was about 10% of the initial stored energy (52.1 cal/g).
The consequences were in a less severe temperature transient for the FA (see Figures 6.2.4.8 to
6.2.4.11 and Appendix B) and in a less severe transient for the whole plant (see Figure 6.2.4.6).
Figure 6.2.4.1 – Reactor Power
0 1.0 2.0 3.0 4.0 5.0 6.0 7.0 8.0 9.0 Time (s) 0 1 2 3 4 5 6 x 10 9 Power (W) WinGraf 4.1 - 02-29-2004 XXX HFP_EOC_ref rktpow3d0 X XX X X X X X X X X X X X X X X X X X
Figure 6.2.4.2 – Reactivity trend
-25 -20 -15 -10 -5 0 5 -1 0 1 2 3 4 5 6 7 8 9 Time (s) Reactivity ($) ReactivityFigure 6.2.4.3 – Energy released – CR ejected FA
0 2 4 6 8 0 250000 500000 750000 1000000 1250000 1500000 1750000
3
4
5
6
7
8
9
10
11
12
Energy Released (J)
Time (s)
Figure 6.2.4.4 – Energy released – CR ejected FA
0 2 4 6 8 0 250000 500000 750000 1000000 125000013
14
15
16
17
18
19
20
21
Energy Released (J)
Time (s)
Figure 6.2.4.5 – PRZ pressure
0 1.0 2.0 3.0 4.0 5.0 6.0 7.0 8.0 9.0 Time (s) 1.56 1.57 1.57 1.57 1.57 1.57 1.58 1.58 x 10 7 Pressure (Pa) WinGraf 4.1 - 02-29-2004 XXX HFP_EOC_ref p26010000 XXXXXXXX X X X X X X X X X X X XFigure 6.2.4.6 – UH pressure
0 1.0 2.0 3.0 4.0 5.0 6.0 7.0 8.0 9.0 Time (s) 1.54 1.55 1.56 1.57 1.58 1.59 1.6 x 10 7 Pressure (Pa) WinGraf 4.1 - 02-29-2004 XXX HFP_EOC_ref p150080000 XXX XX XXX X X X X X X X X X X X XFigure 6.2.4.7 – HL temperature
0 1.0 2.0 3.0 4.0 5.0 6.0 7.0 8.0 9.0 Time (s) 570.0 575.0 580.0 585.0 590.0 595.0 600.0 Temperature (°K) WinGraf 4.1 - 03-02-2004 XXX HFP_EOC_ref tempf200010000 XXXXXXXX X X X X X X X X X X X XFigure 6.2.4.8 – Fuel CL Temperature – plans # 1 to 10
0 1.0 2.0 3.0 4.0 5.0 6.0 7.0 8.0 9.0 Time (s) 550 600 650 700 750 800 850 900 950 1000 1050 Fuel CL temperature (°K) WinGraf 4.1 - 02-29-2004 XXX HFP_EOC_ref httemp284100101 XX XX XX XX X X X X X X X X X X X XYYY HFP_EOC_ref httemp284100201
Y Y Y YY YY Y Y Y Y Y Y Y Y Y Y Y Y Y ZZZ HFP_EOC_ref httemp284100301 Z Z Z Z Z ZZ Z Z Z Z Z Z Z Z Z Z Z Z VVV HFP_EOC_ref httemp284100401 V V V V VV V V V V V V V V V V V V V JJJ HFP_EOC_ref httemp284100501 J J J J JJ J J J J J J J J J J J J HHH HFP_EOC_ref httemp284100601 H H HH HH H H H H H H H H H H H H ### HFP_EOC_ref httemp284100701 # # # ## # # # # # # # # # # # # #
OOO HFP_EOC_ref httemp284100801
O O OO OO O O O O O O O O O O O
AAA HFP_EOC_ref httemp284100901
A AA AA A A A A A A A A A A A A BBB HFP_EOC_ref httemp284101001 B BB BB B B B B B B B B B B B
Figure 6.2.4.9 – Fuel CL Temperature – plans # 11 to 20
0 1.0 2.0 3.0 4.0 5.0 6.0 7.0 8.0 9.0 Time (s) 550 600 650 700 750 800 850 900 950 Fuel CL temperature (°K) WinGraf 4.1 - 02-29-2004 XXX HFP_EOC_ref httemp284101101 X X X X X X XX X X X X X X X X X X X X
YYY HFP_EOC_ref httemp284101201
Y Y Y Y Y Y YY Y Y Y Y Y Y Y Y Y Y Y Y ZZZ HFP_EOC_ref httemp284101301 Z Z Z Z Z ZZ Z Z Z Z Z Z Z Z Z Z Z Z VVV HFP_EOC_ref httemp284101401 V V V V V VV V V V V V V V V V V V V JJJ HFP_EOC_ref httemp284101501 J J J J JJ J J J J J J J J J J J J HHH HFP_EOC_ref httemp284101601 H H H H HH H H H H H H H H H H H H ### HFP_EOC_ref httemp284101701 # # # ## # # # # # # # # # # # # #
OOO HFP_EOC_ref httemp284101801
O O O OOO O O O O O O O O O O O
AAA HFP_EOC_ref httemp284101901
A A AAA A A A A A A A A A A A A BBB HFP_EOC_ref httemp284102001 BBBBB B B B B B B B B B B B
Figure 6.2.4.10 – Clad Temperature – plans # 1 to 10
0 1.0 2.0 3.0 4.0 5.0 6.0 7.0 8.0 9.0 Time (s) 562.5 565.0 567.5 570.0 572.5 575.0 577.5 580.0 582.5 585.0 Clad temperature (°K) WinGraf 4.1 - 02-29-2004 XXX HFP_EOC_ref httemp284100112 XX XX XXX X X X X X X X X X X X X XYYY HFP_EOC_ref httemp284100212
Y Y Y YY YY Y Y Y Y Y Y Y Y Y Y Y Y Y ZZZ HFP_EOC_ref httemp284100312 Z Z Z Z ZZ ZZ Z Z Z Z Z Z Z Z Z Z Z VVV HFP_EOC_ref httemp284100412 V V V V V VV V V V V V V V V V V V V JJJ HFP_EOC_ref httemp284100512 J J J J JJ J J J J J J J J J J J J HHH HFP_EOC_ref httemp284100612 H H H H HH H H H H H H H H H H H H ### HFP_EOC_ref httemp284100712 # # # # ## # # # # # # # # # # # #
OOO HFP_EOC_ref httemp284100812
O O O O OO O O O O O O O O O O O
AAA HFP_EOC_ref httemp284100912
A A A A A A A A A A A A A A A A A BBB HFP_EOC_ref httemp284101012 B B B B B B B B B B B B B B B B
Figure 6.2.4.11 – Clad Temperature – plans # 11 to 20
0 1.0 2.0 3.0 4.0 5.0 6.0 7.0 8.0 9.0 Time (s) 565.0 567.5 570.0 572.5 575.0 577.5 580.0 582.5 585.0 587.5 590.0 Clad temperature (°K) WinGraf 4.1 - 03-02-2004 XXX HFP_EOC_ref httemp284101112 XX X X X X X X X X X X X X X X X X X X
YYY HFP_EOC_ref httemp284101212
Y Y Y Y Y Y Y Y Y Y Y Y Y Y Y Y Y Y Y Y ZZZ HFP_EOC_ref httemp284101312 Z Z Z Z Z Z ZZ Z Z Z Z Z Z Z Z Z Z Z VVV HFP_EOC_ref httemp284101412 V V V V V V V V V V V V V V V V V V V JJJ HFP_EOC_ref httemp284101512 J J J J J J J J J J J J J J J J J J HHH HFP_EOC_ref httemp284101612 H H H H H H H H H H H H H H H H H H ### HFP_EOC_ref httemp284101712 # # # # # # # # # # # # # # # # # #
OOO HFP_EOC_ref httemp284101812
O O O O OO O O O O O O O O O O O
AAA HFP_EOC_ref httemp284101912
A A A A A A A A A A A A A A A A A BBB HFP_EOC_ref httemp284102012 B B B B B B B B B B B B B B B B
6.3 Sensitivity analyses calculations
Sensitivity analyses were performed on the HZP – EOC case, because, as shown in the Chapter
6.2.3, it was found to be the most severe transient for the fuel and for the plant itself.
As reported thoroughly in Chapter 5.3, these analyses were executed varying various physical
parameters of the fuel (geometrical and nuclear characteristics), the flow regime of the plant, the
cross section libraries resolution. In the Figure 6.3.1, it is reported the results of the calculations for
the energy released to the fuel for the all cases analyzed; in Table 6.3.1 is also reported the main
parameters variation. Then, below, the results are described in details.
Fig. 6.3.1 – HZP EOC sensitivity analyses – Peak Fuel Enthalpy
0 20 40 60 80 100 120 140
XSec_20 - Reference case
XSec_42 - increased resolution
Doppler weighting factor increase
Natural Circulation1 pump in operation2 pump in operationXenon poisoning
Gap closure & fuel restructuredHeat Conductivity & Rim Zone
Delayed neutron fraction specified
Peak Fuel Enthalpy (cal/ g)
Energy Released Initial Stored Energy
+22% +18.5% -20% +1.5% +0.9% +66.8% +2.6% +13.2% +12.3%
Table 6.3.1 – Main parameters variation for the Hot Spot
Transient
HZP
Delta
Energy
Release
(%)
Maximum
Fuel CL
temperature
Maximum
Fuel Clad
Temperature
Minimum
DNBR
----
Boiling
channel
Notes
XSec_20
61.13 cal/g
1580 K
630 K
3.03 on
plan #18
NO
Reference
case
XSec_42
+21.9%
+12.6%
same behav.
~ +1%
same behav.
1.99 on
plan #18
YES
Doppler
weighting
factor
+18.5%
+10.7%
same behav.
~ +1%
same behav.
2.09 on
plan #18
YES
Natural
Circulation
-19.9%
-11.4%
same behav.
+11.2%
sharp
increase
0.88 on
plan #18
YES
Code
crashing
@ 1.4 s
1 pump
+1.5%
+0.6%
same
behavior
+17.9%
sharp
increase
0.447 on
plan #18
YES
Code
crashing
@ 1.35 s
2 pump
+0.9%
+0.6%
same behav.
+31.1%
slow cool
down
0.97 on
plan #18
YES
Gap closure &
delta density
+2.6%
+0.6%
faster cool
down
+55.2%
greatest
increase
1.01 on
plan #18
YES
Rim Effect &
delta
conductibility
+13.2%
+10.12%
cool down
very slow
-0.4%
same behav.
3.64 on
plan #18
NO
Xenon
+66.8%
+32.27%
same
behavior
+55.7%
same behav.
1.0 on plan
#17,18
YES
Beta point
+12.3%
+6.9%
same behav.
+0.8%
same behav.
2.22 on
plan #18
YES
6.3.1 Fuel characteristics variation
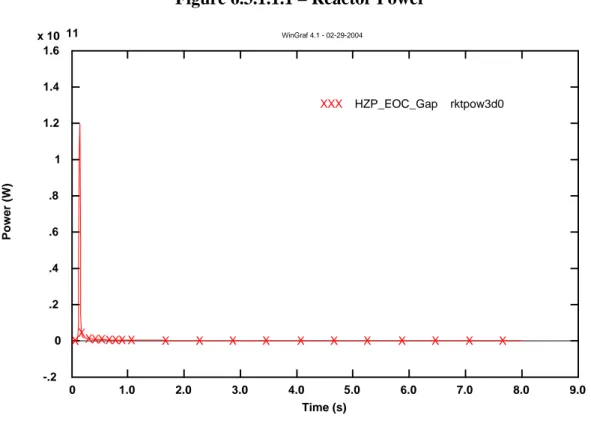
6.3.1.1 Gap closure and fuel restructuring
Preliminary consideration is that this type of sensitivity analysis was executed only on the FA that
experienced that rod ejection. It was found that the gap closure and the fuel restructuring did not
affect the value of the maximum energy deposited (+2.6%). On the other hand, these modifications
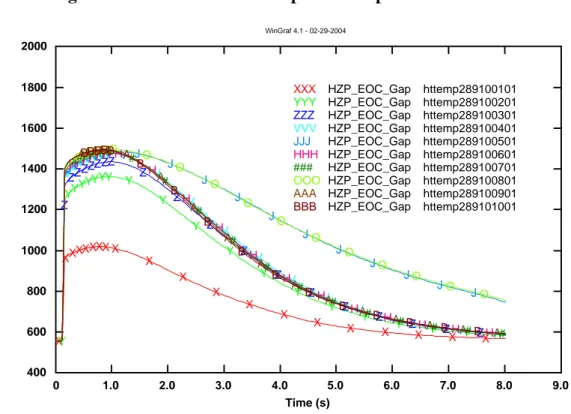
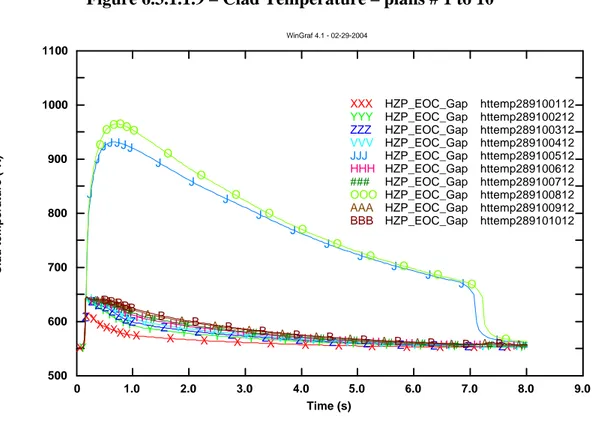
affected greatly the temperature transient of the FA. In fact, as can be seen in the figures
6.3.1.1.7-10, the maximum clad surface temperature, experienced a huge increase of the +55%. The fuel
centerline temperature, instead, did not increase so much (+0.6%).
Figure 6.3.1.1.1 – Reactor Power
0 1.0 2.0 3.0 4.0 5.0 6.0 7.0 8.0 9.0 Time (s) -.2 0 .2 .4 .6 .8 1 1.2 1.4 1.6 x 10 11 Power (W) WinGraf 4.1 - 02-29-2004 XXX HZP_EOC_Gap rktpow3d0 XXXXXXXX X X X X X X X X X X X XFigure 6.3.1.1.2 – Energy Released –CR ejected FA
0 1 2 3 4 5 6 7 8 9 0 500000 1000000 1500000 2000000 2500000 3000000 3500000 4000000 4500000 5000000 5500000 6000000 6500000 7000000 7500000
3
4
5
6
7
8
9
10
11
12
Energy Release (J)
Time (s)
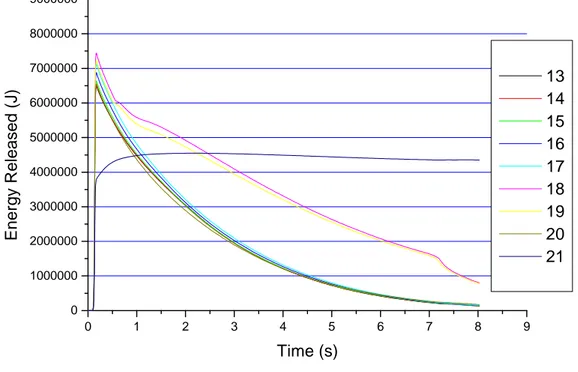
Figure 6.3.1.1.3 – Energy Released –CR ejected FA
0 1 2 3 4 5 6 7 8 9 0 1000000 2000000 3000000 4000000 5000000 6000000 7000000 8000000 900000013
14
15
16
17
18
19
20
21
Energy Released (J)
Time (s)
Figure 6.3.1.1.4 – PRZ pressure
0 1.0 2.0 3.0 4.0 5.0 6.0 7.0 8.0 9.0 10.0 Time (s) 1.57 1.57 1.57 1.57 1.58 1.58 1.58 x 10 7 Pressure (Pa) WinGraf 4.1 - 02-29-2004 XXX HZP_EOC_Gap p26010000 XXXXXXXXX X X X X X X X X X X XFigure 6.3.1.1.5 – UH pressure
0 1.0 2.0 3.0 4.0 5.0 6.0 7.0 8.0 9.0 Time (s) 1.57 1.58 1.59 1.6 1.61 1.62 1.63 1.64 1.65 1.66 x 10 7 Pressure (Pa) WinGraf 4.1 - 02-29-2004 XXX HZP_EOC_Gap p150080000 XX X X X X X X X X X X X X X X X X X XFigure 6.3.1.1.6 – HL temperature
0 1.0 2.0 3.0 4.0 5.0 6.0 7.0 8.0 9.0 Time (s) 550.0 552.0 554.0 556.0 558.0 560.0 562.0 564.0 566.0 Temperature (°K) WinGraf 4.1 - 02-29-2004 XXX HZP_EOC_Gap tempf200010000 XXXXXXXX X X X X X X X X X X X XFigure 6.3.1.1.7 – Fuel CL Temperature – plans # 1 to 10
0 1.0 2.0 3.0 4.0 5.0 6.0 7.0 8.0 9.0 Time (s) 400 600 800 1000 1200 1400 1600 1800 2000 Fuel CL temperature (°K) WinGraf 4.1 - 02-29-2004 XXX HZP_EOC_Gap httemp289100101 X XXXXXXX X X X X X X X X X X X XYYY HZP_EOC_Gap httemp289100201
Y YYY YYYY Y Y Y Y Y Y Y Y Y Y Y Y ZZZ HZP_EOC_Gap httemp289100301 Z ZZZZZ ZZ Z Z Z Z Z Z Z Z Z Z Z VVV HZP_EOC_Gap httemp289100401 VVV VVVV V V V V V V V V V V V V JJJ HZP_EOC_Gap httemp289100501 J JJJ J JJ J J J J J J J J J J J HHH HZP_EOC_Gap httemp289100601 HHHHHH H H H H H H H H H H H H ### HZP_EOC_Gap httemp289100701 ###### # # # # # # # # # # # #
OOO HZP_EOC_Gap httemp289100801
OOOOOO O O O O O O O O O O O
AAA HZP_EOC_Gap httemp289100901
AAAAA A A A A A A A A A A A A BBB HZP_EOC_Gap httemp289101001 BBBBB B B B B B B B B B B B
Figure 6.3.1.1.8 – Fuel CL Temperature – plans # 11 to 20
0 1.0 2.0 3.0 4.0 5.0 6.0 7.0 8.0 9.0 Time (s) 400 600 800 1000 1200 1400 1600 1800 2000 2200 Fuel CL temperature (°K) WinGraf 4.1 - 02-29-2004 XXX HZP_EOC_Gap httemp289101101 X XXXX XXX X X X X X X X X X X X X
YYY HZP_EOC_Gap httemp289101201
Y YYYYYYY Y Y Y Y Y Y Y Y Y Y Y Y ZZZ HZP_EOC_Gap httemp289101301 Z ZZZZZZZ Z Z Z Z Z Z Z Z Z Z Z VVV HZP_EOC_Gap httemp289101401 VVVVVVV V V V V V V V V V V V V JJJ HZP_EOC_Gap httemp289101501 J JJJ JJJ J J J J J J J J J J J HHH HZP_EOC_Gap httemp289101601 HHHHHH H H H H H H H H H H H H ### HZP_EOC_Gap httemp289101701 ###### # # # # # # # # # # # #
OOO HZP_EOC_Gap httemp289101801
OOOOOO O O O O O O O O O O O
AAA HZP_EOC_Gap httemp289101901
AAAAA A A A A A A A A A A A A BBB HZP_EOC_Gap httemp289102001 BBBBB B B B B B B B B B B B
Figure 6.3.1.1.9 – Clad Temperature – plans # 1 to 10
0 1.0 2.0 3.0 4.0 5.0 6.0 7.0 8.0 9.0 Time (s) 500 600 700 800 900 1000 1100 Clad temperature (°K) WinGraf 4.1 - 02-29-2004 XXX HZP_EOC_Gap httemp289100112 X XX XXXXX X X X X X X X X X X X XYYY HZP_EOC_Gap httemp289100212
Y YYYY YYY Y Y Y Y Y Y Y Y Y Y Y Y ZZZ HZP_EOC_Gap httemp289100312 ZZZZZZZZ Z Z Z Z Z Z Z Z Z Z Z VVV HZP_EOC_Gap httemp289100412 VVVVVV V V V V V V V V V V V V V JJJ HZP_EOC_Gap httemp289100512 J J JJ JJJ J J J J J J J J J J J HHH HZP_EOC_Gap httemp289100612 HHHHHH H H H H H H H H H H H H ### HZP_EOC_Gap httemp289100712 ###### # # # # # # # # # # # #
OOO HZP_EOC_Gap httemp289100812
O OOOOO O O O O O O O O O O O
AAA HZP_EOC_Gap httemp289100912
AAAAA A A A A A A A A A A A A BBB HZP_EOC_Gap httemp289101012 BBBBB B B B B B B B B B B B
Figure 6.3.1.1.10 – Clad Temperature – plans # 11 to 20
0 1.0 2.0 3.0 4.0 5.0 6.0 7.0 8.0 9.0 Time (s) 500 600 700 800 900 1000 1100 Clad temperature (°K) WinGraf 4.1 - 02-29-2004 XXX HZP_EOC_Gap httemp289101112 X X X X XXXX X X X X X X X X X X X X
YYY HZP_EOC_Gap httemp289101212
Y YYYYYYY Y Y Y Y Y Y Y Y Y Y Y Y ZZZ HZP_EOC_Gap httemp289101312 ZZZZZZZZ Z Z Z Z Z Z Z Z Z Z Z VVV HZP_EOC_Gap httemp289101412 VVVVVVV V V V V V V V V V V V V JJJ HZP_EOC_Gap httemp289101512 J JJJ JJJ J J J J J J J J J J J HHH HZP_EOC_Gap httemp289101612 HHHHHH H H H H H H H H H H H H ### HZP_EOC_Gap httemp289101712 ## # ## # # # # # # # # # # # # #
OOO HZP_EOC_Gap httemp289101812
OO OOO O O O O O O O O O O O O
AAA HZP_EOC_Gap httemp289101912
AAAAA A A A A A A A A A A A A BBB HZP_EOC_Gap httemp289102012 BBBBB B B B B B B B B B B B
Figure 6.3.1.1.11 – FA Channel Void Fraction – plans # 1 to 10
0 1.0 2.0 3.0 4.0 5.0 6.0 7.0 8.0 9.0 Time (s) -.01 0 .01 .01 .02 .02 .03 .03 .04 .04 Void Fraction WinGraf 4.1 - 02-29-2004 XXX HZP_EOC_Gap voidg289010000 XXXXXXXX X X X X X X X X X X X XYYY HZP_EOC_Gap voidg289020000
YYYYYYYY Y Y Y Y Y Y Y Y Y Y Y Y ZZZ HZP_EOC_Gap voidg289030000 ZZZZZZZZ Z Z Z Z Z Z Z Z Z Z Z VVV HZP_EOC_Gap voidg289040000 VVVVVVV V V V V V V V V V V V V JJJ HZP_EOC_Gap voidg289050000 J JJJ JJJ J J J J J J J J J J J HHH HZP_EOC_Gap voidg289060000 HHHHHH H H H H H H H H H H H H ### HZP_EOC_Gap voidg289070000 ###### # # # # # # # # # # # #
OOO HZP_EOC_Gap voidg289080000
OOOOOO O O O O O O O O O O O
AAA HZP_EOC_Gap voidg289090000
AAAAA A A A A A A A A A A A A
BBB HZP_EOC_Gap voidg289100000
B B
BBB B B B B B B B B B B B
Figure 6.3.1.1.12 – FA Channel Void Fraction – plans # 11 to 20
0 1.0 2.0 3.0 4.0 5.0 6.0 7.0 8.0 9.0 Time (s) -.10 0 .10 .20 .30 .40 .50 .60 .70 Void Fraction WinGraf 4.1 - 02-29-2004 XXX HZP_EOC_Gap voidg289110000 XXXXXXXX X X X X X X X X X X X X
YYY HZP_EOC_Gap voidg289120000
YYYY YY YY Y Y Y Y Y Y Y Y Y Y Y Y ZZZ HZP_EOC_Gap voidg289130000 ZZZ Z Z Z ZZ Z Z Z Z Z Z Z Z Z Z Z VVV HZP_EOC_Gap voidg289140000 VVV V V V V V V V V V V V V V V V V JJJ HZP_EOC_Gap voidg289150000 J J J JJ J J J J J J J J J J J J J HHH HZP_EOC_Gap voidg289160000 H H H H H H H H H H H H H H H H H H ### HZP_EOC_Gap voidg289170000 # # # # # # # # # # # # # # # # # #
OOO HZP_EOC_Gap voidg289180000
O O O O O O O O O O O O O O O O O
AAA HZP_EOC_Gap voidg289190000
A A AA A A A A A A A A A A A A A BBB HZP_EOC_Gap voidg289200000 B B B B B B B B B B B B B B B B
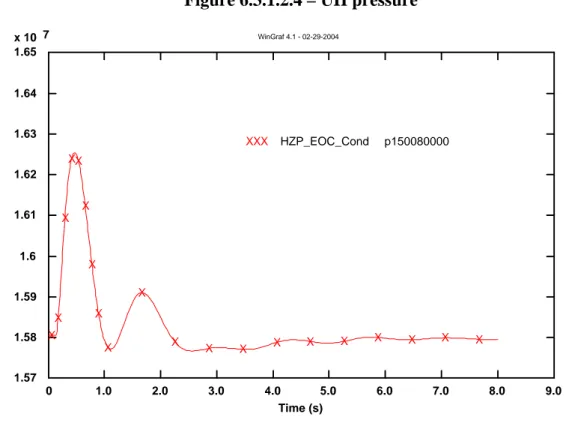
6.3.1.2 Heat conductivity variation
In order to simulate the effect of the decreased pellet thermal conductivity caused by the Plutonium
buildup on the border (‘rim effect’) and by this zone fragmentation, it was changed in the RELAP5
code, the fuel pellet mesh structure. In particular, it was increased the number of mesh point from
12 to 13, so modeling a special zone on the border with a decreased thermal conductivity (-50%).
The results show that this kind of modification cause only an increase in the fuel CL temperature
and a delaying in the cool down of the pellets. No variations were found to affect the clad maximum
temperature. The energy released, instead, shown a small increase (+13.2%); this was explained by
the better adiabatic conditions established by the decreased thermal conductivity in the external
zone of the pellet. On the other hand, this phenomenon, causing the increase of fuel CL
temperature, increased also the Doppler effect, minimizing the energy released increase.
Figure 6.3.1.2.1 – Reactor Power
0 1.0 2.0 3.0 4.0 5.0 6.0 7.0 8.0 9.0 Time (s) -.2 0 .2 .4 .6 .8 1 1.2 1.4 1.6 x 10 11 Power (W) WinGraf 4.1 - 02-29-2004 XXX HZP_EOC_Cond rktpow3d0 XXXXXXXX X X X X X X X X X X X X
Figure 6.3.1.2.2 – Energy Released –CR ejected FA
0 1 2 3 4 5 6 7 8 9 0 1000000 2000000 3000000 4000000 5000000 6000000 7000000 8000000 90000003
4
5
6
7
8
9
10
11
12
Energy Released (J)
Time (s)
Figure 6.3.1.2.3 – Energy Released –CR ejected FA
0 1 2 3 4 5 6 7 8 9 0 1000000 2000000 3000000 4000000 5000000 6000000 7000000 8000000 9000000
13
14
15
16
17
18
19
20
21
Energy Released (J)
Time (s)
Figure 6.3.1.2.4 – UH pressure
0 1.0 2.0 3.0 4.0 5.0 6.0 7.0 8.0 9.0 Time (s) 1.57 1.58 1.59 1.6 1.61 1.62 1.63 1.64 1.65 x 10 7 Pressure (Pa) WinGraf 4.1 - 02-29-2004 XXX HZP_EOC_Cond p150080000 X X X XX X X X X X X X X X X X X X X XFigure 6.3.1.2.5 – HL temperature
0 1.0 2.0 3.0 4.0 5.0 6.0 7.0 8.0 9.0 Time (s) 550.0 552.0 554.0 556.0 558.0 560.0 562.0 564.0 Temperature (°K) WinGraf 4.1 - 02-29-2004 XXX HZP_EOC_Cond tempf200010000 XXXXXXXX X X X X X X X X X X X XFigure 6.3.1.2.6 – Fuel CL Temperature – plans # 1 to 10
0 1.0 2.0 3.0 4.0 5.0 6.0 7.0 8.0 9.0 Time (s) 250 500 750 1000 1250 1500 1750 2000 2250 2500 2750 Fuel CL temperature (°K) WinGraf 4.1 - 02-29-2004 XXX HZP_EOC_Cond httemp289100101 X XXXXXXX X X X X X X X X X X X XYYY HZP_EOC_Cond httemp289100201
Y YYYYY YY Y Y Y Y Y Y Y Y Y Y Y Y ZZZ HZP_EOC_Cond httemp289100301 ZZZ ZZZZZ Z Z Z Z Z Z Z Z Z Z Z VVV HZP_EOC_Cond httemp289100401 VVVVV VV V V V V V V V V V V V V JJJ HZP_EOC_Cond httemp289100501 J JJJ J JJ J J J J J J J J J J J HHH HZP_EOC_Cond httemp289100601 HHHHH H H H H H H H H H H H H H ### HZP_EOC_Cond httemp289100701 ###### # # # # # # # # # # # #
OOO HZP_EOC_Cond httemp289100801
OOOOOO O O O O O O O O O O O
AAA HZP_EOC_Cond httemp289100901
AAAAA A A A A A A A A A A A A
Figure 6.3.1.2.7 – Fuel CL Temperature – plans # 11 to 20
0 1.0 2.0 3.0 4.0 5.0 6.0 7.0 8.0 9.0 Time (s) 400 600 800 1000 1200 1400 1600 1800 Fuel CL temperature (°K) WinGraf 4.1 - 02-29-2004 XXX HZP_EOC_Cond httemp289101101 X XXX XXXX X X X X X X X X X X X X
YYY HZP_EOC_Cond httemp289101201
Y YYY YYYY Y Y Y Y Y Y Y Y Y Y Y Y ZZZ HZP_EOC_Cond httemp289101301 Z ZZZZZZZ Z Z Z Z Z Z Z Z Z Z Z VVV HZP_EOC_Cond httemp289101401 VVV VVVV V V V V V V V V V V V V JJJ HZP_EOC_Cond httemp289101501 JJJJ JJJ J J J J J J J J J J J HHH HZP_EOC_Cond httemp289101601 HHHHHH H H H H H H H H H H H H ### HZP_EOC_Cond httemp289101701 ###### # # # # # # # # # # # #
OOO HZP_EOC_Cond httemp289101801
OOOOOO O O O O O O O O O O O
AAA HZP_EOC_Cond httemp289101901
AAAAA A A A A A A A A A A A A BBB HZP_EOC_Cond httemp289102001 BBBBB B B B B B B B B B B B
Figure 6.3.1.2.8 – Clad Temperature – plans # 1 to 10
0 1.0 2.0 3.0 4.0 5.0 6.0 7.0 8.0 9.0 Time (s) 540.0 550.0 560.0 570.0 580.0 590.0 600.0 610.0 620.0 630.0 640.0 Clad temperature (°K) WinGraf 4.1 - 02-29-2004 XXX HZP_EOC_Cond httemp289100113 X X XX XX XX X X X X X X X X X X X XYYY HZP_EOC_Cond httemp289100213
Y Y Y Y Y Y YY Y Y Y Y Y Y Y Y Y Y Y Y ZZZ HZP_EOC_Cond httemp289100313 Z ZZ Z Z Z ZZ Z Z Z Z Z Z Z Z Z Z Z VVV HZP_EOC_Cond httemp289100413 V VV V V V V V V V V V V V V V V V V JJJ HZP_EOC_Cond httemp289100513 J J J J J J J J J J J J J J J J J J HHH HZP_EOC_Cond httemp289100613 H H H H H H H H H H H H H H H H H H ### HZP_EOC_Cond httemp289100713 ### # # # # # # # # # # # # # # #
OOO HZP_EOC_Cond httemp289100813
OO O O O O O O O O O O O O O O O
AAA HZP_EOC_Cond httemp289100913
AA A A A A A A A A A A A A A A A BBB HZP_EOC_Cond httemp289101013 BB B B B B B B B B B B B B B B
Figure 6.3.1.2.9 – Clad Temperature – plans # 11 to 20
0 1.0 2.0 3.0 4.0 5.0 6.0 7.0 8.0 9.0 Time (s) 540 560 580 600 620 640 660 Clad temperature (°K) WinGraf 4.1 - 02-29-2004 XXX HZP_EOC_Cond httemp289101113 X X X XXXX X X X X X X X X X X X X X
YYY HZP_EOC_Cond httemp289101213
Y Y Y YYYY Y Y Y Y Y Y Y Y Y Y Y Y Y ZZZ HZP_EOC_Cond httemp289101313 Z Z Z ZZZ Z Z Z Z Z Z Z Z Z Z Z Z Z VVV HZP_EOC_Cond httemp289101413 V V V VVV V V V V V V V V V V V V V JJJ HZP_EOC_Cond httemp289101513 J J JJ JJJ J J J J J J J J J J J HHH HZP_EOC_Cond httemp289101613 H H HHHH H H H H H H H H H H H H ### HZP_EOC_Cond httemp289101713 # # #### # # # # # # # # # # # #
OOO HZP_EOC_Cond httemp289101813
O OOOOO O O O O O O O O O O O
AAA HZP_EOC_Cond httemp289101913
A A AAA A A A A A A A A A A A A BBB HZP_EOC_Cond httemp289102013 B B BBB B B B B B B B B B B B
6.3.2 Plant flow regime variations
6.3.2.1 Natural circulation
This transient investigated the effect of the natural circulation regime on the REA. It was assumed
that:
•
all the 4 MCP were shut down, thus they were stopped at the accident time
•
the RHR system was not in operation
•
the reactor was cooled with a ‘feed and bleed’ mode on the secondary site of the SG
The calculations of the energy released to the fuel shown there was a significant decrease of that
amount in these conditions (70 cal/g, -20%). This was explained by the greater feedback effects that
played the negative moderator temperature coefficient and the Doppler coefficient for the decreased
thermal transfer. Indeed the initial conditions shown the presence of voids in the channels (see Fig.
6.3.2.1.11-12) and their increasing during the transient evolution; furthermore the clad also has to
experience a greater temperature transient (+11% for the maximum value). On the other hand, the
maximum fuel centerline temperature decrease as consequence of the less energy released. The
power of the reactor core is decreased in this case (-40 % for the maximum value) as the global
reactivity insertion (see Fig. 6.3.2.1.2). At least, it has to been known that PARCS code crashed
during the calculation, not allowing to continue transient investigation after the 1.4 seconds time.
Figure 6.3.2.1.1 – Reactor Power
0 .20 .40 .60 .80 1.00 1.20 1.40 1.60 Time (s) -.2 0 .2 .4 .6 .8 1 1.2 x 10 11 Power (W) WinGraf 4.1 - 03-02-2004 XXX HZP_EOC_NC rktpow3d0 X X X X X X X X X X X X X X X X X X X X X
Figure 6.3.2.1.2 – Reactivity trend
-6 -5 -4 -3 -2 -1 0 1 2 -0.2 0 0.2 0.4 0.6 0.8 1 1.2 1.4 1.6 Time (s) Reactivity ($) ReactivityFigure 6.3.1.2.3 – Energy Released –CR ejected FA
0.0 0.2 0.4 0.6 0.8 1.0 1.2 1.4 1.6 0 500000 1000000 1500000 2000000 2500000 3000000 3500000 4000000 4500000 5000000 5500000 6000000 6500000
3
4
5
6
7
8
9
10
11
12
Energy released (J)
Time (s)
Figure 6.3.1.2.4 – Energy Released –CR ejected FA
0.0 0.2 0.4 0.6 0.8 1.0 1.2 1.4 1.6 0 500000 1000000 1500000 2000000 2500000 3000000 3500000 4000000 4500000 5000000 5500000 6000000 650000013
14
15
16
17
18
19
20
21
Energy Released (J)
Time (s)
Figure 6.3.2.1.5 – PRZ pressure
0 .20 .40 .60 .80 1.00 1.20 1.40 1.60 1.80 Time (s) 1.56 1.56 1.56 1.57 1.57 1.57 1.57 1.58 1.58 1.58 1.58 x 10 7 Pressure (Pa) WinGraf 4.1 - 02-29-2004 XXX HZP_EOC_NC p26010000 X X X X X X X X X X X X X X X X X X X X XFigure 6.3.2.1.6 – UH pressure
0 .20 .40 .60 .80 1.00 1.20 1.40 1.60 Time (s) 1.57 1.57 1.58 1.58 1.59 1.59 1.6 1.6 1.61 1.61 x 10 7 Pressure (Pa) WinGraf 4.1 - 02-29-2004 XXX HZP_EOC_NC p150080000 X X X X X X X X X X X X X X X X X X X X XFigure 6.3.2.1.6 – HL temperature
0 .20 .40 .60 .80 1.00 1.20 1.40 1.60 Time (s) 564.42 564.44 564.46 564.48 564.50 564.52 564.54 Temperature (°K) WinGraf 4.1 - 02-29-2004 XXX HZP_EOC_NC tempf200010000 X X X X X X X X X X X X X X X X X X X X XFigure 6.3.2.1.7 – Fuel CL Temperature – plans # 1 to 10
0 .20 .40 .60 .80 1.00 1.20 1.40 1.60 Time (s) 0 500 1000 1500 2000 2500 3000 Fuel CL temperature (°K) WinGraf 4.1 - 02-29-2004 XXX HZP_EOC_NC httemp289100101 X X X X X X X X X X X X X X X X X X X X XYYY HZP_EOC_NC httemp289100201
Y Y Y Y Y Y Y Y Y Y Y Y Y Y Y Y Y Y Y Y ZZZ HZP_EOC_NC httemp289100301 Z Z Z Z Z Z Z Z Z Z Z Z Z Z Z Z Z Z Z VVV HZP_EOC_NC httemp289100401 V V V V V V V V V V V V V V V V V V V JJJ HZP_EOC_NC httemp289100501 J J J J J J J J J J J J J J J J J J HHH HZP_EOC_NC httemp289100601 H H H H H H H H H H H H H H H H H ### HZP_EOC_NC httemp289100701 # # # # # # # # # # # # # # # # #
OOO HZP_EOC_NC httemp289100801
O O O O O O O O O O O O O O O O
AAA HZP_EOC_NC httemp289100901
A A A A A A A A A A A A A A A
BBB HZP_EOC_NC httemp289101001
B B B B B B B B B B B B B B
Figure 6.3.2.1.8 – Fuel CL Temperature – plans # 11 to 20
0 .20 .40 .60 .80 1.00 1.20 1.40 1.60 Time (s) 400 600 800 1000 1200 1400 1600 Fuel CL temperature (°K) WinGraf 4.1 - 02-29-2004 XXX HZP_EOC_NC httemp289101101 X X X X X X X X X X X X X X X X X X X X X
YYY HZP_EOC_NC httemp289101201
Y Y Y Y Y Y Y Y Y Y Y Y Y Y Y Y Y Y Y Y ZZZ HZP_EOC_NC httemp289101301 Z Z Z Z Z Z Z Z Z Z Z Z Z Z Z Z Z Z Z VVV HZP_EOC_NC httemp289101401 V V V V V V V V V V V V V V V V V V V JJJ HZP_EOC_NC httemp289101501 J J J J J J J J J J J J J J J J J J HHH HZP_EOC_NC httemp289101601 H H H H H H H H H H H H H H H H H ### HZP_EOC_NC httemp289101701 # # # # # # # # # # # # # # # # #
OOO HZP_EOC_NC httemp289101801
O O O O O
O O O O O O O O O O O
AAA HZP_EOC_NC httemp289101901
A A A A A A A A A A A A A A A
BBB HZP_EOC_NC httemp289102001
Figure 6.3.2.1.9 – Clad Temperature – plans # 1 to 10
0 .20 .40 .60 .80 1.00 1.20 1.40 1.60 Time (s) 500 550 600 650 700 750 800 Clad temperature (°K) WinGraf 4.1 - 02-29-2004 XXX HZP_EOC_NC httemp289100112 X X X X X X X X X X X X X X X X X X X X XYYY HZP_EOC_NC httemp289100212
Y Y Y Y Y Y Y Y Y Y Y Y Y Y Y Y Y Y Y Y ZZZ HZP_EOC_NC httemp289100312 Z Z Z Z Z Z Z Z Z Z Z Z Z Z Z Z Z Z Z VVV HZP_EOC_NC httemp289100412 V V V V V V V V V V V V V V V V V V V JJJ HZP_EOC_NC httemp289100512 J J J J J J J J J J J J J J J J J J HHH HZP_EOC_NC httemp289100612 H H H H H H H H H H H H H H H H H ### HZP_EOC_NC httemp289100712 # # # # # # # # # # # # # # # # #
OOO HZP_EOC_NC httemp289100812
O O O O O O O O O O O O O O O
O
AAA HZP_EOC_NC httemp289100912
A A A A A A A A A A A A A A A
BBB HZP_EOC_NC httemp289101012
B B B B B B B B B B B B B B
Figure 6.3.2.1.10 – Clad Temperature – plans # 11 to 20
0 .20 .40 .60 .80 1.00 1.20 1.40 1.60 Time (s) 550 575 600 625 650 675 700 725 750 775 Clad temperature (°K) WinGraf 4.1 - 02-29-2004 XXX HZP_EOC_NC httemp289101112 X X X X X X X X X X X X X X X X X X X X X
YYY HZP_EOC_NC httemp289101212
Y Y Y Y Y Y Y Y Y Y Y Y Y Y Y Y Y Y Y Y ZZZ HZP_EOC_NC httemp289101312 Z Z Z Z Z Z Z Z Z Z Z Z Z Z Z Z Z Z Z VVV HZP_EOC_NC httemp289101412 V V V V V V V V V V V V V V V V V V V JJJ HZP_EOC_NC httemp289101512 J J J J J J J J J J J J J J J J J J HHH HZP_EOC_NC httemp289101612 H H H H H H H H H H H H H H H H H ### HZP_EOC_NC httemp289101712 # # # # # # # # # # # # # # # # #
OOO HZP_EOC_NC httemp289101812
O O O O O O O O O O O O O O O
O
AAA HZP_EOC_NC httemp289101912
A A A A A A A A A A A A A A A BBB HZP_EOC_NC httemp289102012 B B B B B B B B B B B B B B