EUROPEAN ORGANIZATION FOR NUCLEAR RESEARCH (CERN)
CERN-PH-EP/2012-220 2013/01/29
CMS-HIG-12-028
Observation of a new boson at a mass of 125 GeV with the
CMS experiment at the LHC
The CMS Collaboration
Abstract
Results are presented from searches for the standard model Higgs boson in proton-proton collisions at √s = 7 and 8 TeV in the Compact Muon Solenoid experiment at the LHC, using data samples corresponding to integrated luminosities of up to 5.1 fb−1at 7 TeV and 5.3 fb−1at 8 TeV. The search is performed in five decay modes:
γγ, ZZ, W+W−, τ+τ−, and bb. An excess of events is observed above the
ex-pected background, with a local significance of 5.0 standard deviations, at a mass near 125 GeV, signalling the production of a new particle. The expected significance for a standard model Higgs boson of that mass is 5.8 standard deviations. The excess is most significant in the two decay modes with the best mass resolution, γγ and ZZ; a fit to these signals gives a mass of 125.3±0.4(stat.) ±0.5(syst.)GeV. The decay to two photons indicates that the new particle is a boson with spin different from one.
Submitted to Physics Letters B
1
1
Introduction
The standard model (SM) of elementary particles provides a remarkably accurate description of results from many accelerator and non-accelerator based experiments. The SM comprises quarks and leptons as the building blocks of matter, and describes their interactions through the exchange of force carriers: the photon for electromagnetic interactions, the W and Z bosons for weak interactions, and the gluons for strong interactions. The electromagnetic and weak interactions are unified in the electroweak theory. Although the predictions of the SM have been extensively confirmed, the question of how the W and Z gauge bosons acquire mass whilst the photon remains massless is still open.
Nearly fifty years ago it was proposed [1–6] that spontaneous symmetry breaking in gauge theories could be achieved through the introduction of a scalar field. Applying this mechanism to the electroweak theory [7–9] through a complex scalar doublet field leads to the generation of the W and Z masses, and to the prediction of the existence of the SM Higgs boson (H). The scalar field also gives mass to the fundamental fermions through the Yukawa interaction. The mass mH of the SM Higgs boson is not predicted by theory. However, general considera-tions [10–13] suggest that mHshould be smaller than∼1 TeV, while precision electroweak mea-surements imply that mH < 152 GeV at 95% confidence level (CL) [14]. Over the past twenty years, direct searches for the Higgs boson have been carried out at the LEP collider, leading to a lower bound of mH > 114.4 GeV at 95% CL [15], and at the Tevatron proton-antiproton col-lider, excluding the mass range 162–166 GeV at 95% CL [16] and detecting an excess of events, recently reported in [17–19], in the range 120–135 GeV.
The discovery or exclusion of the SM Higgs boson is one of the primary scientific goals of the Large Hadron Collider (LHC) [20]. Previous direct searches at the LHC were based on data from proton-proton collisions corresponding to an integrated luminosity of 5 fb−1collected at a centre-of-mass energy√s =7 TeV. The CMS experiment excluded at 95% CL a range of masses from 127 to 600 GeV [21]. The ATLAS experiment excluded at 95% CL the ranges 111.4–116.6, 119.4–122.1 and 129.2–541 GeV [22]. Within the remaining allowed mass region, an excess of events near 125 GeV was reported by both experiments. In 2012 the proton-proton centre-of-mass energy was increased to 8 TeV and by the end of June an additional integrated luminosity of more than 5 fb−1had been recorded by each of these experiments, thereby enhancing signif-icantly the sensitivity of the search for the Higgs boson.
This paper reports the results of a search for the SM Higgs boson using samples collected by the CMS experiment, comprising data recorded at√s =7 and 8 TeV. The search is performed in five decay modes, H→ γγ, ZZ, W+W−, τ+τ−, and bb, in the low-mass range from 110 up
to 160 GeV. In this mass range the Higgs boson production cross section is predicted to have values between 23 (29) and 10 (14) pb at√s=7 (8) TeV [23]. The natural width of the SM Higgs boson over the same range is less than 100 MeV and the width of any observed peak would be entirely dominated by instrumental mass resolution. In what follows,`stands for electrons or muons, H→W+W−is denoted as H→WW, H→τ+τ−as H→ττ, and H→bb as H→bb.
For the final states ZZ and WW in the low-mass region, one or more of the Z or W bosons is off mass shell.
With respect to the published analyses [24–28], most analyses have been re-optimized, incor-porating improvements in reconstruction performance and event selection, and mitigating the more challenging conditions due to the higher LHC intensities in 2012. The new analyses pre-sented herein, of 8 TeV samples, and of 7 TeV samples featuring modified event selection crite-ria, were performed in a “blind” way: the algorithms and selection procedures were formally approved and fixed before the results from data in the signal region were examined. In the
previously published analyses similar but less formal procedures were followed.
Within the context of this search for the SM Higgs boson, we report the observation of an excess of events above the expected background, consistent with the production of a new particle with mass near 125 GeV. The observed local significance is 5.0 standard deviations (σ), compared with an expected significance of 5.8 σ. The evidence is strongest in the two final states with the best mass resolution, namely H → γγ with a significance of 4.1 σ and H → ZZ (with the Z
bosons decaying to electrons or muons) with a significance of 3.2 σ. The decay to two photons indicates that the new particle is a boson with spin different from one.
2
The CMS experiment
The possibility of detection of the SM Higgs boson played a crucial role in the conceptual design of the CMS experiment as a benchmark to test the performance of the detector [29–31]. Since the SM Higgs boson mass is not predicted by theory and its production cross section and natural width vary widely over the allowed mass range, a search was envisaged over a large range of masses and in diverse decay modes: pairs of photons, Z bosons, W bosons, τ leptons, and b quarks. Planning in view of the analysis of all these channels ensured a detector capable of observing a Higgs boson over a broad mass range and able to detect most potential signals of new physics.
The central feature of the CMS apparatus [32] is a superconducting solenoid of 6 m inter-nal diameter, which provides a magnetic field of 3.8 T. Within the field volume are a sili-con pixel and strip tracker, a lead tungstate crystal electromagnetic calorimeter (ECAL), and a brass/scintillator hadron calorimeter (HCAL). Muons are measured in gas-ionization detec-tors embedded in the steel flux-return yoke. Extensive forward calorimeters complement the coverage provided by the barrel and endcap detectors.
Charged particles are tracked within the pseudorapidity range |η| < 2.5, where η = −ln[tan(θ/2)], and θ is the polar angle measured from the positive z axis (along the
anti-clockwise beam direction). The silicon pixel tracker comprises 66 million 100×150 µm2pixels, arranged in three barrel layers and two disks at each end. The silicon strip tracker, organized in ten barrel layers and twelve disks at each end, comprises 9.3 million strips with pitch be-tween 80 and 180 µm, with a total silicon surface area of 198 m2. The tracker has a track-finding efficiency larger than 99% for muons with transverse momentum pT greater than 1 GeV and a transverse momentum resolution between 1.5 and 2.5% for charged tracks of pT ∼ 100 GeV in the central region (|η| < 1.5). Measurements of the impact parameters of charged tracks
and secondary vertices are used to identify jets that are likely to contain the hadronisation and decay products of b quarks (“b jets”). A b-jet tagging efficiency of more than 50% is achieved with a rejection factor for light-quark jets of∼200, as measured in tt events in data [33]. The dimuon mass resolution at the Υ mass, dominated by instrumental effects, is measured to be 0.6% in the barrel region [34], consistent with the design goal.
The ECAL is a fine-grained hermetic calorimeter consisting of 75 848 lead tungstate crystals, arranged in a quasi-projective geometry and distributed in a barrel region (|η| <1.48) and two
endcaps that extend up to|η| = 3.0. The front-face cross section of the crystals is 22×22 mm2
in the barrel region and 28.6×28.6 mm2in the endcaps. Preshower detectors consisting of two planes of silicon sensors interleaved with a total of three radiation lengths of lead absorber are located in front of the endcaps. Electromagnetic showers are very narrow in lead tungstate (Moli`ere radius of 21 mm), helping in particle identification and in the implementation of iso-lation criteria. In the central barrel region the energy resolution of electrons that do not radiate
3
substantially in the tracker material indicates that the resolution of unconverted photons is con-sistent with design goals. For such photons the diphoton mass resolution is 1.1 GeV at a mass of 125 GeV.
The HCAL barrel and endcaps are sampling calorimeters consisting of brass and scintillator plates, covering |η| < 3.0. Their thickness varies from 7 to 11 interaction lengths, depending
on η; a scintillator “tail catcher” placed outside the coil of the solenoid, just in front of the in-nermost muon detector, extends the instrumented thickness to more than 10 interaction lengths everywhere. Iron forward calorimeters with quartz fibers, read out by photomultipliers, extend the calorimeter coverage up to|η| =5.0.
Muons are measured in the range|η| <2.4, with detection planes based on three technologies:
drift tubes (|η| < 1.2), cathode strip chambers (0.9 < |η| < 2.4), and resistive plate chambers
(|η| < 1.6). The first two technologies provide a precise position measurement and trigger
whilst the third provides precise timing information as well as a second and independent trig-ger. The muon system consists of four stations in the barrel and endcaps, designed to ensure robust triggering and detection of muons over a large angular range. In the barrel region each muon station consists of twelve drift-tube layers, except for the outermost station, which has eight layers. In the endcaps, each muon station consists of six detection planes. The precision of the r-φ measurement is 100 µm in the drift tubes and varies from 60 to 140 µm in the cathode strip chambers.
The CMS trigger and data acquisition systems ensure that potentially interesting events are recorded with high efficiency. The first level (L1) trigger, comprising the calorimeter, muon, and global trigger processors, uses coarse-granularity information to select the most interesting events in less than 4 µs. The detector data are pipelined to ensure negligible deadtime up to a L1 rate of 100 kHz. After L1 triggering, data are transferred from the readout electronics of all subdetectors, through the readout network, to the high-level-trigger processor farm, which operates offline-quality reconstruction algorithms to decrease the event rate to around 0.5 kHz, before data storage.
The CMS experiment employs a highly distributed computing infrastructure, with a primary 0 centre at CERN, supplemented by seven 1, more than 50 2, and many Tier-3 centres at national laboratories and universities throughout the world. The CMS software running on this high-performance computing system executes numerous tasks, including the reconstruction and analysis of the collected data, as well as the generation and detailed detector simulation of Monte Carlo (MC) event samples.
3
Event reconstruction
The CMS “particle-flow” event description algorithm [35, 36] is used to reconstruct and identify each single particle with an optimized combination of all subdetector information. In this pro-cess, the identification of the particle (photon, electron, muon, charged hadron, neutral hadron) plays an important role in the determination of the particle momentum. The reconstructed par-ticles are henceforth referred to as objects.
Jets are reconstructed by clustering the particle-flow objects with the anti-kT algorithm [37] using a distance parameter of 0.5. Additional selection criteria are applied to each event to remove spurious features originating from isolated noise patterns in certain HCAL regions, and from anomalous signals caused by particles depositing energy in the silicon avalanche photodiodes used in the ECAL barrel region. The average number of pp interactions per LHC
bunch crossing is estimated to be about 9 and 19 in the 7 TeV (2011) and 8 TeV (2012) data sets, respectively. Energy from overlapping pp interactions (“pileup”), and from the underlying event, is subtracted using the FASTJETtechnique [38–40], which is based on the calculation of
the η-dependent transverse momentum density, evaluated on an event-by-event basis.
The jet momentum is determined as the vector sum of all particle momenta in the jet. Jet en-ergy corrections are derived from simulation studies and from in situ measurements using the energy balance of dijet and Z/γ+jet events [41]. These corrections are between 5% and 10% of the true momentum over the entire pT spectrum and detector acceptance. The jet momentum resolution achieved is σ(pT)/pT =85%/p pT/GeV⊕4% for central jets. A selection is applied to separate jets originating in the primary interaction from those due to energy deposits as-sociated with pileup. The discrimination is based on the differences in the jet shapes, in the relative multiplicity of charged and neutral components, and in the fraction of transverse mo-mentum carried by the hardest components. Within the tracker acceptance the jet tracks are also required to be consistent with originating at the primary vertex.
The missing transverse energy vector is taken as the negative vector sum of all particle trans-verse momenta, and its magnitude is referred to as EmissT . The typical missing transverse energy resolution is around 0.5√ΣETGeV [42], whereΣET is the scalar sum of all particle transverse momenta in GeV.
The energy deposited in the ECAL is clustered both with general clustering algorithms [43] and with algorithms that constrain the clusters in η and φ to the shapes expected from electrons and photons with high pT [44]. These specialised algorithms are used to cluster electromagnetic showers without any hypothesis regarding whether the particle originating from the interac-tion point was a photon or an electron; doing this for electrons from Z→ee events provides a measurement of the photon trigger, reconstruction, and identification efficiencies, as well as of the photon energy scale and resolution. The width of the reconstructed Z resonance is used to quantify the performance of the ECAL, using decays to two electrons whose energies are mea-sured using the ECAL alone, with only their directions being determined from the tracks. In the 7 TeV data set, the dielectron mass resolution at the Z boson mass is 1.56 GeV in the barrel and 2.57 GeV in the endcaps, while in the 8 TeV sample, reconstructed with preliminary calibration constants, the corresponding values are 1.61 and 3.75 GeV. For electrons, the reconstruction combines the clusters in the ECAL and the trajectory in the silicon tracker [45]. Trajectories in the tracker volume are reconstructed using a model of electron energy loss and fitted with a Gaussian sum filter [46]. The electron momentum is determined from the combination of ECAL and tracker measurements.
Muon candidates are reconstructed with two algorithms, one in which the tracks in the silicon detector are matched to segments in the muon chambers, and another in which a combined fit is performed to the signals found in both the silicon tracker and muon systems [43]. The efficiency to reconstruct a muon of pT > 5 GeV is larger than 95%, while the probability to misidentify a hadron as a muon is below 0.1%. For pT > 200 GeV the precision of the mo-mentum measurement improves when the silicon tracker signals are complemented with the information from the muon chambers.
Selection based on isolation of lepton and photon objects is used extensively. A requirement is placed on the scalar sum of the transverse momenta of the particles reconstructed within a distance∆Rmax of the object, sometimes normalised to the pT of the object. The distance∆R is defined as∆R = p(∆η)2+ (∆φ)2, where∆η and ∆φ are the pseudorapidity and azimuthal angle differences between the particle direction and the object direction. Typically∆Rmax is chosen to be 0.3 or 0.4.
5
The measurement of the integrated luminosity in CMS is based on a pixel cluster counting method, which exploits the large number of silicon pixels, and hence their low occupancy in a pp collision [47]. The cross section normalisation is derived from van der Meer scans [48]. The uncertainties in the luminosity measurements are 2.2% and 4.4% for the 7 TeV and 8 TeV data sets, respectively.
4
Searches for the standard model Higgs boson
Initial phenomenological discussions of Higgs boson production and decay can be found in Refs. [49–56]. Four main mechanisms are predicted for Higgs boson production in pp colli-sions: the gluon-gluon fusion mechanism, which has the largest cross section, followed in turn by vector-boson fusion (VBF), associated WH and ZH production (VH), and production in as-sociation with top quarks (ttH). The cross sections for the individual production mechanisms and the decay branching fractions, together with their uncertainties, have been computed fol-lowing Refs. [57–101] and are compiled in Refs. [23, 102].
The particular set of sensitive decay modes of the SM Higgs boson depends strongly on mH. The results presented in this paper are based on the five most sensitive decay modes in the low-mass region: H → γγ; H → ZZ followed by ZZ decays to 4`; H → WW followed by
decays to 2`2ν; H → ττfollowed by at least one leptonic τ decay; and H → bb followed by
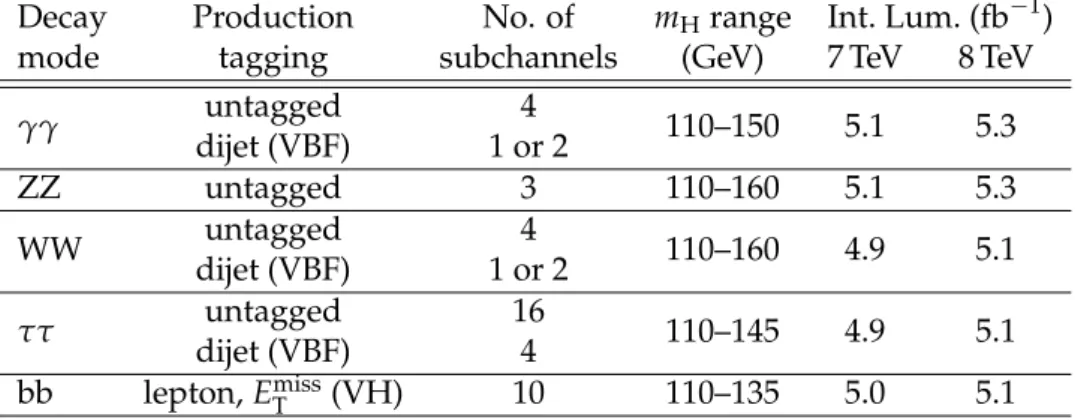
b-quark fragmentation into jets. This list is presented in Table 1 and comprises the full set of decay modes and subchannels, or categories, for which both the 7 and 8 TeV data sets have been analysed. Other lower sensitivity subchannels (ttH, H → bb; W/ZH, H → ττ; W/ZH,
H→WW→2`2ν; H→ZZ→2`2q) have also been studied, so far only in the 7 TeV data, and are not included here. Adding these analyses in the combination results in an improvement of 0.1 σ in the overall expected local significance at mH=125 GeV.
Table 1: Summary of the subchannels, or categories, used in the analysis of each decay mode.
Decay Production No. of mHrange Int. Lum. (fb−1)
mode tagging subchannels (GeV) 7 TeV 8 TeV
γγ untagged 4 110–150 5.1 5.3 dijet (VBF) 1 or 2 ZZ untagged 3 110–160 5.1 5.3 WW untagged 4 110–160 4.9 5.1 dijet (VBF) 1 or 2 ττ untagged 16 110–145 4.9 5.1 dijet (VBF) 4 bb lepton, ETmiss(VH) 10 110–135 5.0 5.1
For a given value of mH, the search sensitivity depends on the production cross section, the decay branching fraction into the chosen final state, the signal selection efficiency, the mass resolution, and the level of background from identical or similar final-state topologies.
Samples of MC events used to represent signal and background are fully simulated using
GEANT4 [103]. The simulations include pileup interactions matching the distribution of the
number of such interactions observed in data. The description of the Higgs boson signal is obtained from MC simulation using, for most of the decay modes and production processes, the next-to-leading-order (NLO) matrix-element generatorPOWHEG[104, 105], interfaced with
spectrum of the Higgs boson in the 7 TeV MC samples is reweighted to the next-to-next-to-leading-logarithmic (NNLL) + NLO distribution computed with HqT [71, 72, 107] and FE -HIPRO [108, 109], except in the H → ZZ analysis, where the effect is marginal. The
agree-ment of the pT spectrum in the simulation at 8 TeV with the NNLL + NLO distribution makes reweighting unnecessary. The improved agreement is due to a modification in the POWHEG
setup recommended in Ref. [102]. The simulation of associated-production signal samples
usesPYTHIA and all signal samples for H → bb are made using POWHEG interfaced toHER
-WIG++ [110]. Samples used for background studies are generated withPYTHIA,POWHEG, and MADGRAPH[111], and the normalisations are obtained from the best available NNLO or NLO calculations. The uncertainty in the signal cross section related to the choice of parton distribu-tion funcdistribu-tions is determined with the PDF4LHC prescripdistribu-tion [96–100].
The overall statistical methodology [112] used in this paper was developed by the CMS and ATLAS Collaborations in the context of the LHC Higgs Combination Group. A more concise summary of CMS usage in the search for a Higgs boson is given in Ref. [21]. The modified frequentist criterion CLs [113, 114] is used for the calculation of exclusion limits. Systematic uncertainties are incorporated as nuisance parameters and are treated according to the fre-quentist paradigm. The combination of searches requires simultaneous analysis of the data selected by all individual analyses, accounting for all statistical and systematic uncertainties and their correlations. The probability for a background fluctuation to be at least as large as the observed maximum excess is termed the local p-value, and that for an excess anywhere in a specified mass range the global p-value. This probability can be evaluated by generating sets of simulated data incorporating all correlations between analyses optimized for different Higgs boson masses. The global p-value (for the specified region) is greater than the local p-value, and this fact is often referred to as the look-elsewhere effect (LEE) [115]. Both the local and global p-values can be expressed as a corresponding number of standard deviations using the one-sided Gaussian tail convention. The magnitude of a possible Higgs boson signal is charac-terised by the production cross section times the relevant branching fractions, relative to the SM expectation, denoted σ/σSMand referred to as the signal strength. The results presented in this paper are obtained using asymptotic formulae [116], including updates recently introduced in the ROOSTATSpackage [117].
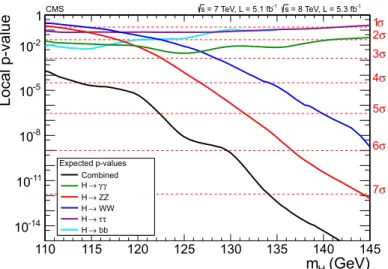
Figure 1 shows the expected local p-values in the mass range 110–145 GeV for the five decay modes reported here. The expected significance of a SM Higgs boson signal at mH = 125 GeV when the five decay modes are combined is 5.6 σ. The highest sensitivity in this mass range is achieved in the ZZ, γγ, and WW channels. Because of the excellent mass resolution (1–2 GeV) achieved in the γγ and ZZ channels, they play a special role in the low-mass region, where the natural width of the SM Higgs boson is predicted to be a few MeV. The expected signature in these channels is therefore a narrow resonance above background, with a width consistent with the detector resolution.
5
Decay modes with high mass resolution
5.1 H→
γγIn the H → γγ analysis a search is made for a narrow peak in the diphoton invariant mass
distribution in the range 110–150 GeV, on a large irreducible background from QCD production of two photons. There is also a reducible background where one or more of the reconstructed photon candidates originate from misidentification of jet fragments. Early detailed studies indicated this to be one of the most promising channels in the search for a SM Higgs boson in
5.1 H→γγ 7 (GeV) H m 110 115 120 125 130 135 140 145 Local p-value -14 10 -11 10 -8 10 -5 10 -2 10 1 1σ σ 2 σ 3 σ 4 σ 5 σ 6 σ 7 Expected p-values Combined γ γ → H ZZ → H WW → H τ τ → H bb → H Expected p-values Combined γ γ → H ZZ → H WW → H τ τ → H bb → H CMS s = 7 TeV, L = 5.1 fb-1 s = 8 TeV, L = 5.3 fb-1
Figure 1: Expected local p-values for a SM Higgs boson as a function of mH, for the decay modes γγ, ZZ, WW, ττ, and bb and their combination.
the low-mass range [118].
To enhance the sensitivity of the analysis, candidate diphoton events are separated into mutu-ally exclusive categories of different expected signal-to-background ratios, based on the prop-erties of the reconstructed photons and on the presence of two jets satisfying criteria aimed at selecting events in which a Higgs boson is produced through the VBF process. The analysis uses multivariate techniques for the selection and classification of the events. As an indepen-dent cross-check, an analysis is also performed that is almost iindepen-dentical to the one described in Ref. [24], using simpler criteria based on the properties of the reconstructed photons to select and classify events. The multivariate analysis achieves 15% higher sensitivity than the cross-check analysis.
The reconstructed primary vertex that most probably corresponds to the interaction vertex of the diphoton candidate is identified using the kinematic properties of the tracks associated with that vertex and their correlation with the diphoton kinematics. In addition, if either of the photons converts and the tracks from the conversion are reconstructed and identified, the direction of the converted photon contributes to the identification of the hard-scattering vertex. More details can be found in Ref. [24].
The event selection requires two photon candidates satisfying pT requirements and “loose” photon identification criteria. These photons must be reconstructed within the fiducial region,
|η| < 2.5, excluding the barrel-endcap transition region, 1.44< |η| <1.57. A pT threshold of
mγγ/3 (mγγ/4) is applied to the photon leading (subleading) in pT, where mγγis the diphoton invariant mass. Scaling the pTthresholds in this way avoids distortion of the shape of the mγγ distribution. In the case of events passing the dijet selection, the requirement on the leading photon is increased to mγγ/2, further reducing background with negligible loss of signal. Jet selection criteria are applied to the two jets of largest pT in the event within|η| < 4.7. The
jet selection requirements are optimized using simulated VBF signal and diphoton background events. The pT thresholds for the two jets are 30 and 20 GeV, and their η separation is required to be greater than 3.5. The dijet invariant mass is required to be greater than 350 and 250 GeV for the 7 and 8 TeV data sets, respectively. The lower dijet invariant mass requirement for the 8 TeV data set reflects the fact that for the analysis of that data set, the dijet event category is
divided into two to increase the search sensitivity. This division creates a second “tight” dijet-tagged category in which the dijet invariant mass must be greater than 500 GeV and both jets must have pT > 30 GeV. Two additional selection criteria, relating the dijet to the diphoton system, are applied: the difference between the average pseudorapidity of the two jets and the pseudorapidity of the diphoton system is required to be less than 2.5, and the difference in azimuthal angle between the diphoton system and the dijet system is required to be greater than 2.6 radians.
A multivariate regression is used to extract the photon energy and a photon-by-photon estimate of the uncertainty in that measurement. The calibration of the photon energy scale uses the Z boson mass as a reference; ECAL showers coming from electrons in Z→ee events are clustered and reconstructed in exactly the same way as photon showers. The photon selection efficiency, energy resolution, and associated systematic uncertainties are estimated from data, using Z→
ee events to derive data/simulation correction factors. The jet reconstruction efficiency, the efficiency to correctly locate the vertex position, and the trigger efficiency, together with the corresponding systematic uncertainties, are also evaluated from data.
For the multivariate analysis, a boosted decision tree (BDT) [119, 120] is trained to give a high output value (score) for signal-like events and for events with good diphoton invariant mass resolution, based on the following observables: (i) the photon quality determined from elec-tromagnetic shower shape and isolation variables; (ii) the expected mass resolution; (iii) the per-event estimate of the probability of locating the diphoton vertex within 10 mm of its true location along the beam direction; and (iv) kinematic characteristics of the photons and the diphoton system. The kinematic variables are constructed so as to contain no information about the invariant mass of the diphoton system. The diphoton events not satisfying the dijet selec-tion are classified into five categories based on the output of the BDT, with category boundaries optimized for sensitivity to a SM Higgs boson. Events in the category with smallest expected signal-to-background ratio are rejected, leaving four categories of events. Dijet-tagged events with BDT scores smaller than the threshold for the fourth category are also rejected. Simu-lation studies indicate that the background in the selected event categories is dominated by the irreducible background from QCD production of two photons and that fewer than 30% of the diphoton events used in the analysis contain one or more misidentified photons (predomi-nantly from γ+jet production).
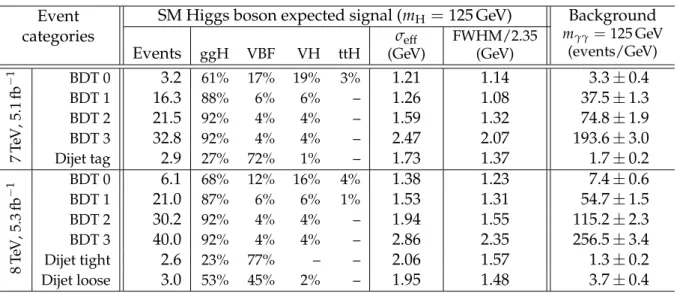
Table 2 shows the expected number of signal events in each event category for a SM Higgs boson (of mH = 125 GeV), and the background at mγγ = 125 GeV, estimated from the fit de-scribed below. The estimated mass resolution is also shown, measured both by σeff, half the minimum width containing 68% of the signal events, and by the full width at half maximum (FWHM). A large variation in the expected signal-to-background ratio between the categories can be seen, although as a consequence of the optimization of the category boundaries the ex-pected signal significances in each category are rather similar. The differences in the relative signal-to-background ratio between the categories are almost independent of mH.
The background is estimated from data, without the use of MC simulation, by fitting the dipho-ton invariant mass distribution in each of the categories in a range (100 < mγγ < 180 GeV) extending slightly above and below that in which the search is performed. The choices of the function used to model the background and of the fit range are made based on a study of the possible bias in the measured signal strength. Polynomial functions are used. The degree is chosen by requiring that the potential bias be at least a factor of 5 smaller than the statistical accuracy of the fit prediction. The required polynomial degree ranges from 3 to 5.
5.1 H→γγ 9
Table 2: Expected numbers of SM Higgs boson events (mH = 125 GeV) and estimated back-ground (at mγγ = 125 GeV) for all event categories of the 7 and 8 TeV data sets. There are two dijet-tagged categories for the 8 TeV data as described in the text, and for both data sets the remaining untagged events are separated into four categories labelled here BDT 0–3, BDT 0 having the largest expected signal-to-background ratio. The composition of the SM Higgs boson signal in terms of the production processes, and its mass resolution, are also given.
Event categories
SM Higgs boson expected signal (mH=125 GeV) Background
mγγ=125 GeV (events/GeV) Events ggH VBF VH ttH σeff (GeV) FWHM/2.35 (GeV) 7 T eV, 5.1 fb − 1 BDT 0 3.2 61% 17% 19% 3% 1.21 1.14 3.3±0.4 BDT 1 16.3 88% 6% 6% – 1.26 1.08 37.5±1.3 BDT 2 21.5 92% 4% 4% – 1.59 1.32 74.8±1.9 BDT 3 32.8 92% 4% 4% – 2.47 2.07 193.6±3.0 Dijet tag 2.9 27% 72% 1% – 1.73 1.37 1.7±0.2 8 T eV, 5.3 fb − 1 BDT 0 6.1 68% 12% 16% 4% 1.38 1.23 7.4±0.6 BDT 1 21.0 87% 6% 6% 1% 1.53 1.31 54.7±1.5 BDT 2 30.2 92% 4% 4% – 1.94 1.55 115.2±2.3 BDT 3 40.0 92% 4% 4% – 2.86 2.35 256.5±3.4 Dijet tight 2.6 23% 77% – – 2.06 1.57 1.3±0.2 Dijet loose 3.0 53% 45% 2% – 1.95 1.48 3.7±0.4
using a different approach to the background modelling. Its sensitivity is very similar to that of the standard analysis. It employs a fit to the output of an additional BDT that takes as input the diphoton invariant mass and the diphoton BDT output, and uses a background model derived from the sidebands of the invariant-mass distribution. A fit to the diphoton invariant-mass distribution is used to obtain the background normalisation. This fit is of a power law and excludes a window of width±2%×mHaround the mass hypothesis. The methodology allows a systematic uncertainty to be assigned to the fit shape.
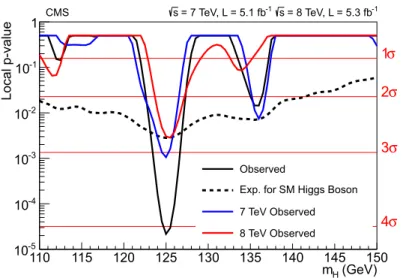
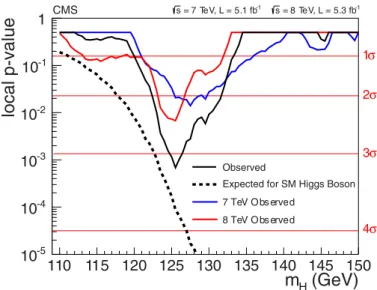
The expected 95% CL upper limit on the signal strength σ/σSM, in the background-only hy-pothesis, for the combined 7 and 8 TeV data, is less than 1.0 in the range 110<mH <140 GeV, with a value of 0.76 at mH= 125 GeV. The observed limit indicates the presence of a significant excess at mH= 125 GeV in both the 7 and 8 TeV data. The features of the observed limit are con-firmed by the independent sideband-background-model and cross-check analyses. The local p-value is shown as a function of mHin Fig. 2 for the 7 and 8 TeV data, and for their combina-tion. The expected (observed) local p-value for a SM Higgs boson of mass 125 GeV corresponds to 2.8(4.1)σ. In the sideband-background-model and cross-check analyses, the observed local
p-values for mH=125 GeV correspond to 4.6 and 3.7 σ, respectively. The best-fit signal strength for a SM Higgs boson mass hypothesis of 125 GeV is σ/σSM=1.6±0.4.
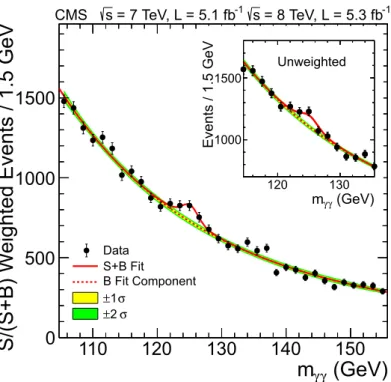
In order to illustrate, in the mγγdistribution, the significance given by the statistical methods, it is necessary to take into account the large differences in the expected signal-to-background ra-tios of the event categories shown in Table 2. The events are weighted according to the category in which they fall. A weight proportional to S/(S+B)is used, as suggested in Ref. [121], where S and B are the number of signal and background events, respectively, calculated from the si-multaneous signal-plus-background fit to all categories (with varying overall signal strength) and integrating over a 2σeffwide window, in each category, centred on 125 GeV. Figure 3 shows the data, the signal model, and the background model, all weighted. The weights are nor-malised such that the integral of the weighted signal model matches the number of signal
events given by the best fit. The unweighted distribution, using the same binning but in a more restricted mass range, is shown as an inset. The excess at 125 GeV is evident in both the weighted and unweighted distributions.
(GeV) H m 110 115 120 125 130 135 140 145 150 Local p-value -5 10 -4 10 -3 10 -2 10 -1 10 1 σ 1 σ 2 σ 3 σ 4 Observed
Exp. for SM Higgs Boson 7 TeV Observed 8 TeV Observed -1 = 8 TeV, L = 5.3 fb s -1 = 7 TeV, L = 5.1 fb s CMS
Figure 2: The local p-value as a function of mHin the γγ decay mode for the combined 7 and 8 TeV data sets. The additional lines show the values for the two data sets taken individually. The dashed line shows the expected local p-value for the combined data sets, should a SM Higgs boson exist with mass mH.
5.2 H
→
ZZIn the H → ZZ→ 4`decay mode a search is made for a narrow four-lepton mass peak in the presence of a small continuum background. Early detailed studies outlined the promise of this mode over a wide range of Higgs boson masses [122]. Only the search in the range 110–160 GeV is reported here. Since there are differences in the reducible background rates and mass resolu-tions between the subchannels 4e, 4µ, and 2e2µ, they are analysed separately. The background sources include an irreducible four-lepton contribution from direct ZZ production via qq and gluon-gluon processes. Reducible contributions arise from Z+bb and tt production where the final states contain two isolated leptons and two b-quark jets producing secondary leptons. Additional background arises from Z+jets and WZ+jets events where jets are misidentified as leptons. Compared to the analysis reported in Ref. [25], the present analysis employs improved muon reconstruction, improved lepton identification and isolation, and a kinematic discrimi-nant exploiting the decay kinematics expected for the signal events. An algorithm to recover final-state radiation (FSR) photons has also been deployed.
Electrons are required to have pT > 7 GeV and|η| < 2.5. The corresponding requirements for muons are pT > 5 GeV and |η| < 2.4. Electrons are selected using a multivariate identifier
trained using a sample of W+jets events, and the working point is optimized using Z+jets events. Both muons and electrons are required to be isolated. The combined reconstruction and selection efficiency is measured using electrons and muons in Z boson decays. Muon reconstruction and identification efficiency for muons with pT <15 GeV is measured using J/ψ decays.
The electron or muon pairs from Z boson decays are required to originate from the same pri-mary vertex. This is ensured by requiring that the significance of the impact parameter with
5.2 H→ZZ 11
(GeV)
γ γm
110
120
130
140
150
S/
(S
+B
) W
ei
ghted
Events
/ 1
.5 GeV
0
500
1000
1500
Data S+B Fit B Fit Component σ 1 ± σ 2 ± -1 = 8 TeV, L = 5.3 fb s -1 = 7 TeV, L = 5.1 fb s CMS (GeV) γ γ m 120 130 Events / 1.5 GeV1000 1500 UnweightedFigure 3: The diphoton invariant mass distribution with each event weighted by the S/(S+B)
value of its category. The lines represent the fitted background and signal, and the coloured bands represent the±1 and±2 standard deviation uncertainties in the background estimate. The inset shows the central part of the unweighted invariant mass distribution.
respect to the event vertex satisfy |SIP| < 4 for each lepton, where SIP = I/σI, I is the three-dimensional lepton impact parameter at the point of closest approach to the vertex, and σI its uncertainty.
Final-state radiation from the leptons is recovered and included in the computation of the lepton-pair invariant mass. The FSR recovery is tuned using simulated samples of ZZ → 4`
and tested on data samples of Z boson decays to electrons and muons. Photons reconstructed within|η| <2.4 are considered as possibly due to FSR. The photons must satisfy the following
requirements. They must be within∆R< 0.07 of a muon and have pγ
T > 2 GeV (most photon showers within this distance of an electron having already been automatically clustered with the electron shower); or if their distance from a lepton is in the range 0.07 < ∆R < 0.5, they must satisfy pγ
T > 4 GeV, and be isolated within∆R = 0.3. Such photon candidates are com-bined with the lepton if the resulting three-body invariant mass is less than 100 GeV and closer to the Z boson mass than the mass before the addition of the photon.
The event selection requires two pairs of same-flavour, oppositely charged leptons. The pair with invariant mass closest to the Z boson mass is required to have a mass in the range 40– 120 GeV and the other pair is required to have a mass in the range 12–120 GeV. The ZZ back-ground is evaluated from MC simulation studies. Two different approaches are employed to estimate the reducible and instrumental backgrounds from data. Both start by selecting events in a background control region, well separated from the signal region, by relaxing the isolation and identification criteria for two same-flavour reconstructed leptons. In the first approach, the additional pair of leptons is required to have the same charge (to avoid signal contamination) while in the second, two opposite-charge leptons failing the isolation and identification criteria are required. In addition, a control region with three passing leptons and one failing lepton is used to estimate contributions from backgrounds with three prompt leptons and one misiden-tified lepton. The event rates measured in the background control region are extrapolated to the signal region using the measured probability for a reconstructed lepton to pass the isola-tion and identificaisola-tion requirements. This probability is measured in an independent sample. Within uncertainties, comparable background counts in the signal region are estimated by both methods.
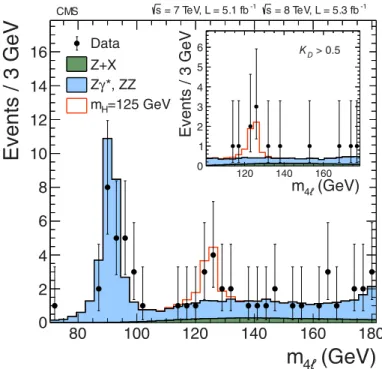
The number of selected ZZ → 4` candidate events in the mass range 110 < m4` < 160 GeV, in each of the three final states, is given in Table 3, where m4` is the four-lepton invariant mass. The number of predicted background events, in each of the three final states, and their uncertainties are also given, together with the number of signal events expected from a SM Higgs boson of mH = 125 GeV. The m4` distribution is shown in Fig. 4. There is a clear peak at the Z boson mass where the decay Z →4`is reconstructed. This feature of the data is well reproduced by the background estimation. The figure also shows an excess of events above the expected background around 125 GeV. The total background and the numbers of events observed in the three bins where an excess is seen are also shown in Table 3. The combined signal reconstruction and selection efficiency, with respect to the mH = 125 GeV generated signal with m`` >1 GeV as the only cut, is 18% for the 4e channel, 40% for the 4µ channel, and 27% for the 2e2µ channel.
The kinematics of the H→ ZZ→ 4`process in its centre-of-mass frame, for a given invariant mass of the four-lepton system, is fully described by five angles and the invariant masses of the two lepton pairs [123–125]. These seven variables provide significant discriminating power between signal and background. The momentum of the ZZ system may further differentiate signal from background, but would introduce dependence on the production mechanism, and on the modelling of the QCD effects, and is therefore not considered here. A kinematic
discrim-5.2 H→ZZ 13
(GeV)
ℓ 4m
80 100 120 140 160 180Events / 3 GeV
0 2 4 6 8 10 12 14 16 Data Z+X *, ZZ γ Z =125 GeV H m CMS s = 7 TeV, L = 5.1 fb-1 s = 8 TeV, L = 5.3 fb-1 (GeV) ℓ 4 m 120 140 160 Events / 3 GeV 0 1 2 3 4 5 6 KD > 0.5Figure 4: Distribution of the four-lepton invariant mass for the ZZ → 4` analysis. The points represent the data, the filled histograms represent the background, and the open his-togram shows the signal expectation for a Higgs boson of mass mH = 125 GeV, added to the background expectation. The inset shows the m4` distribution after selection of events with KD >0.5, as described in the text.
Table 3: The number of selected events, compared to the expected background yields and ex-pected number of signal events (mH =125 GeV) for each final state in the H→ZZ analysis. The estimates of the Z+X background are based on data. These results are given for the mass range from 110 to 160 GeV. The total background and the observed numbers of events are also shown for the three bins (“signal region”) of Fig. 4 where an excess is seen (121.5<m4` <130.5 GeV).
Channel 4e 4µ 2e2µ 4`
ZZ background 2.7±0.3 5.7±0.6 7.2±0.8 15.6±1.4
Z+X 1.2+1.1−0.8 0.9+0.7−0.6 2.3+1.8−1.4 4.4+2.2−1.7
All backgrounds(110<m4`<160 GeV) 4.0±1.0 6.6±0.9 9.7±1.8 20±3
Observed(110<m4`<160 GeV) 6 6 9 21
Signal(mH=125 GeV) 1.36±0.22 2.74±0.32 3.44±0.44 7.54±0.78 All backgrounds(signal region) 0.7±0.2 1.3±0.1 1.9±0.3 3.8±0.5
inant is constructed based on the probability ratio of the signal and background hypotheses, KD = Psig/(Psig+ Pbkg), as described in Ref. [126]. The likelihood ratio is defined for each value of m4`. For the signal, the phase-space and Z propagator terms [127] are included in a fully analytic parameterization [124], while the background probability is tabulated using a simulation of the qq → ZZ/Zγ process. The statistical analysis only includes events with m4` >100 GeV.
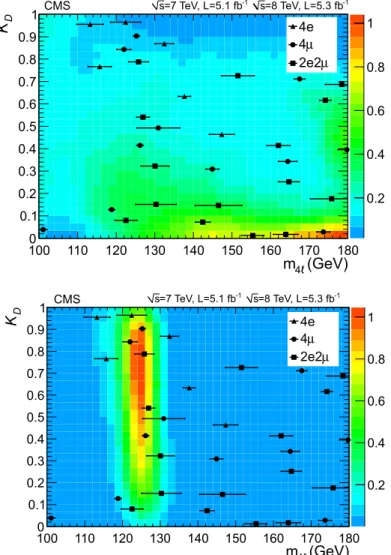
Figure 5 (upper) shows the distribution of KD versus m4` for events selected in the 4` sub-channels. The colour-coded regions show the expected background. Figure 5 (lower) shows the same two-dimensional distribution of events, but this time superimposed on the expected event density from a SM Higgs boson (mH = 125 GeV). A clustering of events is observed around 125 GeV with a large value of KD, where the background expectation is low and the signal expectation is high, corresponding to the excess seen in the one-dimensional mass dis-tribution. The m4`distribution of events satisfying KD >0.5 is shown in the inset in Fig. 4. There are three final states and two data sets (7 and 8 TeV), and thus the statistical treatment requires six simultaneous two-dimensional maximum-likelihood fits for each value of mH, in the variables m4` and KD. Systematic uncertainties are evaluated from data for the trigger efficiency and for the combined lepton reconstruction, identification, and isolation efficiencies, as described in [128]. Systematic uncertainties in the energy/momentum calibration and in the energy resolution are estimated from data. Additional systematic uncertainties arise from limited statistical precision in the reducible background control regions.
The expected 95% CL upper limit on the signal strength σ/σSM, in the background-only hy-pothesis, for the combined 7 and 8 TeV data, falls steeply between 110 and 140 GeV, and has a value of 0.6 at mH =125 GeV. The observed upper limit indicates the presence of a significant excess in the range 120 < mH < 130 GeV. The local p-value is shown as a function of mH in Fig. 6 for the 7 and 8 TeV data, and for their combination. The minimum local p-value in the data occurs at mH = 125.6 GeV and has a significance of 3.2 σ (expected 3.8 σ). The combined best-fit signal strength for a SM Higgs boson mass hypothesis of 125.6 GeV is σ/σSM=0.7+0.4−0.3.
6
Decay modes with low mass resolution
6.1 H
→
WWThe decay mode H →WW is highly sensitive to a SM Higgs boson in the mass range around the WW threshold of 160 GeV. With the development of tools for lepton identification and ETmissreconstruction optimized for LHC pileup conditions, it is possible to extend the sensitiv-ity down to 120 GeV. This decay mode is analysed by selecting events in which both W bosons decay leptonically, resulting in a signature with two isolated, oppositely charged leptons (elec-trons or muons) and large EmissT due to the undetected neutrinos [129, 130]. A pT threshold of 20 (10) GeV is applied to the lepton leading (subleading) in pT. The analysis of the 7 TeV data is described in Ref. [26] and remains unchanged, while the 8 TeV analysis was modified to cope with more difficult conditions induced by the higher pileup of the 2012 data taking.
Events are classified according to the number of jets (0, 1, or 2) with pT > 30 GeV and within
|η| <4.7 (|η| <5.0 for the 7 TeV data set), and further separated into same-flavour (ee and µµ)
or different-flavour (eµ) categories. Events with more than two jets are rejected. To improve the sensitivity of the analysis, the selection criteria are optimized separately for the different event categories since they are characterised by different dominating backgrounds. The zero-jet eµ category has the best signal sensitivity. Its main backgrounds are irreducible nonresonant WW
6.1 H→WW 15 (GeV) 4ℓ m 100 110 120 130 140 150 160 170 180 D K 0 0.1 0.2 0.3 0.4 0.5 0.6 0.7 0.8 0.9 1 0.2 0.4 0.6 0.8 1 4e µ 4 µ 2e2 CMS s=7 TeV, L=5.1 fb-1 s=8 TeV, L=5.3 fb-1 (GeV) 4ℓ m 100 110 120 130 140 150 160 170 180 D K 0 0.1 0.2 0.3 0.4 0.5 0.6 0.7 0.8 0.9 1 0.2 0.4 0.6 0.8 1 4e µ 4 µ 2e2 CMS s=7 TeV, L=5.1 fb-1 s=8 TeV, L=5.3 fb-1
Figure 5: The distribution of events selected in the 4`subchannels for the kinematic discrim-inant KD versus m4`. Events in the three final states are marked by filled symbols (defined in the legend). The horizontal error bars indicate the estimated mass resolution. In the upper plot the coded regions show the background expectation; in the lower plot the colour-coded regions show the event density expected from a SM Higgs boson (mH= 125 GeV) (both in arbitrary units).
(GeV) H m 110 115 120 125 130 135 140 145 150 local p-value -5 10 -4 10 -3 10 -2 10 -1 10 1 CMS s = 7 TeV, L = 5.1 fb-1 s = 8 TeV, L = 5.3 fb-1 σ 1 σ 2 σ 3 σ 4 Observed
Expected for SM Higgs Boson 7 TeV Obs erved
8 TeV Obs erved
Figure 6: The observed local p-value for the ZZ decay mode as a function of the SM Higgs boson mass. The dashed line shows the expected local p-values for a SM Higgs boson with a mass mH.
production and reducible W+jets processes, where a jet is misidentified as a lepton. The one-jet eµ and zero-jet same-flavour categories only contribute to the signal sensitivity at the 10% level because of larger backgrounds, from top-quark decays and Drell–Yan production, respectively. Event selection in the two-jet category is optimized for the VBF production mechanism. This category has the highest expected signal-to-background ratio, but its contribution to the overall sensitivity is small owing to the lower cross section relative to inclusive production.
The projected Emiss
T variable [26] is used to reduce the Drell–Yan background arising from events where the ETmissvector is aligned with the lepton pT, as well as events with mismeasured ETmiss associated with poorly reconstructed leptons and jets. The projected EmissT is defined as the transverse component of the EmissT vector with respect to the closest lepton direction, if it is closer than π/2 in azimuthal angle, or the full ETmiss otherwise. Since pileup degrades the projected ETmiss resolution, the minimum of two different projected ETmiss definitions is used: the first includes all particle candidates in the event, while the second uses only the charged particle candidates associated with the primary vertex. In the 8 TeV analysis, the minimum projected Emiss
T defined in this way is then required to be above a threshold that varies by cate-gory. For mH>140 GeV, projected ETmissis required to be greater than 20 GeV in the eµ channel, and greater than 45 GeV in the same-flavour channels. For mH ≤ 140 GeV in the same-flavour channels, where it is more difficult to separate the signal from the Drell–Yan background, a multivariate selection is used, combining kinematic and topological variables. In the two-jet category, a simple selection of EmissT >45 GeV is applied. To further reduce the Drell–Yan back-ground in the same-flavour final states, events with a dilepton mass within 15 GeV of the Z boson mass are rejected. The background from low-mass resonances is rejected by requiring a dilepton invariant mass greater than 12 GeV.
To suppress the top-quark background, a “top tagging” technique based on soft-muon and b-jet tagging is applied. The first method is designed to veto events containing muons from b b-jets coming from decays of top quarks. The second method uses a b-jet tagging algorithm, which looks within jets for tracks with large impact parameters. The algorithm is applied also in the case of zero-jet events, which may contain low-pT jets below the selection threshold. To reduce
6.2 H→ττ 17
the background from WZ production, events with a third lepton passing the identification and isolation requirements are rejected.
Yields for the dominant backgrounds are estimated using control regions in the data. The W+jets contribution is derived from data using a “tight-loose” sample in which one lepton passes the standard criteria and the other does not, but instead satisfies a “loose” set of require-ments. The efficiency eloose for a jet that satisfies the loose selection to pass the tight selection is determined using data from an independent loose lepton-trigger sample dominated by jets. The background contamination is then estimated using the events of the “tight-loose” sample weighted by eloose/(1−eloose). The normalisation of the top-quark background is estimated by counting the number of top-tagged events and applying the corresponding top-tagging effi-ciency. The nonresonant WW contribution is normalised by using events with a dilepton mass larger than 100 GeV, where the Higgs boson signal contamination is negligible, extrapolated to the signal region using simulated samples. The same-flavour Drell–Yan background is nor-malised using the number of events observed with a dilepton mass within 7.5 GeV of the Z boson mass, after subtracting the non-Drell–Yan contribution. Other minor backgrounds from WZ, ZZ, and Wγ are estimated from simulation.
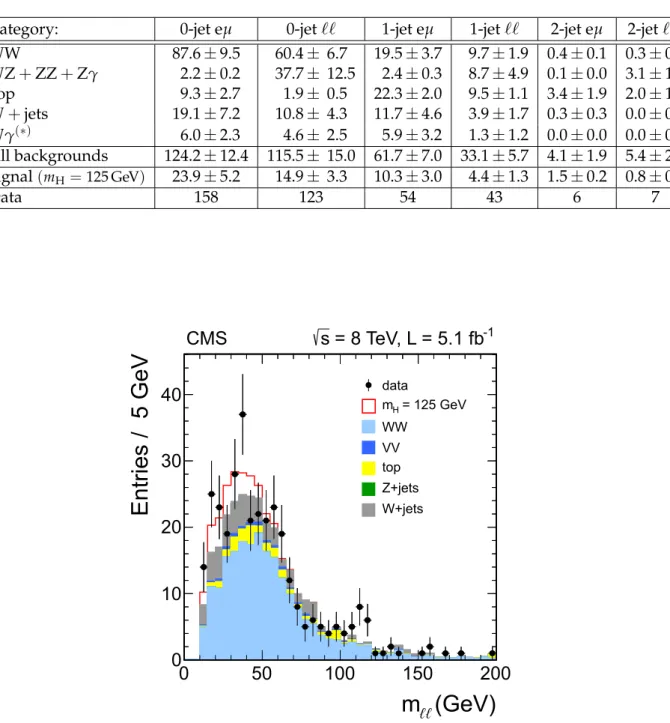
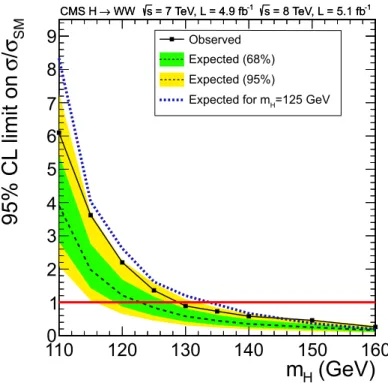
The 7 TeV data are analysed by training a BDT for each Higgs boson mass hypothesis in the zero-jet and one-jet event categories, while a simple selection strategy is employed in the VBF category [26]. In the BDT analysis, the Higgs boson signal is separated from the background by using a binned maximum-likelihood fit to the classifier distribution. The 8 TeV analysis is based on a simple selection strategy optimized for each mass hypothesis, where additional kinematic and topological requirements are applied to improve the signal-to-background ratio. One of the most sensitive variables to discriminate between H → WW decays and nonresonant WW production is the dilepton invariant mass m``. This quantity is shown in Fig. 7 for the zero-jet eµ category after the full selection for mH=125 GeV, except for the selection on m``itself. Table 4 shows for the 8 TeV analysis the number of events selected in data, background estimates, and signal predictions for mH = 125 GeV in each analysis category after applying all the selection requirements. About 97% of the signal events selected in the zero-jet eµ category are expected to be produced by the gluon-gluon fusion process, whereas 83% of the signal in the two-jet eµ category is expected to be produced by the VBF process. The 95% CL expected and observed limits for the combination of the 7 and 8 TeV analyses are shown in Fig. 8. A broad excess is observed that is consistent with a SM Higgs boson of mass 125 GeV. This is illustrated by the dotted curve in Fig. 8 showing the median expected limit in the presence of a SM Higgs boson with mH =125 GeV. The expected significance for a SM Higgs of mass 125 GeV is 2.4 σ and the observed significance is 1.6 σ.
6.2 H
→
ττThe decay mode H → ττis searched for in four exclusive subchannels, corresponding to
dif-ferent decays of the τ pair: eµ, µµ, eτh, and µτh, where electrons and muons arise from leptonic
τdecays, and τhdenotes hadronic τ decays. The latter are reconstructed by selecting τ decays consistent with the hypothesis of three charged pions, or one charged pion and up to two neu-tral pions [131]. The search is made in the mass range 110–145 GeV, and a signal should appear as a broad excess in the distribution of the τ-pair invariant mass mττ.
The sensitivity of the search is improved by classifying the events according to jet multiplicity and the transverse momentum of the reconstructed τ. The multiplicity of jets with pT>30 GeV reflects the production mechanism: events with zero or one jet are likely to come from the gluon-gluon fusion process, while events with two jets are candidates for VBF production.
Table 4: Observed number of events, background estimates, and signal predictions for mH = 125 GeV in each category of the WW analysis of the 8 TeV data set. All the selection require-ments have been applied. The combined experimental and theoretical, systematic and statis-tical uncertainties are shown. The Zγ process includes the dimuon, dielectron, and ττ → ``
final states.
Category: 0-jet eµ 0-jet`` 1-jet eµ 1-jet`` 2-jet eµ 2-jet``
WW 87.6±9.5 60.4± 6.7 19.5±3.7 9.7±1.9 0.4±0.1 0.3±0.1 WZ+ZZ+Zγ 2.2±0.2 37.7± 12.5 2.4±0.3 8.7±4.9 0.1±0.0 3.1±1.8 Top 9.3±2.7 1.9± 0.5 22.3±2.0 9.5±1.1 3.4±1.9 2.0±1.2 W+jets 19.1±7.2 10.8± 4.3 11.7±4.6 3.9±1.7 0.3±0.3 0.0±0.0 Wγ(∗) 6.0±2.3 4.6± 2.5 5.9±3.2 1.3±1.2 0.0±0.0 0.0±0.0 All backgrounds 124.2±12.4 115.5± 15.0 61.7±7.0 33.1±5.7 4.1±1.9 5.4±2.2 Signal(mH =125 GeV) 23.9±5.2 14.9± 3.3 10.3±3.0 4.4±1.3 1.5±0.2 0.8±0.1 Data 158 123 54 43 6 7
(GeV)
ℓℓm
0
50
100
150
200
Entries / 5 GeV
0
10
20
30
40
data = 125 GeV H m WW VV top Z+jets W+jetsCMS
s
= 8 TeV, L = 5.1 fb
-1Figure 7: Distribution of m`` for the zero-jet eµ category in the H → WW search at 8 TeV. The signal expected from a Higgs boson with a mass mH = 125 GeV is shown added to the background.
6.2 H→ττ 19
(GeV)
Hm
110
120
130
140
150
160
SMσ/
σ
95%
C
L
lim
it
on
0
1
2
3
4
5
6
7
8
9
WW → CMS H s = 7 TeV, L = 4.9 fb-1 s = 8 TeV, L = 5.1 fb-1 Observed Expected (68%) Expected (95%)Expected for mH=125 GeV
WW →
CMS H s = 7 TeV, L = 4.9 fb-1 s = 8 TeV, L = 5.1 fb-1
Figure 8: The 95% CL limit on σ/σSM for a Higgs boson decaying, via a W boson pair, to two leptons and two neutrinos, for the combined 7 and 8 TeV data sets. The symbol σ/σSM denotes the production cross section times the relevant branching fractions, relative to the SM expectation. The background-only expectations are represented by their median (dashed line) and by the 68% and 95% CL bands. The dotted curve shows the median expected limit for a SM Higgs boson with mH=125 GeV.
Events including b jets with pT > 20 GeV are removed from zero- and one-jet categories. The signal purities in the zero- and one-jet categories are increased, and the mττ resolution is im-proved, by separating events into low- and high-pT subchannels. The high-pTsubchannels are defined by pτh
T > 40 GeV in channels with a hadronic τ decay, and p µ
T > 35(30)GeV in the eµ(µµ)channel. The mass mττ is reconstructed with an algorithm [132] combining the visible
τ decay products and the missing transverse energy, achieving a resolution of about 20% on
mττ. Figure 9 shows as an example the reconstructed mττdistribution in the µτhVBF category for the combined 7 and 8 TeV data samples.
(GeV)
τ τm
0
100
200
300
Events/GeV
0
1
2
3
4
5
CMS s = 7 TeV, L = 4.9 fb-1 s = 8 TeV, L = 5.1 fb-1 =125 GeV H m observed τ τ → Z Top electroweak QCDFigure 9: Distribution of mττ in the combined 7 and 8 TeV data sets for the µτhVBF category of the H → ττsearch. The signal expected from a SM Higgs boson (mH = 125 GeV) is added to the background.
Backgrounds in the eµ and µµ channels arise from tt and Drell–Yan production, while W and Z production with a misidentified τhcandidate from an electron, muon, or jet dominates in the hadronic channels. Backgrounds from Z → ττ decays are modelled with Z → µµ events in
data where each muon is replaced with particles from simulated decays of a τ with the same momentum as the muon. Reducible backgrounds, comprising W+jets, QCD multijet produc-tion, and residual Z → ee events, are estimated from the data [27]. An improved signal-to-background ratio is achieved by including explicitly in the event selection for the VBF produc-tion mechanism the pseudorapidity separaproduc-tion between forward jets and the large invariant mass of the dijet system. Table 5 shows the numbers of expected and observed events in the most sensitive event categories (VBF) for the 7 and 8 TeV data sets. The expected signal yields for a SM Higgs boson with mH=125 GeV are also shown.
To search for the presence of a Higgs boson signal in the selected events, a binned maximum-likelihood fit to mττ is performed jointly across the four final states, each with five event cate-gories. Systematic uncertainties are represented by nuisance parameters in the fitting process. The expected and observed 95% CL limits on the signal strength for the combination of all cat-egories are shown in Fig. 10. The expected and observed limits are 1.3 and 1.1 times the SM
6.2 H→ττ 21
Table 5: Numbers of expected and observed events in the most sensitive event categories (VBF) in the H→ττanalysis for the 7 and 8 TeV data sets. The expected signal yields for a SM Higgs
boson with mH = 125 GeV are also shown. Combined statistical and systematic uncertainties in each estimate are reported.
Subchannel eτh µτh eµ µµ
Z→ττ 53 ± 5 100± 9 56 ± 12 5.3 ± 0.4 QCD 35 ± 7 41 ± 9 7.4 ± 1.4 − W+jets 46 ± 10 72 ± 15 − − Z+jets 13 ± 2 2.5 ± 0.6 − − Z→µµ − − − 70 ± 8 tt 7.0 ± 1.7 14 ± 3 24 ± 2 6.7 ± 1.5 Dibosons 1.2 ± 0.9 2.9 ± 2.1 11 ± 2 2.4 ± 0.9 All backgrounds 156± 13 233± 20 99 ± 13 85 ± 9 Signal(mH =125 GeV) 4.3 ± 0.6 7.7 ± 1.1 3.5 ± 0.4 0.8 ± 0.1 Data 142 263 110 83
(GeV)
Hm
110 115 120 125 130 135 140 145
SMσ
/
σ
9
5
%
C
L
l
im
it
o
n
0
1
2
3
4
5
6
7
8
Observed Expected (68%) Expected (95%) = 125 GeV H Exp. for SM m Observed Expected (68%) Expected (95%) = 125 GeV H Exp. for SM m τ τ → CMS H s = 7 TeV, L = 4.9 fb-1 s = 8 TeV, L = 5.1 fb-1 Observed Expected (68%) Expected (95%) = 125 GeV H Exp. for SM m τ τ → CMS H s = 7 TeV, L = 4.9 fb-1 s = 8 TeV, L = 5.1 fb-1Figure 10: The 95% CL limit on the signal strength σ/σSMfor a Higgs boson decaying to τ pairs, for the combined 7 and 8 TeV data sets. The symbol σ/σSMdenotes the production cross section times the relevant branching fractions, relative to the SM expectation. The background-only expectations are represented by their median (dashed line) and by the 68% and 95% CL bands. The dotted curve shows the median expected limit for a SM Higgs boson with mH =125 GeV.
Higgs boson cross section at mass 125 GeV, respectively. The expected significance for a SM Higgs boson of mass 125 GeV is 1.4 σ, and the observed value is zero.
6.3 H
→
bbFor mH ≤ 135 GeV, the decay H → bb has the largest branching fraction of the five search modes, but the inclusive signal is overwhelmed by QCD production of bottom quarks. The analysis is therefore designed to search for the associated production of the Higgs boson in events where a dijet resonance is produced at high pT in association with a W or Z boson; this largely suppresses the QCD background. Five independent search channels are explored corresponding to different decays of the vector boson: Z(``)H, Z(νν)H, and W(`ν)H. Events
are further separated into two categories based on the pT of the vector boson, ranging from 50–100 GeV for the lowest bin in the Z(``)search, to greater than 170 GeV for the highest bin in the W(`ν)search. For the Z(νν)search, two subchannels are defined as 120<ETmiss<160 GeV
and Emiss
T >160 GeV. The two jets comprising the candidate Higgs boson decay are required to be identified as b jets, and the dijet system must satisfy a pTthreshold that is optimized within each channel: greater than 120 GeV for WH, 160 GeV for Z(νν)H, and no explicit threshold for
Z(``)H.
Dominant backgrounds arise from production of vector bosons in association with jets, pair- or single-production of top quarks, and diboson production (WW, WZ, ZZ) with one of the bosons decaying hadronically. Significant background rejection is achieved in general by requiring large pTfor the dijet, while also requiring that there be minimal additional jet activity and that the vector boson and dijet be back to back in azimuth. The effect on the signal efficiency of this selection due to higher-order electroweak [133] and QCD [91] corrections are accounted for in the systematic uncertainties. Further signal discrimination is obtained from the dijet invariant mass, which is expected to peak near mH. A multivariate regression algorithm to better estimate b-jet pT is trained on jets in simulated signal events and achieves a final dijet mass resolution of 8–9% for mH = 125 GeV. The performance of the regression algorithm is checked in data using W/Z+jets and tt events.
A search for the signal is made in the distribution of scores of a BDT trained at discrete mass points. Input variables to the BDT algorithm exploit kinematic and topological information about the vector boson and dijet systems, and the colour-singlet nature of the Higgs boson [134]. The distribution of scores in simulated background events is checked using control regions in the data designed to enrich individual background contributions. Figure 11 shows as an exam-ple the BDT scores for the high-pTsubchannel of the Z(νν)H channel in the 8 TeV data set, after
all selection criteria have been applied.
The rates for the dominant backgrounds arising from production of W/Z+jets and top-quark pairs are estimated in data [28], while contributions from single-top and diboson production are estimated from simulation studies. The signal is then searched for as an excess in the BDT score distribution using the predicted shapes for signal and background events, for Higgs bo-son masses in the range 110–135 GeV.
Combined results for expected and observed 95% CL limits obtained from the 7 and 8 TeV data sets are displayed in Fig. 12. The expected and observed limits are 1.6 and 2.1 times the SM Higgs boson cross section at mass 125 GeV. The expected local p-value for a SM Higgs of mass 125 GeV corresponds to 1.9 σ, while the observed value corresponds to 0.7 σ.
6.3 H→bb 23
BDT score
-1
-0.8
-0.6
-0.4
-0.2
0
0.2
Events/ 0.1
-110
1
10
210
310
410
Data VH(125) V+bjets V+non-bjets top VV -1 = 8 TeV, L = 5.0 fb s CMSFigure 11: Distribution of BDT scores for the high-pT subchannel of the Z(νν)H(bb)search
in the 8 TeV data set after all selection criteria have been applied. The signal expected from a Higgs boson (mH = 125 GeV), including W(`ν)H events where the charged lepton is not
reconstructed, is shown added to the background and also overlaid for comparison with the diboson background.
(GeV)
Hm
110
115
120
125
130
135
SMσ
/
σ
9
5
%
C
L
l
im
it
o
n
0
1
2
3
4
5
6
7
8
Observed Expected (68%) Expected (95%) = 125 GeV H Exp. for SM m Observed Expected (68%) Expected (95%) = 125 GeV H Exp. for SM m bb → CMS H s = 7 TeV, L = 5.0 fb-1 s = 8 TeV, L = 5.1 fb-1 Observed Expected (68%) Expected (95%) = 125 GeV H Exp. for SM m bb → CMS H s = 7 TeV, L = 5.0 fb-1 s = 8 TeV, L = 5.1 fb-1Figure 12: The 95% CL limit on the signal strength σ/σSMfor a Higgs boson decaying to two b quarks, for the combined 7 and 8 TeV data sets. The symbol σ/σSMdenotes the production cross section times the relevant branching fractions, relative to the SM expectation. The background-only expectations are represented by their median (dashed line) and by the 68% and 95% CL bands. The dotted curve shows the median expected limit for a SM Higgs boson with mH = 125 GeV.
25
7
Combined results
The individual results for the channels analysed for the five decay modes, summarised in Ta-ble 1, are combined using the methods outlined in Section 4. The combination assumes the relative branching fractions predicted by the SM and takes into account the experimental statis-tical and systematic uncertainties as well as the theorestatis-tical uncertainties, which are dominated by the imperfect knowledge of the QCD scale and parton distribution functions. The CLs is shown in Fig. 13 as a function of the Higgs boson mass hypothesis. The observed values are shown by the solid points. The dashed line indicates the median of the expected results for the background-only hypothesis, with the green (dark) and yellow (light) bands indicating the ranges in which the CLsvalues are expected to lie in 68% and 95% of the experiments under the background-only hypothesis. The probabilities for an observation, in the absence of a signal, to lie above or below the 68% (95%) band are 16% (2.5%) each. The thick horizontal lines indicate CLsvalues of 0.05, 0.01, and 0.001. The mass regions where the observed CLsvalues are below these lines are excluded with the corresponding (1−CLs) confidence levels. Our previously published results exclude the SM Higgs boson from 127 to 600 GeV [21]. In the search described here, the SM Higgs boson is excluded at 95% CL in the range 110 < mH < 121.5 GeV. In the range 121.5 < mH < 128 GeV a significant excess is seen and the SM Higgs boson cannot be excluded at 95% CL. (GeV) H m 110 115 120 125 130 135 140 145 of SM Higgs hypothesis S CL -7 10 -6 10 -5 10 -4 10 -3 10 -2 10 -1 10 1 99.9% 95% 99% Observed Expected (68%) Expected (95%) CMS -1 = 8 TeV, L = 5.3 fb s -1 = 7 TeV, L = 5.1 fb s
Figure 13: The CLsvalues for the SM Higgs boson hypothesis as a function of the Higgs boson mass in the range 110–145 GeV. The background-only expectations are represented by their median (dashed line) and by the 68% and 95% CL bands.
7.1 Significance of the observed excess
The consistency of the observed excess with the background-only hypothesis may be judged from Fig. 14, which shows a scan of the local p-value for the 7 and 8 TeV data sets and their combination. The 7 and 8 TeV data sets exhibit an excess of 3.2 σ and 3.8 σ significance, re-spectively, for a Higgs boson mass of approximately 125 GeV. In the overall combination the significance is 5.0 σ for mH = 125.5 GeV. Figure 15 gives the local p-value for the five decay modes individually and displays the expected overall p-value.
The largest contributors to the overall excess in the combination are the γγ and ZZ decay modes. They both have very good mass resolution, allowing good localization of the invariant mass of a putative resonance responsible for the excess. Their combined significance reaches