1.Introduction
1.1 Ethanol toxicokinetics and metabolism
When ingested, ethanol is absorbed from all parts of the gastrointestinal tract, largely by passive diffusion, into the blood, and it’s then distributed in the watery part of the body. Ethanol, in fact, has a high affinity for water and is almost insoluble in lipids. However the small intestine is the most efficient region of the gastrointestinal tract for ethanol absorption because of its very large surface area. In a fasting individual, it is generally agreed that 20% of a dose of ethanol is absorbed from the stomach and the 80% is absorbed from the small intestine (1).
After oral absorption of ingested doses<0.3 g/kg of body weight, the elimination of ethanol by the liver before it reaches systematically other organs is pronounced (hepatic first-pass effect). At higher doses the great interindividual variation in the percentage of the absorbed dose makes it difficult to measure this effect (1).
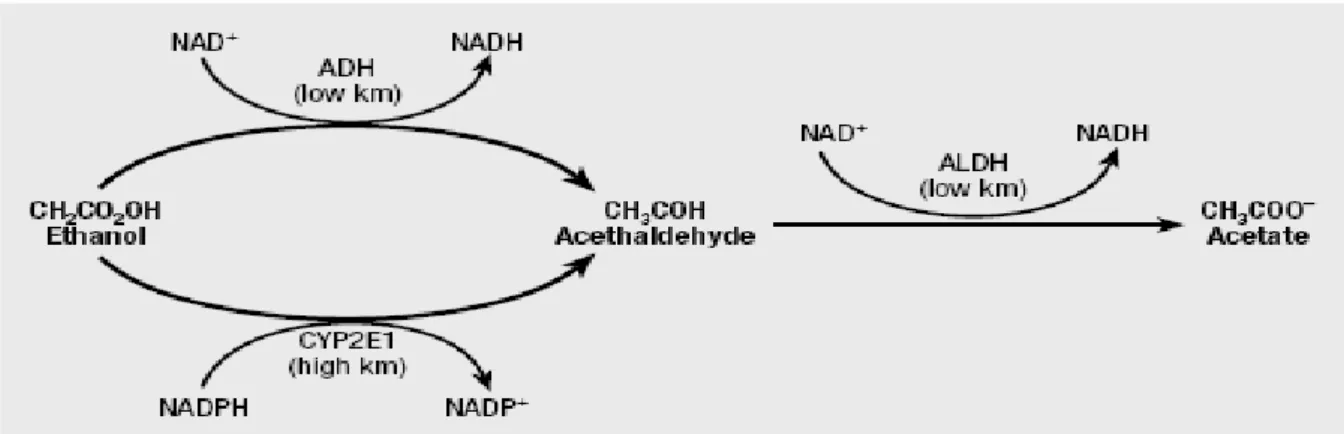
The liver is responsible for the elimination, through metabolism, of 95-98% of ingested ethanol from the body. The remainder of ethanol is eliminated through excretion in the breath (0,7%), in the sweat (0,1%) and urine (0,3%). In the cytosol of hepatocytes ethanol is first oxidized to acetaldehyde by the alcohol dehydrogenase’s activity (ADH), a family enzymes localized almost exclusively in the cytosol of hepatic parenchyma. Acetaldehyde is then oxidized to acetate by the mithocondrial form of aldehyde dehydrogenase (ALDH). Both ADH and ALDH are NAD+ dependent enzymes, which are reduced to NADH (Fig. 1). Acetate thus produced is converted to acetyl coenzyme A (CoA) and enters to citric acid cycle, where it is ultimately oxidized to carbon
Fig. 1: Pathways of alcohol metabolism in the liver.
Adapted from (1).
Since the mitochondria are impermeable to NADH, the oxidation of ethanol results in the accumulation of cytosolic NADH. As the reaction proceeds, the available NAD+ decreases and the continued oxidation of ethanol depends on the re-oxidation of NADH to NAD+. Acetaldehyde produced in the cytosol of hepatocytes freely crosses the mitochondrial inner membrane and is oxidized to acetate in the matrix with the release of reduced NADH, which is immediately disposable for the electron transport chain. In the absence of a cytosolic hydrogen acceptor, instead, NADH originating from the first reaction of ethanol metabolism can not be used directly, and must be re-oxidized to NAD+ through one of the hydrogen-translocating shuttle mechanism present in mithocondrial inner membrane. Reducing equivalents are moved into mitochondria predominantly by malate-aspartate shuttle which has led to the hypothesis that shuttle capacity is also an important rate determinant for ethanol metabolism. NADH produced in the oxidation of ethanol converts cytosolic oxalacetate into malate dehydrogenase which enters mitochondria in exchange for -ketogluatarate. Once in mitochondria, malate is converted into oxalacetate, resulting in the regeneration of NADH .In addition, the change in ratio of available NAD+ to NADH can have a profound influence on other metabolic function in the liver (1-4) (Fig. 2).
Fig. 2: Mechanism of movement of reducing equivalents from the cytosol to mitochondria by the malate-aspartate shuttle.
Adapted from (4).
A second important pathway in the metabolism of ethanol is the microsomal ethanol oxidizing system (MEOS). MEOS is a NADPH-dependent system found in the smooth endoplasmic reticulum and is responsible for the metabolism of 10 to 20 % of ethanol in the liver. The activity of MEOS increases after chronic consumption of ethanol. This increase results from induction of CYP2E1, a P-450 isoenzyme (Fig. 1) (1).
In the 1970s a number of studies explored the variability of ethanol elimination rate among individuals and populations. Ethanol elimination rate varies as much as 3-fold from person to person and has been shown to be influenced by both environmental and genetic factors, which show a high degree of interaction (5).
Recent molecular genetic studies have assigned a pivotal role in determining differences in ethanol clearance to those genes encoding enzymes involved in ethanol toxicokinetics. All these enzymes, in fact, have been shown to bear functional polymorphisms that may act in combination with environmental factors, such as nutrition, life-style and exposure to other xenobiotics responsible for the induction or inhibition of the same enzymatic activities (1).
1.2 Alcohol dehydrogenases
Human alcohol dehydrogenases (ADH) are dimeric Zn-containing enzymes with a subunit molecular weight of 40 kDa. These enzymes are classified in five major classes (I-V) based on enzyme properties and their subunit composition. Seven genes, located on the long arm of chromosome 4, encodes for the different subunits of ADH enzymes. The properties of the enzymes in each of these classes (1; 12; 13) are summarized in Table 1.
Class I contains , and isozymes (ADH1, ADH2 and ADH3). These enzymes have a low Km and therefore a high affinity for ethanol. Class I enzymes are very abundant in the liver and are believed to play a major role in hepatic alcohol metabolism. Class II ADH, encoding for the subunit, has a higher Km for ethanol than class I enzymes. Class III ADH ( subunit) is expressed in all tissues studied. It is virtually inactive with ethanol but is capable of metabolizing longer-chain alcohols and hydroxy-fatty acids (6). Recent additions to this family of enzymes are class IV and (tentatively) classes V. The class IV enzyme has been purified from the stomach and oesophagus. Encoding for -ADH for the mucosal isoenzyme (7) or -ADH for the stomach isoenzyme (8), enzymes of the class IV have a high Km for ethanol but -ADH is very active with retinol as a substrate (9).
Class V ADH, encoded by the ADH6 gene, is expressed at the mRNA level in the liver and in the stomach, but the protein itself has not been purified (1).
Up to now no allelic polymorphisms has been reported in human populations for the , and subunits of ADH. Relevant functional polymorphisms have been found only for the and subunits forming ADH2 and ADH3 enzymes. The presence of these polymorphisms creates a wide range of isoenzymes in different persons. Persons with different isoenzymes may show different characteristics with respect to their ability to metabolize ethanol.
Three allelic variants occur at the ADH2 locus: ADH2*1, ADH2*2 and ADH2*3, which encode the subunits 1, 2 and 3 respectively. The kinetic difference of the ADH2 alloenzymes can be attributed to a single aminoacidic substitution that may affect dissociation of the coenzyme nicotinamide adenine dinucleotide (NADH), a rate-limiting step in catalysis (10, 11). The enzyme containing the 1 subunit has high affinity for ethanol, whereas the 2 and 3 forms show lower affinity. The Vmax of and 3 homodimers is around 30-40 fold higher than that of 1 homodimers. ADH3 is also polymorphic but the Vmax for 1 is only twice of 2. The single aminoacidic exchange for appears not to alter the enzyme activity because is located away from the active site (10) ADH2*1 is the predominant allele among most world populations (95 % in Caucasian population), and ADH2*2 is the predominant allele in East Asian populations (70 %), but it is present in Europe with a frequency varying from 5-20 %. ADH2*3 exists in populations of African origin (20%) but appears to be very rare among the other ethnic groups. ADH3*1 is the predominant allele among East Asians and Africans (90%), whereas in Caucasians it is about equally distributed with ADH3*2 (1).
Table1: Properties of alcohol dehydrogenases (ADH) in man.
New nomenclature Subunit type
Tissue distribution Alleles Subunit
type
Effect
Class I
ADH1 ADH1A Liver wild-type
ADH2 ADH1B Liver, lung ADH2*1
ADH2*2 47G>A ADH2*3 369C>T
wild-type
His47; increased Vmax Cys369; increased Vmax
ADH3 ADH1C Liver, stomach ADH3*1
ADH3*2 271C>T; 349G>A
wild-type Gln271; Val349
Class II
ADH4 ADH2 Liver, cornea A; 159G>A; 75A>T
Class III
ADH5 ADH3 Most tissues wild-type
Class IV
ADH7 ADH4 Stomach, esophagus,
other mucosas
wild-type
Class V
1.3 Aldehyde dehydrogenases
A number of ALDH isoenzymes, coded by different gene loci and expressed in a wide range of tissues, have been detected in humans (Table 2). They are homotetrameric enzymes composed by isoenzymes specific subunits of 54 KD. The multiple molecular forms of ALDH existing in human liver have been tentatively classified into 4 major classes on the basis of their electrophoretic mobility, kinetic properties and cellular and tissue distribution. Class 1, 3 and 4 enzymes (ALDH1, ALDH2, ALDH4) are localized in the cytosol of hepatocytes; class 2 enzymes (ALDH2) are exclusively mithocondrial. ALDH1 and ALDH2 isoenzymes seem to be the only classes involved in acetaldehyde oxidation presenting a low Km and thus a high affinity for acetaldehyde. The lowest Km values has been measured for the mithocondrial ALDH2 (0.2-1 M) (1).
About 40% of Japanese lack ALDH2 activity in hair root and liver samples (14, 15). These individuals bear a G>A single point substitution resulting in the changing of a glutamate with a lysine at position 487. The normal allele is termed ALDH2*1 and the variant one is designated ALDH2*2. ALDH2*2 homozygous have essentially no ALDH2 activity, while heterozygous maintain about 30-50% of the ALDH activity (1).
Acetaldehyde is the toxic compound responsible for the unpleasant alcohol side- effects: nausea, tachycardia, facial flushing. There is a consensus in the literature that experiencing the toxic effects due to the production of high levels of acetaldehyde can affect people drinking habits, protecting them from alcoholism. ADH and ALDH isoenzymes, indeed, can influence the risk of alcohol abuse through a mechanism involving a faster oxidation of ethanol to acetaldehyde or a slower oxidation of acetaldehyde to acetate. Specifically, individuals having the genes encoding high-activity ADH ( 2 ADH encoded by ADH2*2) or the dominant negative allele for ALDH2 (ALDH2*2) are at reduced risk of alcoholism.
About 50% of Orientals and 40% of South American Native Indians show the presence of the inactive ALDH2 isoenzyme, which is on the contrary almost absent in Caucasians, Negroids and North American Indians. The percentage of heavy and moderate drinkers is in fact higher among Caucasians, whereas abstainers are more frequent among Orientals (1).
Table 2: Polymorphisms of aldehyde dehydrogenase (ALDH) genes
Ins: insertion, del: deletion; bp: base pair; aa: aminoacids. Adapted from (1).
1.4 ADH and ALDH transcriptional activity
Recent studies of molecular biology revealed the presence of functional polymorphisms not only in the coding regions, but also in the 5’-flanking region of the ALDH2 gene. Among these, the rs886205 (G-360A) seems to be located 1 bp upstream of the consensus binding site for members of the nuclear receptor family (16).
The mechanism underlying the transcriptional regulation of the ALDH2 gene is reported by several studies (16, 17). The nuclear factor Y (NF-Y) binds to the CCAAT box at –92 to – 96 bp in the promoter and is responsible for the basal expression (16). The chicken ovalbumin upstream promoter transcriptional factor (COUP-TF) and apolipoprotein regulatory protein- 1 (ARP-1) interact with the region adjacent to the –360G/A polymorphism (17).
In a study published in 2006 Nishimura at al. (18) developed a method of real time-RT PCR to measure ALDH2 mRNA levels in human peripheral blood leukocytes before and after the ingestion of a moderate single-dose of ethanol (0.4 g/kg of body weight) in a Japanese population. Individuals showing a normal ALDH2 phenotype (487Glu/Glu) were divided in two groups on the base of the G-361A genotype: the variant A carrier (A+; A/A and G/A) or not (A-; G/G). ALDH2 mRNA expression significantly increased 2 h after the ingestion of ethanol only in A- subjects suggesting that ALDH2 enzymes activity could be influenced by the polymorphism. Data from this work have been used in a following analysis by Kimura et al. of January 2009 (19), which confirmed the involving of the ALDH2 promoter polymorphism rs886205 (-360G/A) in the ALDH2 acetaldehyde/ethanol- induced gene expression. In this study an in vivo experiment was carried out collecting human peripheral blood leukocytes from 21 healthy young Japanese showing a deficient ALDH2 activity (487Glu/Lys) before and after alcohol ingestion (0.4 g/kg body weight) and
the levels of ALDH2 mRNA were quantified by real time RT-PCR. In all individuals, regardless of the genotype, ALDH2 mRNA increased after ethanol ingestion. Furthermore, the basal expression of ALDH2 mRNA was significantly higher in –360G/A heterozygous subjects than in –360G/G homozygous subjects. In the in vitro experiment the transcriptional activity of the ALDH2 promoter was investigated by a reporter assay using hepatoma cells (HepG2) in presence or absence of ethanol/acetaldehyde. The promoter activity of the –360G allele resulted lower than that of the –360A allele. Exposure to acetaldehyde induced a significant increase in the transcriptional activity of the –360G reporter, but not the –360A reporter. These results are in contrast with those of a previous study (20) showing a 2- fold higher activity of the –360G allele than the –360A allele. These conflicting results might be influenced by the presence of unidentified transcriptional factors binding the region surrounding the polymorphism at –360 bp. Little, indeed, is known yet about the transcriptional factors binding this site.
A similar reporter assay was carried out by the same authors to investigate the effect of 4 polymorphisms located in the promoter of the ADH4 gene (T-253A rs1800760; G-220A rs1800761; C-136A rs1800759; C-361G rs4140388) on its transcriptional activity (21). Transcriptional activity was significantly higher in cells with the –136A allele than in those with the –136C allele. Data collected in the studies described above (18, 19) were used to investigate whereas the difference in transcriptional activity caused a difference in ethanol elimination. A lower level of blood ethanol at peak was found in subjects with –136C/A and –136A/A genotype compared with subjects with –361C/C genotype only in Japanese subjects with a normal ALDH2 phenotype 487Glu/Glu. These results confirm those reported in a previous study conducted on the three SNPs at –253, -220, -136 bp (22). Anyway the mechanism of the transcriptional regulation of the ADH4 gene remains unclear in many aspects and little is know about the transcriptional factors binding the C-136A site.
The ADH4 gene promoter has a TATA box and a CCAAT box. The transcription factors C/EBP and AP-1 seem to be involved in the transcription regulation (22). An HNF-1 -C binding site has been predicted at –361C. HNF-1 -C is a variant isoform of the HNF1 family that acts as a transdominant repressor (23), but further investigations are required to assess if this factor influence the ADH4 gene transcriptional activity due to the SNP located at –361bp.
1.5 Microsomal CYP2E1
The CYP2E1 gene, localized to chromosome 10, is known to be highly polymorphic. Most of polymorphisms are located within the promoter and the intronic regions; moreover, an RsaI fragment length polymorphism has been recently identified in the 5’-flanking region (24) (Table 3). The rare allele (c2 allele), observed in the 28% of Taiwanese population and in19-27% of Japanese, lacks the RsaI restriction site and is associated with higher transcriptional activity and enzyme activity than the c1 wild type allele (25). This enhanced transcriptional activity may have a role in the development of severe alcohol-induced liver disease (ALD) (26). During the reaction, in fact, CYP2E1 generates reactive oxygen species that are partially responsible of the liver damage associated to ethanol consumption (1). The risk of ALD seems to be influenced by the combination of different genotypes. The CYP2E1 c2 allele in combination with the ADH3*2 allele in fact, has been found to increase the risk of ALD whereas ADH3 genotype does not influence the risk (27).
Regulation of CYP2E1 protein occurs both transcriptionally and post-transcriptionally through ethanol-induced protein stabilization: chronic ethanol consumption leads to an increase in CYP2E1 protein by decreasing its degradation (1).
The CYP2E1*1D allele (Table 3) is associated with a greater CYP2E1 inducibility after ethanol consumption because of the presence of a repeat sequence in the 5’-flanking region of the gene that may disrupt negative regulatory elements (24).
CYP2E1, as a Phase I enzyme, is also involved in the bio-activation of many other xenobiotics, including pro-carcinogens and small molecular weight volatile organic chemicals, which can induce the enzymatic activity and indirectly modulate ethanol metabolism.
1.6 Glutathione S-transferases
The Phase II enzymes glutathione S-transferases (GSTs) play an important role in the metabolism of ethanol, as they are involved in the detoxification of organism from the reactive oxygen species generated during the reaction catalyzed by CYP2E1.
GSTs catalyze the conjugation of reduced glutathione (GSH) with electrophilic compounds producing less reactive and readily excreted metabolites.
GSTs are divided in 4 classes of cytosolic enzymes differentially expressed in a wide range of organs and among the various populations: GST (GSTA), GST (GSTM), GST (GSTP) and GST GST Table 3).
In humans genetic polymorphisms have been described in GSTM1, GSTT1 and GSTP1 genes. Among these the most studied are the GSTM1-null and GSTT1- null polymorphisms in which the entire locus is deleted resulting in the loss of the enzyme function. Being the GSTM1 and GSTM1 enzymes highly expressed in the gastric and intestinal mucosa, individuals showing the GSTM1-null and GSTT1- null genotypes are expected to have a reduced ability in detoxifying organism during ethanol metabolism (1). A percentage of individuals varying between 20 and 50 % doesn’t express the GSTM1 enzyme due to the
homozygous deletion (28); this percentage is about 50% among Caucasians (29). About 60% of Asian people, 40% of Africans and 20% of Caucasians don’t express the GSTT1 enzyme (30).
The GSTP1 gene is also polymorphic. The GSTP1*B polymorphism consists of a transition A>G of nucleotide 313 resulting in the substitution of an Isoleucine with a Valine in position 105. The GSTP1*C allele exhibit a C to T transition of nucleotide 341 involving the substitution of Alanine with Valine in position 114 (1). The GSTP1 Val105/Val105 polymorphism is very common and is associated with an altered enzyme activity (reduction or icrease) compared to the wild type form Ile105(31).
Table 3: Polymorphisms of CYP2E1, GSTM1, GSTT1 and GSTP1 genes
1.7 Studies of alcohol elimination rate and physiological factors
governing alcohol disposition
Several authors have experimentally determined the alcohol concentration trend in the biological fluids. The maximum plasmatic concentration is reached 20 minutes after ethanol administration and elimination of ethanol through saliva and breath follows closely the changes of blood alcohol concentration (BAC). The maximum ethanol concentration in urine, instead, is reached 2 hours after ethanol ingestion (32) The elimination kinetics, globally governed by the equation of Michaelis Menten, assumes a pseudolinear trend after the completion of absorption and distribution, when the concentration reaches the maximum value.
As stated above, the breath alcohol concentration (BrAC) reflects the arterial concentration and nowadays the use of the hand-hendle breath instruments to measure the state of sobriety of individuals, e.g. in the case of a criminal charge or other sanctions, is becoming increasingly frequent. This instruments contain a detector, which can be electrochemical, infrared, or semiconductor that is placed on the path of the exhaled air. The breath from the deep lung region contains the highest concentration of alcohol that is in equilibrium with BAC: 2300 parts of deep lung air contain the same amount of alcohol as 1 part of blood. Thus, the measure made on exhalation multiplied by 2300 is a very good approximation of BAC. To be sure that the sample of breath has been captured from a deep region of the lung, it is necessary to hold a controlled and uninterrupted breath during the test. Furthermore, the breath test should be conducted 15 minutes after the last drink to be sure that there is no residual alcohol in mouth and throat.
Factors like total body water volume, recent food intake, meal composition and the effects of recent and long-term drinking history can represent confounders in studies of alcohol
elimination rate and acute tolerance to alcohol. The uniformity of these environmental factors are key to the fair comparison of ethanol elimination rates and dosing subjects in such a way as to result in equivalent peak BAC (or BrAC) is a study design challenge. Most of the authors choose to calculate the doses of alcohol on the basis of body weight (33) not taking into account that differences in body content exist in different ethnic groups, among different individuals and between women and men. Since alcohol has a high affinity for water, between two individuals having the same body weight, a well-muscled individual will achieve lower alcohol concentration than an individual with a higher percentage of fat after ingestion of the same amount of alcohol. Otherwise, considering two individuals with a similar body composition, the person showing a larger body surface area (BSA) will achieve lower alcohol concentrations than the smaller one. Differences in gender and age are also involved in the variability of BrAC and alcohol elimination rate among individuals. Women, in fact, tend to have a lower percentage of body water than men and achieve higher alcohol concentrations. Furthermore, total body water tends to decrease with age, thus, an older person will achieve higher blood alcohol concentrations. Regarding elimination of ethanol, the body’s ability to metabolize alcohol tends to decrease with age (34).
Moreover, the absorption of ethanol varies with the time of the day, the type of alcohol consumed including the alcohol content and the drinking pattern (amount of drink in one occasion, speed of drinking, time during alcohol consumption), but the presence of food in the stomach is probably the main factor involved in the process (1).
After eating in fact, the pyloric valve closes, so that food remains in the stomach to be digested. As a result, ethanol will not reach the small intestine where it would be readily oxidized and it will be slowly absorbed from the stomach with delayed peak BrAC as a
consequence. It has been observed that larger the meal is and closer is the time between eating and drinking, greater is the diminution of peak BrAC (34).
1.8 Alcohol impact on basic social abilities and behavior
Since alcohol takes effect on the complete spectrum of organs and systems of the body in a direct and indirect way, including the brain, alcohol affects human performance and behavior. The brain, in fact, is responsible for many critical body functions, not only basic perceptual mechanisms but also complex tasks, such as driving a car.
Low doses of alcohol are responsible for the reduction of a range of driving skills, such as keeping the lane, steering, and the time of reaction in front of the sudden appearance of a vehicle on the road (35). Driving is a classical example in which eye movements anticipate the motion. It has been reported that an altered activity of cerebellum reduces the coordination between eye movements and other actions involved in driving, e.g. the steering. Thus, these impairments probably derive in part from the alcohol effect on cerebellum. A recent study of 2008 showed through an automated in- car system that the optimal relationship between eye and steering movements deteriorates during driving below the legal limit for alcohol in the United Kingdom (BrAC. of 35 μg/100 ml) (36). It has recently been suggested that alcohol intoxication might impair the cognitive function temporarily, causing the same abnormalities present in the attention deficit hyperactivity disorder (ADHD) (37). ADHD is a common disorder that involves many different symptoms from inactivity to hyperactivity up to impulsivity, including lack of attention and tendency to distraction. Albeit ADHD is diagnosed mostly among children, it is a relatively persistent disorder, which lasts in 60%-80% of adolescents and adults. It has been reported that adults with ADHD are more likely to be involved in car accidents,
receive citations for speeding, and have their license revoked; actually, they are inclined to be aggressive, not wear seat belt and make use of alcohol and drugs (38). Road tests and simulation results have shown that adults with ADHD incur a higher number of scratches and bumps compared to control groups (39). Weafer et al. in 2008 carried out an experiment in which simulated driving performances of sober adults with ADHD have been compared to those of a control group both in sober state and when alcohol intoxicated (80 mg/100 ml). The results showed that adults with ADHD exhibit a decrement in the simulated driving performance compared to sober controls and a cognitive impairment similar to intoxicated subjects (greater deviation from lane and faster steering) (37). The intriguing hypothesis that adults with ADHD may be more adevrsely affected by alcohol ingestion in their driving performance has been advanced by Barkley and coworkers in 2006. In this study was investigated the effect of two acute doses of alcohol on basic skills related to driving (e. g. attention and rection time) both in ADHD adults and control adults. The results showed more variability in reaction time in the ADHD group compared to controls, with more variability at the higher dose (40).
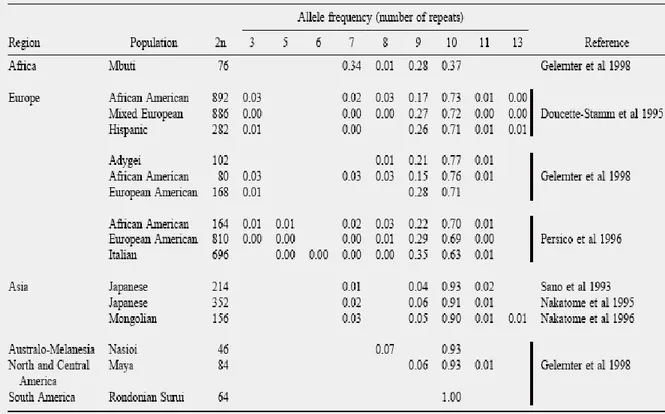
ADHD has been shown to be a familial and heritable disorder . The response of ADHD patients to medications that inhibit the dopamine transporter, including methylphenidate (the drug of choise in the treatment of ADHD), led to consider the dopamine transporter gene (DAT1) as a primary candidate for ADHD. Localized in the chromosome 5p15.3 region, DAT1 (gene symbol SLC6A3) encodes for a dopamine transporter protein responsible for the dopamine reuptake from the synaptic cleft back to the presynaptic neurons. The 3'-UTR region of the DAT1 gene contains a 40 bp variable number tandem repeat (VNTR) close to the site of polyadenylation (41). Analyses on 30 different populations revealed that the number of tandem repeats varies from 3 to 13 (Table 4) and most frequently occurs as a 9 or 10 tandem repeat unit (42). This variation has been
probably associated with a lower efficiency of transcription and mRNA stability, but doesn't change the aminoacid sequence of the protein (41).
The 10R allele of DAT1 3'-UTR VNTR is often defined as a "high-risk allele" for ADHD, in fact several molecular genetic studies, in different ethnic groups, have reported its association with the disorder (43-46). However the results are controversial and some other investigators have reported a lack of association (47-48).
Several studies have been carried out to search a link between the DAT1 VNTR and addictive or risky behaviors. The 9R allele has been linked with a lower risk of smoking addiction (49-50), while most of the studies on DAT1 and alcoholism failed to demonstrate an association between the two (51-52). In 2005 Guang et al. tested the effect of the 40 bp
DAT1 VNTR on a spectrum of risky behaviors including delinquency, number of sexual
partners, drinking quantity, smoking quantity and frequency, seatbelt non-wearing, and use of illegal drugs. Data showed a protective effect of the 9R/9R genotype against risky behaviors. A second finding emerging from this work is that this protective effect varies over age. It seems to be prominent at ages when a behavior is illegal, but it largely vanishes at ages when the behavior becomes legal or more socially tolerated (53).
Table 4: Population studies on DAT1 3’-VNTR
2. Aim of the study
This study on the genetic and physiological aspects of alcohol consumption focuses on ethanol elimination rate and the differences existing between individuals, and investigates alcohol impact on basic social abilities and behavior.
To this intent we first organized electronic breathalyzer tests to investigate whether exists a variation of phenotype (slow or fast metabolizers of ethanol) corresponding to different genotypes for a spectrum of single nucleotide polymorphisms (SNPs) residing in the genes involved in ethanol toxico-kinetics.
The activity of MEOS increases after chronic consumption of ethanol and it is well known that this increase results from induction of CYP2E1. On the base of results of Kimura et al., published in 2009, (19) we also tried to asses the effect of the –360 G/A polymorphism (rs886205) in the promoter region of the human ALDH2 gene on its ethanol-induced gene-expression by in vivo experiments.
Moreover, measuring the time of reaction to a sudden event before and after ethanol ingestion, we studied the effect of alcohol consumption on driving skills during a simulated driving, and we further investigated the possible role of the genes of ethanol metabolism and the DAT1 gene in the physiological response.
3. Materials and Methods
3.1 Selection of SNPs
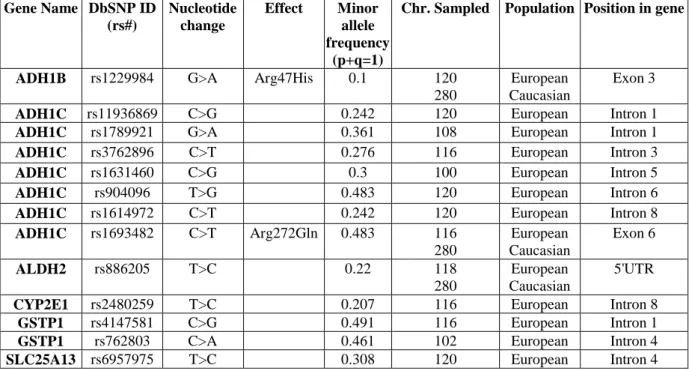
We used the online tool “dbSNP”, publicly available at the URL: http://www.ncbi.nlm.nih.gov/snp/, to select the SNPs residing in the genes involved in ethanol metabolism and resulting in an aminoacid substitution in the protein chain. A good candidate SNP for a variation of phenotype, in fact, should have a biological effect. In order to restrict the analysis to common polymorphisms, allowing an adequate statistical power of the study, in a second step of selection we only filtered the SNPs having a minor allele frequency >0.1 in the Caucasian population.
The haplotype-tagging SNPs were further selected to get all the information necessary to define the status of all the other variants in linkage-disequilibrium.
The selection ended with a total of 13 SNPs reported in table 5.
Table 5: SNPs selected in the study and their characteristics
Gene Name DbSNP ID (rs#) Nucleotide change Effect Minor allele frequency (p+q=1)Chr. Sampled Population Position in gene
ADH1B rs1229984 G>A Arg47His 0.1 120
280
European Caucasian
Exon 3
ADH1C rs11936869 C>G 0.242 120 European Intron 1
ADH1C rs1789921 G>A 0.361 108 European Intron 1
ADH1C rs3762896 C>T 0.276 116 European Intron 3
ADH1C rs1631460 C>G 0.3 100 European Intron 5
ADH1C rs904096 T>G 0.483 120 European Intron 6
ADH1C rs1614972 C>T 0.242 120 European Intron 8
ADH1C rs1693482 C>T Arg272Gln 0.483 116 280 European Caucasian Exon 6 ALDH2 rs886205 T>C 0.22 118 280 European Caucasian 5'UTR
CYP2E1 rs2480259 T>C 0.207 116 European Intron 8
GSTP1 rs4147581 C>G 0.491 116 European Intron 1
3.2 Interindividual variability in ethanol elimination rate
The study population consists of 50 volunteers, aged between 20 and 30 years, recruited among students of the University of Pisa. By signing an informed consent, participants agreed to give their DNA for our project and they declared to be occasional or regular drinkers of alcohol.
During an electronic breathalyser test, each volunteer was given a certain amount of wine (12% in ethanol) in order to measure the variation of BAC over time and draw the corresponding disposal curve (phenotype analysis). The BAC measurements were made at regular intervals of 20 minutes after alcohol ingestion, to be sure, particularly at the first measurements, that there were no residual alcohol in mouth and throat. Subjects were instructed not to take ethanol on the day before the experimental day and to consume a light meal before the test. Tests have been conducted, both in the morning and in the afternoon, at least 2 hours away from meals.
Genotyping was carried out through allele specific PCR (ASO-PCR) followed by electrophoresis on 2% agarose gel.The relationship between genotype and phenotype was investigated calculating the Area Under the Curve (AUC) for each individual. AUC is a principle used in pharmacology to indicate the amount of active drug into the bloodstream over a period of time after administration. Following our hypothesis, a higher AUC value would indicate a slower ethanol disposal, whereas smaller AUC values would correspond to a more rapid disposal.
3.2.1 Calculation of the administered dose of wine
In the preliminary stages of the project we decided to test two different principles to identify the most appropriate method for calculating the administered dose of wine.
In a first test we decided to use the BSA as indicator of the metabolic capacity of the individuals. We used the on-line tool “Body Surface Area Calculator for medication doses” (http://www.halls.md/body-surface-area/bsa.htm), ordinarily used for drug dosage, to obtain the BSA values for each subject and calculate the dose of wine. The calculator takes into account height, weight, age and sex of the person and thus, indirectly, also the water/ body fat ratio. Based on references (34), we decided to administer 80 ml of wine per m2 of BSA for men and 68 ml for women.
In a second test, we calculated the doses of wine on the base of total body water amount, obtained by bioelectrical impedance analysis (BIA). The measurement of body impedance is based on the principle that biological tissues can behave as conductors, semiconductors or dielectric (insulation). The intra-and extra-cellular electrolyte solutions in the lean tissues are excellent conductors, bone and fat, on the contrary, are dielectric substances and are not crossed by currents. Based on literature (34) we established to administer 50 ml of ethanol per 100 ml of H2O.
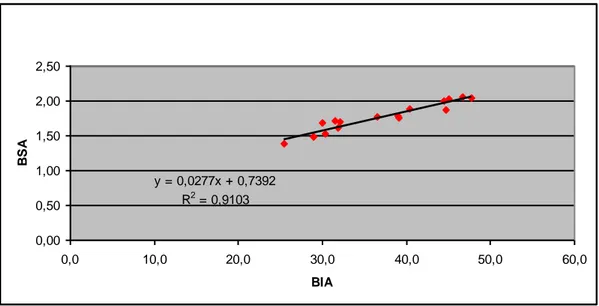
Relating the values of BSA and BIA we obtained a correlation (R2) of 91%, showing that the two principles are not very different one from each other and were both valid for our study (Fig. 3).
CORRELAZIONE TRA BSA E BIA y = 0,0277x + 0,7392 R2 = 0,9103 0,00 0,50 1,00 1,50 2,00 2,50 0,0 10,0 20,0 30,0 40,0 50,0 60,0 BIA B S A
Fig. 3: Correlation between BSA and BIA values.
Since the calculation of BSA is quick and easy and the on line calculator takes into account the water/body fat ratio, we chose to use the BSA as an index of the individual metabolic capacity.
3.2.2 DNA extraction
DNA for each of the 50 volunteers was purified from mouth rinse sample using the
JETQUICK blood and cell culture DNA spin kit (GENOMED GmbH, Löhne, Germany).
After an initial proteolytic processing with proteinase K, silica resin was used to bind only the genomic DNA. The use of buffers with increasing saline concentrations allows the purification of DNA from all contaminants. DNA in then eluted by NaCl solution (pH: 9).
3.2.3 Genotyping
Genotyping for each of the 13 SNPs selected was carried out using the oligonucleotide allelic specific PCR (ASO PCR). In this technique two oligonucleotide are designed so that one is complementary to the normal sequence (Forward 1; F1) and the other is complementary to the mutant sequence (Forward 2: F2), and both are used in conjunction with a third common primer (Reverse; R). Only the perfectly matched oligonucleotide is able to give rise to the amplification.
Primers specific for the common and variant alleles were added in mix 1 and 2, respectively.
PCR reactions were performed in 10 μl containing: 1 μl of Buffer BD 10X, 1 μl of dNTPs 20 mM (Solis Byodine, Tartu, Estonia), 0,6 μl of MgCl2 25 mM, 6μl of sterile water, 0,125
μl of primers 10 μM (forward and reverse), 0,15 μl of Hotstart Taq DNA Polymerase (Solis
Byodine, Tartu, Estonia) and 1 μl (20 ng) of genomic DNA. Negative controls (blank)
were included in each PCR. The thermal cycle program was: 15 minutes at 95°C (to active the polymerase), 20 cycles of 1 minute at 95°C (to denature the DNA), 30 seconds at 68-48°C (touch-down) (for primers annealing), 1.5 minutes at 72°C (elongation step), and 20 more cycles of 1 minute at 95°C, 30 seconds at 51°C and 1.5 minute at 72°C. The final elongation step was 10 minutes at 72°C. PCR products were then directly analyzed on a 2% agarose gel.
3.2.4 Comparison between genotype and phenotype
homozygous for the common allele and group 1 including the carries of the minor allele (heterozygous + homozygous for the minor allele). The software provides, in addition, the mean AUC values within the two groups and an automated statistical analysis to verify the significance of data obtained.
3.3 Effect of rs886205 on ALDH2 ethanol-induced gene
expression
In the present study, we examined the effect of rs886205 on ethanol-induced expression of
ALDH2 gene in the peripheral blood leukocytes (PBLs) of 10 volunteers previously
genotyped for the SNP in study.
3.3.1 Drinking experiments
Peripheral blood samples from 10 donors were collected in PAXgene Blood RNA tubes (PreAnalytiX, Hombrechtikon, Switzerland) before and 1 hour, 2 hours and 3 hours after ethanol ingestion. Therefore, the expression level before alcohol ingestion was used as control instead of separate experiments without alcohol ingestion in each individual.
Subjects were asked to ingest a total amount of 0.4 g of ethanol per kg body weight. The dose was calculated taking into account BSA and gender differences and was divided into 6 undersized, taken at 4 minutes intervals one from each other.
Subjects were also instructed not to take ethanol on the day before experiments and to abstain from food for 3 h and from drinking water for 1 h before experiments.
3.3.2 RNA purification
RNA extraction was carried out using the PAXgene Blood RNA System (PreAnalytiX,
Hombrechtikon, Switzerland) consisting of a blood collection tube containing an additive,
which reduces in vitro RNA degradation, and a nucleic acid purification kit for the purification of total RNA from 2.5 ml whole blood.
Purification begins with a centrifugation step to pellet nucleic acids in the PAXgene Blood RNA tube. The pellet is washed and re-suspended and then incubated in optimised buffers together with proteinase K to bring about protein digestion. An additional centrifugation through a shredder spin column in carried out to homogenize the cell lysate and remove residual cell debris, and the supernatant of the flow-through fraction is transferred to a fresh microcentrifuge tube. Ethanol is added to adjust binding conditions, and the lysate is applied to a RNA spin column containing a silica membrane. During a brief centrifugation, RNA is selectively bound to the membrane while contaminants pass through. Remaining contaminants are removed in several wash steps. Between the first and the second wash steps, the membrane is treated with Dnase I to remove trace amounts of bound DNA. After the wash step, RNA is eluted in 80 μl of elution buffer and heat-denatured.
To assess RNA integrity, all samples have been loaded on agarose gel. Using a trans-illuminator, it was possible to observe the two bands corresponding to the rRNA subunits 18 S and 28 S. The integrity of RNA is a prerequisite for the analysis of gene expression, as the pattern of gene expression can be altered by the specific or non-specific degradation of RNA due to the extraction.
The concentration of RNA has been determined by measuring the absorbance at 260 nm (A260) in a spectrophotometer. RNA samples have been diluted in 10 mM Tris HCl pH 7.5,
these conditions an absorbance of 1 unit at 2660 nm corresponds to 44 g of RNA per ml. The ratio between the absorbance value at 260 nm and 280 nm give an estimate of RNA purity.
All samples showed A260/ A280 values between 1.8 and 2.2. RNA yield varied among
donors, but was >3 g for all samples measured.
3.3.5 cDNA synthesis
cDNA synthesis was carried out from 1 g of total RNA in a final reaction volume of 20 μl using the iScript cDNA Synthesis Kit (BioRad). The reaction is catalysed by the Moloney Murine Leukemia Virus (MMuLV) reverse transcriptase, an RNA/DNA-dependent DNA polymerase modified and optimised for the synthesis of cDNA, in presence of an mRNA-polyA template and a single-stranded oligo-dT.
3.3.6
RT-qPCR
Each RT-qPCR was performed in a 96-well plate using the I Cycler IQ thermocycler (BioRad). Each sample is analysed in triplicate and a no template control (RNase free H2O) is included in each plate.
Amplification was carried out using the iQ SYBR Green Supermix (BioRad). Reactions were performed in 25 μl containing: 12.5 μl of iQ SYBR Green Supermix 1X, 0.75 μl of primers 10 M (forward and reverse) and 2 μl of cDNA diluted 1:5 (ca 25 ng). Thermal cycler conditions were: 3 minutes at 95°C (for Taq DNA polymerase activation), 40 cycles
of 15 seconds at 95°C and 1 minute at 62°C (for primer annealing), and a final step of 10 seconds at 65°C (elongation step).
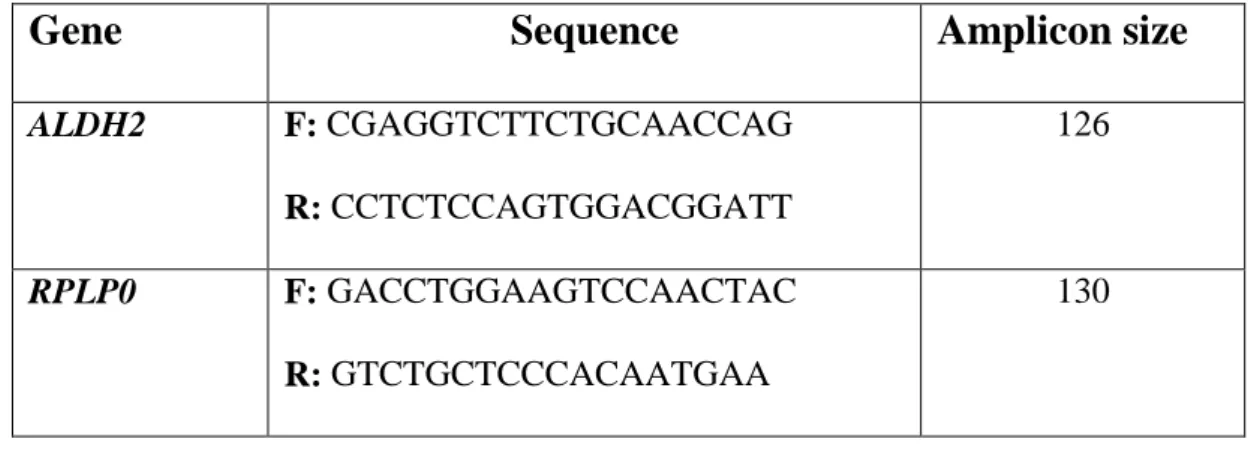
The expression levels of ALDH2 were estimated as relative ratios to those of RPLP0. The sequence of primers used, both for ALDH2 and RPLP0, is reported in table 6.
Table 6: Sequence of primers for ALDH2 and RPLP0
Gene
Sequence
Amplicon size
ALDH2 F: CGAGGTCTTCTGCAACCAG R: CCTCTCCAGTGGACGGATT 126 RPLP0 F: GACCTGGAAGTCCAACTAC R: GTCTGCTCCCACAATGAA 130
SYBR green is a dye that binds to double stranded DNA but not to single-stranded DNA. When SYBR green is bound to double stranded DNA it fluoresces very brightly, in proportion to the amount of cDNA present in the sample. When it reaches a certain threshold, the fluorescent signal is converted to a numeric parameter (threshold cycle, Ct), proportional to the number of initial molecules. The gene expression profile was obtained using the method of relative quantification.
The Ct values of the ALDH2 gene for each sample were compared to the Ct values of the RPLP0 gene and the difference between them (the ΔCt) underwent to statistical analysis.
3.4 Effect of alcohol consumption on driving skills
Forty volunteers participated in a driving simulator test under two different conditions: in a sober state and 20 minutes after ingestion of a certain amount of wine (12% in ethanol) calculated on the basis of their BSA and taking into account both gender and age differences.
The driving simulator, developed by the Department of Civil Engineering, University of Pisa, is provided of the basic inputs of an automatic vehicle (steering, brake and accelerator pedal) and is connected, through a computer, to a graphic scenario.
A slip of the vehicle was simulated after a period of 10 minutes of driving in a highway (during which the subject get used to the vehicle) and for each volunteer we calculated the time required to get back to the lane (time of reaction). The time of reaction in the sober state was used as control instead of separate experiments without alcohol ingestion in each individual.
3.4.1 DAT1 genotyping
PCR amplification of the DAT1 40-bp VNTR in the 3’-UTR was carried out using the following pair of primers, upstream: 5’-TGTGGTGTAGGGAACGGCCTGAG-3’ and downstream: 5’-CTTCCTGGAGGTCACGGCTCAAGG-3’. Forty cycles were conducted consisting of denaturing at 95°C for 20 sec, annealing at 73°C for 30 sec, and extension at 72°C for 20 sec. An initial denaturing step at 95°C for 15 min and a last extension step at 72°C for 7 min were also added.
The reactions were 20 μl that consisted of 4 μl (100 ng) genomic DNA, 0.1 μl of each primer 100 μM, 0.2 μl of dNTPs 20 mM (Solis Byodine, Tartu, Estonia), 0.3 μl of Hot start
Taq polymerase (Solis Byodine, Tartu, Estonia), 2 μl of Buffer BD 10X, 2.4 μl of MgCl2
25mM and distilled water. Six μl of PCR products were run on a 2.5% agarose gel. A 100-bp DNA ladder was used to identify the various repeat alleles by size: 8-repeat (400100-bp), 9-repeat (440bp), and 10-9-repeat (480bp). Negative controls (blank) were included in each PCR.
0 0,05 0,1 0,15 0,2 0,25 0 20 40 60 80 100 120 Test2 Test1
4. Results
4.1 Interindividual variability in ethanol elimination rate
Following the variation of BrAc over time we were able to draw the curve of ethanol disposal for each individual. The maximum BrAc (the peak of the curve) is obtained after 20 minutes from ethanol ingestion and the analyses showed that the peak of the curve doesn’t depend on the ethanol dose (P value= 0.7202) neither on genotype for any of the SNPs in study. Thus, the peak of the curve seem to be influenced by absorption and not by metabolism. After the peak, the curve starts to degrade until it reaches a value of BrAc = 0. This is the trait of the curve corresponding to ethanol elimination, which starts after its absorption and distribution. The complete elimination of ethanol is reached, on average, after 120 minutes from alcohol consumption (Fig. 4).
Fig. 4: average ethanol disposal in test 1 (20 subjects) and test 2 (30 subjects).
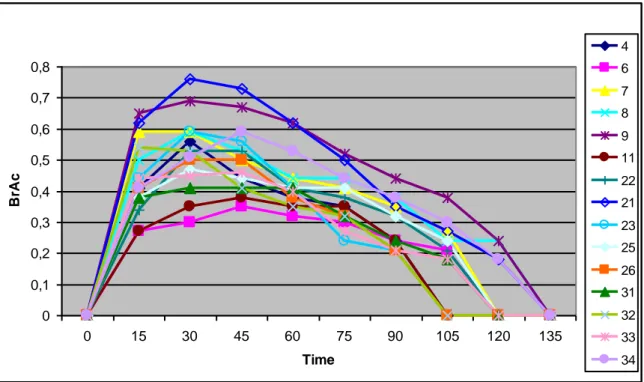
Interindividual variability in ethanol elimination rate and metabolic capacity appeared evident when comparing the graphs obtained for different individuals in the same
0 0,1 0,2 0,3 0,4 0,5 0,6 0,7 0,8 0 15 30 45 60 75 90 105 120 135 Time B rA c 4 6 7 8 9 11 22 21 23 25 26 31 32 33 34 experiment (Fig. 5). Some individuals can achieve very high levels of Brac, but they can take, to return to levels of BrAC = 0 ,the same time of other individuals who reach lower BrAC peak. Although the extinction time was the same, the aspect of the curve, and thus the individual pattern of elimination, appeared to be very different.
Fig. 5: curves of ethanol disposal drawn in the same experiment for different subjects.
It was therefore necessary to use another mathematical parameter to define and quantify the differences existing between individuals. Following the classical studies of pharmacology, we decided to use AUC as and index of ethanol disposal.
The AUC values obtained from the breathalyzer tests were compared with genotypes for the 13 SNPs selected in the study.
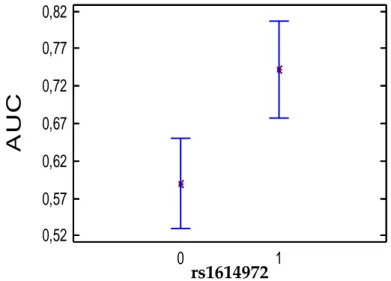
The analysis of variance showed a significant association between the AUC values and the genotype, only for the allelic variant rs1614972 within the intron 8 of the ADH1C gene (P
value= 0.0151). The analysis also revealed an influence of the time of the day when the test
Means and 95,0 Percent LSD Intervals
ADH1C_6_
A U C 0 1 0,52 0,57 0,62 0,67 0,72 0,77 0,82 rs1614972from meals) on ethanol elimination rate (P value= 0.0204). Anyway, as there is no interaction between the two factors, the genotype exerts its effect regardless of the time when the test is conducted. Results from the statistical analysis for rs1614972 are reported in table 7.
Table 7:
rs1614972 - Analysis of Variance for AUC - Type III Sums of Squares
--- Source Sum of Squares Df Mean Square F-Ratio P-Value --- MAIN EFFECTS
A: Time of the Test 0,23849 1 0,23849 5,81 0,0204 B: rs1614972 0,263577 1 0,263577 6,42 0,0151 INTERACTIONS AB 0,0323815 1 0,0323815 0,79 0,3795 RESIDUAL 1,72436 42 0,0410561 --- TOTAL (CORRECTED) 2,13094 45 --- All F-ratios are based on the residual mean square error.
In detail, the carriers of the minor allele for rs1614972 (group 1: C/T + T/T) showed slower AUC values than homozygous for the common allele (group 0: C/C) both in the morning and in the afternoon (Fig. 6).
Fig. 6: Association between genotype for rs1614972 (group 0: C/C; group 1: C/T + T/T) and AUC values: means and 95.0 percent LSD intervals.
Means and 95,0 Percent LSD Intervals
Donor
T _ r e tu r n _ 0 1 2 4,3 4,6 4,9 5,2 5,5 5,8 6,1Test
AFTERNOON
MORNING
The acceleration of ethanol metabolism in the afternoon and the significant association between the Time of the Test and ethanol elimination rate, were confirmed by carrying out the analysis on the variable: T_return_0, ie the time required for each subject to return to a BrAc= 0, after ethanol ingestion (Table 8; Fig. 7).
Table 8:
rs1614972 - Analysis of Variance for T_return_0 - Type III Sums of Squares
--- Source Sum of Squares Df Mean Square F-Ratio P-Value --- MAIN EFFECTS A: T_return_0 10,5322 1 10,5322 11,78 0,0013 B: rs1614972 3,08343 1 3,08343 3,45 0,0702 RESIDUAL 38,4562 43 0,894331 --- TOTAL (CORRECTED) 49,7391 45 --- All F-ratios are based on the residual mean square error.
Fig. 7: Association between the variable: T_return_0 and AUC values: means and 95.0 percent LSD intervals.
Moreover, a simple regression analysis was performed to confirm that our method of calculation of the administered dose of wine was really opportune in studies of alcohol elimination rate. The analysis revealed a lack of association between the administered dose of wine and the AUC values, suggesting that the average alcohol disposal doesn’t depend on dose (Table 9; Fig. 8).
Table 9: Simple Regression Analysis - AUC vs. Dose
Regression Analysis - Linear model: Y = a + b*X
--- Dependent variable: AUC
Independent variable: Dose
--- Standard T
Parameter Estimate Error Statistic P-Value
--- Intercept 0,660643 0,149184 4,42838 0,0001 Slope 0,0000894297 0,0010983 0,0814257 0,9355 --- Analysis of Variance --- Source Sum of Squares Df Mean Square F-Ratio P-Value --- Model 0,000321053 1 0,000321053 0,01 0,9355 Residual 2,13062 44 0,0484231 --- Total (Corr.) 2,13094 45
Fig. 8: Simple regression analysis- AUC vs. Doses: plot of fitted model.
Plot of Fitted Model
80 110 140 170 200 230
Dose
0 0,3 0,6 0,9 1,2 1,5A
U
C
Interazioni e 95,0 al Intervalli LSD Time -31 -21 -11 -1 9 19 29 (X 0,001) D if f_ T 0 1 2 3 Diplotipo 1 2
4.2
Effect of rs886205 on ALDH2 ethanol-induced gene
expression
Quantification of ALDH2 mRNA levels was carried out by real time RT-PCR and the relative expression increases were estimated as relative ratios of those of RPLP0 and compared among promoter groups: group 1, including the homozygous for the common allele (G/G), and group 2, including the heterozygous and the homozygous for the minor allele (A/G + A/A).
The analysis of variance showed no induction of ALDH2 gene expression after ethanol ingestion. In detail, the expression values appear to remain stable over time in subjects of group 2, and a non-significant increase is shown in subjects of group 1 (P value= 0.5897) (Fig. 9; Table 10).
Fig. 9: ALDH2 gene expression increase over time after ethanol ingestion in promoter group 1 (G/G) and promoter group 2 (A/G + A/A): interactions and 95.0 percent LSD intervals.
Relative expression increase
1 2 Medie e Intervalli LSD al 95,0% test 3,3 3,6 3,9 4,2 4,5 4,8 sec Table 10:
rs886205 - Analysis of Variance for expression values - Type III Sums of Squares
--- Source Sum of Squares Df Mean Square F-Ratio P-Value --- MAIN EFFECTS A: rs886205 0.000424401 1 0,000424401 0.29 0,5897 B: Time 0.000156776 2 0.000783878 0.54 0,5839 INTERACTIONS AB 0.00292034 1 0,00146017 1.01 0,3694 RESIDUAL 0.1085 75 0,00144666 --- TOTAL (CORRECTED) 0.113 80 --- All F-ratios are based on the residual mean square error.
4.3 Effect of alcohol consumption on driving skills
The time of reaction both in the sober state and after alcohol ingestion was calculated for each individual participating in the driving simulator test through the software connected with the automatic vehicle. Our results confirmed a cognitive impairment consequent to alcohol consumption, showing a significant increase in the time of reaction after alcohol ingestion (test 2) compared to the sober state (test 1) (P value= 0.000) (Fig. 10).
Fig. 10: Increase in time of reaction after alcohol ingestion: Means and 95.0 percent LSD intervals.
0 1 2 Medie e Intervalli LSD al 95,0 percento
DAT1 1,8 2,2 2,6 3 3,4 3,8 4,2 4,6 5 T e s t 1
Regarding the DAT1 3'- VNTR, the study population has been divided into 3 groups: group 0 which includes the homozygous for the 10R allele, group 1 of the heterozygous (9R/10R), and group 2 which includes the homozygous for the 9R allele. Our analysis revealed a slightly significant decrease in the time of reaction in the homozygous for the 9R allele, both in test 1 conducted in the sober state (Table 11; Fig. 11) and in test 2 after alcohol ingestion (Table 12; Fig. 12).
Table 11:
DAT1 3’-VNTR Analysis of Variance for Test 1 - Type III Sums of Squares
--- Source Sum of Squares Df Mean Square F-Ratio P-Value --- MAIN EFFECTS A: DAT1 6.96904 2 3.48452 10.48 0,0001 B: ID(DAT1) 170.046 32 5.31395 15.99 0,0000 RESIDUAL 43.5475 131 0,332423 --- TOTAL (CORRECTED) 218.926 165 --- All F-ratios are based on the residual mean square error.
Fig. 11: Association between genotype for the DAT1 3’-VNTR (group 0: 10R/10R; group 1: 9R/10R; group 2: 9R/9R) and Time of reaction in Test 1: means and 95.0 percent LSD intervals.
0 1 2 Medie e Intervalli LSD al 95,0 percento
DAT1 1,8 2,2 2,6 3 3,4 3,8 4,2 4,6 5 T e s t 2 Table 12:
DAT1 3’-VNTR Analysis of Variance for Test 2 - Type III Sums of Squares
--- Source Sum of Squares Df Mean Square F-Ratio P-Value --- MAIN EFFECTS A: DAT1 2.60329 2 1.30164 2.51 0,0853 B: ID(DAT1) 225.795 32 7.05608 13.58 0,0000 RESIDUAL 72.2208 139 0,519574 --- TOTAL (CORRECTED) 312.656 173 --- All F-ratios are based on the residual mean square error.
Fig. 12: Association between genotype for the DAT1 3’-VNTR (group 0: 10R/10R; group 1: 9R/10R; group 2: 9R/9R) and Time of reaction in Test 2: means and 95.0 percent LSD intervals.
With regard to polymorphisms in the metabolic genes, only rs11936869 and rs1693482, both residing in the ADH1C gene, appeared to affect the reaction times in the driving simulation. In detail, reaction time appeared significantly reduced in carriers of the rare allele for rs11936869 (Tables 13-14; Fig. 13-14), regardless of alcohol ingestion; otherwise, reaction time was significantly increased in carriers of the rare allele for rs1693482 (Tables 15-16; Fig. 15-16), regardless of alcohol ingestion. Newly, analyses have been conducted dividing the study population into the 3 groups of the homozygous
0 1 2 Medie e Intervalli LSD al 95,0 percento
ADH1C(1) 1,8 2,8 3,8 4,8 5,8 6,8 T e s t_ 1
for the common alleles (group 0), heterozygous (group 1), and homozygous for the minor allele (group 2).
Table 13:
rs11936869 - Analysis of Variance for Test 1 - Type III Sums of Squares
--- Source Sum of Squares Df Mean Square F-Ratio P-Value --- MAIN EFFECTS A: rs11936869 8.66761 2 4.33381 9.18 0,0002 B: ID(rs11936869) 246.223 38 6.47955 13.73 0,0000 RESIDUAL 72.23 153 0,472092 --- TOTAL (CORRECTED) 326.38 193 --- All F-ratios are based on the residual mean square error.
Fig. 13: Association between genotype for rs11936869 (group 0: C/C; group 1: C/G; group 2: G/G) and Time of reaction in Test 1: means and 95.0 percent LSD intervals.
0 1 2 Medie e Intervalli LSD al 95,0 percento
ADH1C(1) 1,8 2,8 3,8 4,8 5,8 6,8 T e s t_ 2 Table 14:
rs11936869 - Analysis of Variance for Test 2 - Type III Sums of Squares
--- Source Sum of Squares Df Mean Square F-Ratio P-Value --- MAIN EFFECTS A: rs11936869 17.1416 2 8.57078 14.00 0,0000 B: ID(rs11936869) 152.523 18 8.47351 13.73 0,0000 RESIDUAL 51.4312 84 0,612277 --- TOTAL (CORRECTED) 204.412 104 --- All F-ratios are based on the residual mean square error.
Fig. 14: Association between genotype for rs11936869 (group 0: C/C; group 1: C/G; group 2: G/G) and Time of reaction in Test 2: means and 95.0 percent LSD intervals.
Table 15:
rs1693482 - Analysis of Variance for Test 1 - Type III Sums of Squares
--- Source Sum of Squares Df Mean Square F-Ratio P-Value --- MAIN EFFECTS A: rs1693482 7.87444 2 3.93722 8.19 0,0004 B: ID(rs1693482) 237.932 38 6.26136 13.03 0,0000 RESIDUAL 71.1727 148 0,480897 --- TOTAL (CORRECTED) 325.363 188 --- All F-ratios are based on the residual mean square error.
Fig. 15: Association between genotype for rs1693482 (group 0: C/C; group 1: C/T; group 2: T/T) and Time of reaction in Test 1: means and 95.0 percent LSD intervals.
0 1 2
Medie e Intervalli LSD al 95,0 percento
ADH1C(8) 1,8 2,3 2,8 3,3 3,8 4,3 4,8 5,3 5,8 T e s t_ 1 rs1693482
Table 16:
rs1693482 - Analysis of Variance for Test 2 - Type III Sums of Squares
--- Source Sum of Squares Df Mean Square F-Ratio P-Value --- MAIN EFFECTS A: rs1693482 9.20105 2 4.60053 8.55 0,0004 B: ID(rs1693482) 151.086 18 8.39368 15.60 0,0000 RESIDUAL 42.5051 79 0,53804 --- TOTAL (CORRECTED) 200.068 99 --- All F-ratios are based on the residual mean square error.
Fig. 16: Association between genotype for rs1693482 (group 0: C/C; group 1: C/T; group 2: T/T)and Time of reaction in Test 2: means and 95.0 percent LSD intervals.
0 1 2
Medie e Intervalli LSD al 95,0 percento
ADH1C(8) 1,8 2,3 2,8 3,3 3,8 4,3 4,8 5,3 5,8 T e s t_ 2 rs1693482
5. Discussion
The first question we had to answer in this study on the individual variability in ethanol elimination rate has been which was the most appropriate method to calculate the dose of ethanol to be administered. Literature on studies of ethanol elimination rate is little and most of studies don’t address this matter. Often, the dose of ethanol is calculated on the base of the body weight, not taking into account many variables which can be confounders. For example, between two subjects having the same body weight, the body composition and the total amount of body water could be not the same. Since ethanol distributes in the water spaces, the well muscled one between the two would reach lower BAC than the other, showing a different kinetic. In the light of this, we tested two different principles. In a first test, we decided to administer ethanol like a drug and we calculated the dose of wine on the base of BSA, using an on line calculator routinely used for drug dosage. Then, in a second test, we calculated the doses of wine on the base of total body water amount, obtained by bioelectrical impedance analysis. Relating the values of BSA and BIA we obtained a correlation of 91%, showing that the two principles are both valid for this kind of studies. Anyway, since it is well known that the rate of metabolism increases with the decreasing of the body surface area, BSA seemed to us a more realistic index of the individual metabolic rate. In fact, the analyses confirmed that the average alcohol disposal in our tests didn’t depend on dose, but really on the individual metabolic capacity. In summary, we can claim to have developed an effective and immediate method for calculating the dose of ethanol to be administered in studies of ethanol elimination rate. First aim of our work was to find a possible correlation between the different genotypes for the 13 SNPs selected in the genes involved in ethanol biotransformation and different phenotypes of ethanol elimination kinetic. This association has been investigated drawing
the curves of disposal for each volunteer and calculating the AUC values. AUC is a parameter
normally used by pharmacologists as an index of the amount of a drug into the bloodstream in a time interval after its administration. Under certain assumptions AUC depends proportionally on the amount of drug that enters the bloodstream and on the system capacity to eliminate the drug (clearance).
Among the SNPs considered only the rs1614972, within the ADH1C1 gene, seems to influence the ethanol elimination rate (P value= 0.0151). In particular, ethanol disposal seems to be faster in the homozygous C/C subjects, compared to carriers of the minor allele. The polymorphism rs1614972 is responsible for a nucleotide change from C>T within the intron 8. It is now known that intronic polymorphisms can affect the activity of a gene, interfering with the promoter region or with the splicing sites, or also acting on microRNAs. It is thus possible that a deregulation of the gene, deriving from the nucleotidic substitution, affects the speed of disposal.
Interestingly, we also found a circadian difference in ethanol elimination rate, with an accelerated ethanol metabolism in the afternoon and in the evening compared to morning. Although a number of studies of chronobiology are based on circadian variations observed in ethanol metabolism (chronokinetics) and effects (chronotoxicity), this is still an unresolved matter, as some studies have observed such variability (54), but others have not (55).
In the light of our results, anyway, to consider a possible temporal variation in ethanol metabolism, and consequentially varying blood alcohol levels, would be a good practice when approaching a study of alcohol elimination rate.
Trying to give a concrete explanation to the acceleration of metabolism observed in the afternoon, we hypothesized it was due to induction of genes involved in the elimination of
ethanol, and prepared a study on the expression of ALDH2 gene by in vivo experiments. Our sample is still too small to draw definite conclusions, but, so far, results don’t follow those obtained from Kimura et al. in 2009 (19) on a sample of 21 Japanese male. In this study, all the volunteers showed increased ALDH2 mRNA levels after ethanol ingestion, regardless of the genotype for rs886205. Our data, instead, don’t show a significant
ALDH2 gene expression increase for either group of subjects analyzed (promoter group 1:
G/G; promoter group 2: G/A + AA). As often happens in the few works found in literature, the authors chose to calculate the dose of wine to be administered only on the base of the body weight, exactly 0.4 g/kg of body weight. This amount of ethanol is much higher and very distant from the quantity which people really consume during a standard meal, and we are inclined to believe that findings based on the administration of a large dose of alcohol are not very accurate and could depend on dose and not on the real individual response. Otherwise, we chose to normalize the dose of ethanol on gender and BSA differences. This way, the individual response is not biased from those individual characteristics which affect specially ethanol distribution in the body. Moreover, we obtained a dose of ethanol, varying from one to two glasses of wine for different persons, very similar to the moderate dose of alcohol ingested during a daily meal. Our intention, in fact, was to recreate conditions as much as possible close to reality, so that our data could be useful in the social contest.
Turning to more general aspects of alcohol consumption, our driving simulations showed a significant slowing of reaction time in front of a sudden event after taking a moderate amount of alcohol. This impairment may be due in part to the effect of alcohol on the cerebellum, which has been revealed by functional imaging during simulated driving. Acute alcohol intoxication, in fact, temporarily affects cerebellar function, producing symptoms that resemble mild or moderate cerebellar ataxia, including loss of coordination