Ph.D. Thesis
in
Physics
UNIVERISTY OF CATANIA
INFN – LABORATORI NAZIONALI DEL SUD
A MOBILE XRF SCANNER FOR A REAL-TIME
ELEMENTAL IMAGING OF PAINTED ARTWORKS
Claudia Caliri
Supervisor: Dr. Francesco Paolo Romano
Tutor: Prof. Dr. Agatino Musumarra
January 2017
Contents
Introduction
... 12Chapter 1: The paintings
... 151.1. Scientific investigation of paintings ... 19
1.1.1 XRF technique in Art and Archeology ... 19
1.2. XRF imaging techniques ... 21
1.3. Other imaging techniques ... 23
1.3.1 Multispectral Imaging (MSI) ... 24
1.3.2 Infra Red Reflectography (IRR) ... 26
1.3.3 X-Rays Radiography (XRR) ... 29
1.3.4 Neutron Activation Auto-Radiography (NAAR) ... 31
Chapter 2: X-ray Fluorescence Spectroscopy
... 342.1 Basic Interaction between photons and atoms ... 34
2.1.1 Mass attenuation and linear attenuation coefficient ... 34
2.1.2 Atomic cross-section ... 36
2.1.3 Photo-absorption process ... 37
2.1.4 Excitation and de-excitation of an atom ... 37
2.1.5 Auger emission and Coster-Kroning transition ... 40
2.1.6 Scattering processes ... 43
2.1.7 Compton scattering ... 43
2.1.8 Electron binding and Doppler correction ... 45
2.1.9 Rayleigh Scattering ... 46
2.2 Direct and Indirect Excitation ... 47
2.2.1 Fluorescent radiation excited by polychromatic sources on a bulk material . 47 2.2.2 Fluorescent radiation excited by polychromatic sources on a thin film ... 48
2.2.3 Indirect Excitation ... 48
2.3 Refraction and reflection of X-rays ... 48
2.4 Polycapillary Optics ... 51
2.4.1 Multiple reflections of photons ... 52
2.4.2 Intensity gain ... 53
2.4.3 Spot beam size ... 53
2.4.4 Bent polycapillary ... 53
2.4.5 Multiple reflections on a bent surface ... 55
2.4.6 Coupling polycapillary optics to an X-ray tube... 56
3
2.6.1 Detection Efficiency ... 62
2.6.2 Energy Resolution ... 63
2.6.3 Silicon Drift Detector ... 64
Chapter 3: Mobile scanning MA-XRF
... 673.1. The measurement head ... 67
3.1.1 X-ray Source and detection system ... 68
3.1.2 Irradiation and detection geometry ... 71
3.1.3 Microscope system ... 73
3.1.4 Laser sensor for a dynamic determination and correction of distances ... 74
3.2. The XYZ high precision travel system ... 75
3.3. Control Unit ... 76 3.3.1 Detector window ... 77 3.3.2 Laser window ... 78 3.3.3 Axis window ... 79 3.3.4 Acquisition window ... 80 3.4. Figures of merit ... 81 3.5. Beam-size measurement ... 83 3.6. Lateral resolution ... 85
3.7. MA-XRF system scanning speed performances ... 86
3.8. Step mode and continuous mapping ... 88
3.9. Spectra analysis ... 91
3.9.1 Spectrum evaluation ... 91
3.9.2 Peak shape model ... 93
3.9.3 Continuum/Background evaluation ... 94
3.10. In-house programmed software ... 95
Chapter 4: MA-XRF cases-study
... 994.1. The Paston Treasure: origin and art history ... 99
4.2. In situ non invasive MA-XRF investigation ... 101
4.2.1 Elemental distribution images ... 103
4.2.2 Canvas preparation and white pigments ... 104
4.2.3 Red pigments ... 106
4.2.4 Green and Blue pigments ... 108
4.2.5 Brown pigments and ochres ... 109
4.2.6 Yellow pigments ... 110
4.2.8 Smalt ... 112
4.2.9 Lake pigments ... 114
4.2.10 The mysterious overpainted figure ... 114
4.3. The Tomb of Kha and Merit (1428-1351 BC) ... 116
4.4. MA-XRF analysis on Egyptian wooden coffers ... 117
4.4.1 Elemental distribution images ... 118
4.4.2 Ground layer and white pigments ... 121
4.4.3 Blue pigments ... 124
4.4.4 Reddish-brown pigments ... 127
4.4.5 Yellow pigments ... 130
4.4.6 Black pigments ... 131
4.4.7 “Pentimenti” of the original painting and hidden inscriptions ... 133
4.5. Illuminated Manuscripts ... 136
4.6. MA-XRF analysis of miniatures ... 138
4.7. The pigments palette of the illuminators ... 139
4.7.1 Parchment preparation and white pigments... 140
4.7.2 Red pigments and hidden text ... 142
4.7.3 Yellow, Orange and Brown Pigments ... 143
4.7.4 Green and Blue pigments ... 148
4.7.5 Gold ... 150
APPENDIX-A: Micro-XRF imaging ... 152
APPENDIX-B: Main cited pigments ... 156
Conclusions and prospective
... 1635
Abbreviations
XRF X-ray Fluorescence
SR Synchrotron Radiation
MA-XRF Macro-XRF
MSI Multispectral Imaging
XRR X-ray Radiography
NAAR Neutron Activation Auto-Radiography
FWHM Full-Width-at-Half-Maximum
FP Fundamental Parameters
SDD Silicon Drift Detectors
DXP Digital X-ray Processor
RTOS Real Time Operative System
CU Control Unit
ICR/OCR Input/Output Count Rate
FoM Figure of Merit
Y Chemical sensitivity
LOD Limits of Detection
cps counts per second
µ-XRF micro-XRF
TLIST Time List
ROI Region of Interest
Index of figures
Figure 1: structure of a painting ... 15
Figure 2: schematic of X-ray fluorescence technique. ... 20
Figure 3: imaging techniques energy ranges and corresponding penetration depth into painting structure. ... 24
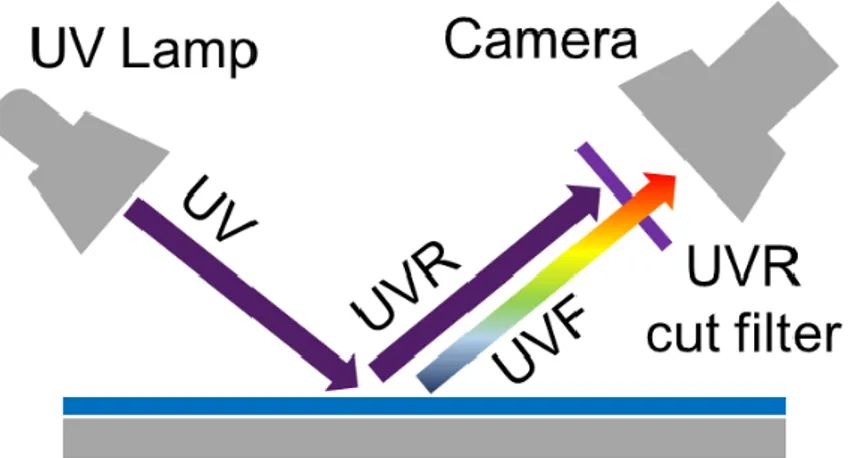
Figure 4: setup for Ultraviolet reflection (UVR) and fluorescence (UVF) analysis. ... 25
Figure 5: (left) Setup for Infrared (IRR) reflected (IRR) and fluorescence (IRF) analysis; (right) Infrared transmitted setup (IRT)... 26
Figure 6: X-ray radiography setup... 29
Figure 7: NAAR experimental setup. ... 32
Figure 8: cross section and mass absorption coefficient for incident photons between 1 keV and 100 keV on a lead (Pb) target. ... 36
Figure 9: photoelectron interactions diagram. ... 41
Figure 10: florescence yields, Auger electrons and Coster-Kronig after the K-, L1-, L2- or L3-photoelectric effect ... 42
Figure 11: cross section for Compton and Rayleigh scattering as function of energy of incident photons and atomic number of the atomic target... 43
Figure 12: Compton scattering in the assumption of free electron at rest. ... 44
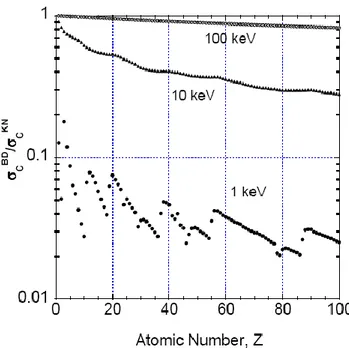
Figure 13: ratio of the bound-electron Compton scattering cross section 𝜎𝑐𝐵𝐷and that for free electrons evaluated from the Klein-Nishina formula 𝜎𝑐𝐾𝑁 ... 46
Figure 14: X-ray refraction scheme. ... 49
Figure 15: critical angle of total external reflection on glass as function of the energy of photons ... 50
Figure 16: reflection coefficient as function of angle on a glass surface. ... 51
Figure 17: lens for X-rays. ... 52
Figure 18: working principle of a polycapillary ... 52
Figure 19: full lens and half-lens ... 54
Figure 20: capture zone for a bent polycapillary ... 55
Figure 21: transmission versus energy for a focusing optic ... 55
Figure 22: geometric parameters of a focusing polycapillary ... 56
7
analysis software ... 60
Figure 26: Fe spectrum acquired by Silicon Drift Detector. ... 63
Figure 27: scheme of the working principle of a SDD detector ... 65
Figure 28: scheme of a SSD sensor. ... 66
Figure 29: measurement head equipped on MA-XRF scanner. ... 68
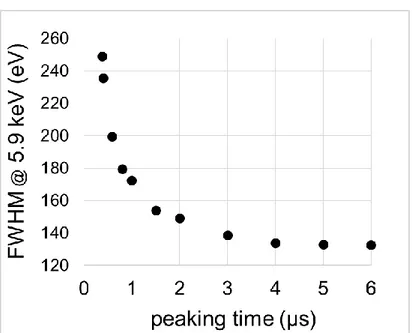
Figure 30: energy resolution measured at 5.9 keV for different peaking times of the Digital X-ray Processor (DXP). ... 69
Figure 31: energy resolution versus Ouput Count Rate (OCR). ... 70
Figure 32: spectrometer geometry. ... 72
Figure 33: fluorescence radiation transmitted before to be detected. ... 73
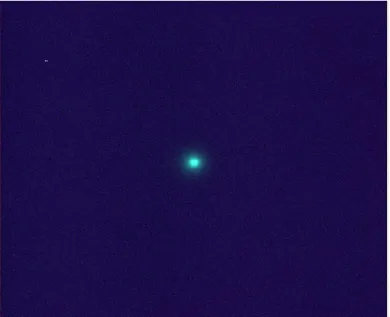
Figure 34: microscope image of the beam spot transmitted by a polycapillary lens at the focus distance. ... 74
Figure 35: MA-XRF scanner for the analysis of “Paston Treasure” at Norwich Museum (UK). ... 76
Figure 36: cRio architecture scheme. ... 77
Figure 37: detector sub-window of the graphic interface... 78
Figure 38: laser sub-window of the graphical interface. ... 79
Figure 39: axis sub-window of the graphical interface. ... 80
Figure 40: acquisition sub-window of the graphical interface. ... 81
Figure 41: K-lines sensitivity for elements from K (Z = 19) to Sr (Z = 38). ... 82
Figure 42: K-lines limit of detection for the elements from K (Z = 19) to Sr (Z = 38). ... 83
Figure 43: Fe-Mo knife edge at the microscope. ... 84
Figure 44: Mo-Kα counts versus horizontal position (x-direction). ... 84
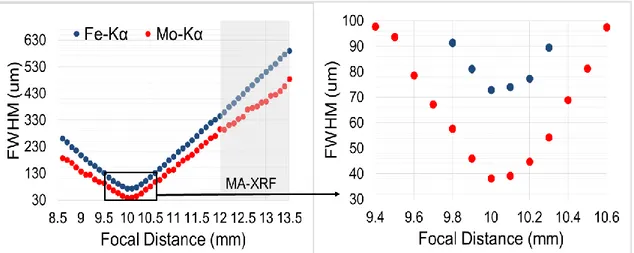
Figure 45: beam sizes along z- direction determined for Fe-Kα-line and Mo-Kα-line energy. ... 85
Figure 46: Cr- Kα map of the USAF1951 resolution test target. ... 86
Figure 47: sum spectra comparison. ... 87
Figure 48: Ti-K and Se-K images acquired at different scanning speeds ... 88
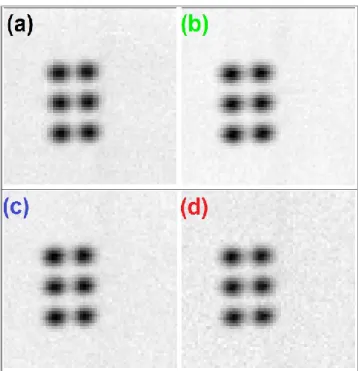
Figure 49: Cu-K maps of a copper target performed in step mode (a) and continuous mode at different scanning speed: 10 µm/sec (b), 20 µm/sec (c) and 40 µm/sec (d). ... 90
Figure 50: cumulative spectra comparison ... 90
Figure 52: analysis software in running on a laptop connected to Control Unit. ... 95
Figure 53:(near) real-time maps creation using in-house programmed analysis software. . 96
Figure 54: shift correction of images in live mode. ... 97
Figure 55: RGB composite image. ... 97
Figure 56: sum spectrum and spectrum of maxima calculated in live mode. ... 98
Figure 57: Paton Treasure, oil on canvas, 165 cm x 246.5 cm, Norwich Castle Museum. ... 100
Figure 58: RGB composite image of the entire surface of painting subdivided in five sub-areas during the measurements. ... 101
Figure 59: MA-XRF measurement on the Paston Treasure. ... 102
Figure 60: sum spectrum measured on the entire painted surface. ... 103
Figure 61: spectrum of maxima measured on the entire painted surface ... 103
Figure 62: Pb-L image and some painting details where lead white was used (1-6). ... 105
Figure 63: Blue: Pb-L - Red: Ca-K composite image. ... 105
Figure 64: Ca-K distribution image. ... 106
Figure 65: Hg-L image and composite images: (2) Red: Hg-L - Blue: Pb-L, (3) Red: Hg-L - Blue: Fe-K. ... 107
Figure 66: Cu-K image and some painting details where copper was used (1-4). ... 109
Figure 67: Fe-K distribution image and some painting details where iron was used (1-4). ... 110
Figure 68: Sn-L distribution image and some painting details where tin was used (1-6). 111 Figure 69: As-K image and some painting details where arsenic sulphide was used (1-7). ... 112
Figure 70: Co-K image and some painting details where smalt was used (1-6). ... 113
Figure 71: Red: Co-K and Green: K-K composite image identifies the presence of smalt in the yellow areas. ... 114
Figure 72: hidden woman unveiled by previous XRR and MA-XRF analysis. ... 115
Figure 73: the painted wooden coffers analysed by MA-XRF at the Egyptian Museum (Turin, IT) (Kha and Merit tomb, New Kingdom, 18th Dynasty)... 117
Figure 74: MA-XRF scanner in execution installed at the Egyptian Museum. ... 118
Figure 75: painted surface on wooden coffer (S.8613-New Kingdom, 18th Dynasty) analysed by MA-XRF technique at the Egyptian Museum (Turin, IT)... 119
Figure 76: sum spectrum of the entire painted surface. ... 119
9 Figure 80: Ca-K images obtained from the MA-XRF analysis on the artworks S.8212,
S.8213, and S.8440 (from top to bottom). ... 124
Figure 81: (top) Cu-K image and some painting details where copper-based pigments were used, (bottom) the Red: Ca-K –Blue: Cu-K composite image identifies the Egyptian blue presence. ... 125
Figure 82: comparison between XRF cumulative spectra taken in three different areas of the painting (area 1-3). ... 126
Figure 83: Ca-K (red) - Cu-K (blue) composite image (artwork S.8440) ... 127
Figure 84: Fe-K distribution image and some painting details where ochres were used. . 128
Figure 85: area 1 (right) and area 3 (left) normalized cumulative spectra. ... 129
Figure 86: cumulative spectra in two different areas (1-2) of the artwork S.8213. ... 130
Figure 87: Red: As-K – Green: S-K composite image. ... 131
Figure 88: Mn-K image. ... 132
Figure 89: Red: Ca-K – Green: Mn-K – Blue: Cu-K composite image (artwork S.8212). ... 133
Figure 90: Red: Ca-K – Green: Mn-K – Blue: Cu-K composite image (artwork S.8213). ... 133
Figure 91: modifications to the original drawing visible in the Red: As-K – Green: Fe-K composite image. ... 134
Figure 92: hieroglyphic inscription visible in the ROI-Compton scattering peak and Cu-K maps. ... 135
Figure 93: (top) illuminated manuscript Marlay cuttings It. 13A “Presentation in the Temple (300 x 270 mm2, 1370-1375) painted by Don Silvestro dei Gherarducci (Florence, Italy). The manuscript belongs to the Department of Manuscripts and Printed Books of The Fitzwilliam Museum (Cambridge, UK); (bottom) detail of the tooled gold halos of Simeon (1) and the infant Christ (2). ... 137
Figure 94: MA-XRF scanner installed at the Fitzwilliam museum... 138
Figure 95: sum spectrum and spectrum of maximum pixel obtained by the MA-XRF analysis of the entire surface of the illuminated manuscript Marlay cuttings It. 13A... 139
Figure 96: Ca-K image and composite image : Red: Ca-K – Blue: Sr-K (right). ... 141
Figure 97: Ca-K image and composite image: Red: Ca-K – Blue: Sr-K. ... 141
Figure 99: normalized spectra related to the area 1 and area 2 in the painting (Figure 97). ... 142 Figure 100: (top) Hg-L image and composite image Hg-L + Zn-K; (bottom) pictorial details characterized by the mercury presence (1-2) and the flipped left-to-right inscription visible in the Hg-L map (3). ... 143 Figure 101: (top) Sn-L image and detailed composite image (Red: Fe-K – Blue: Sn-L) related to area 1, (bottom) cumulative spectra related to the area 1 (20 × 25 pxl), area 2 (15 × 15 pxl), and area 3 (20 × 15 pxl) of the painting. ... 145 Figure 102: RGB: Sn-L – Hg-L – Pb-L composite image of a selected painted area, cumulative spectrum related to the selected area 1. ... 146 Figure 103: Fe-K image and pictorial details characterized by the ochres presence ... 147 Figure 104: RGB: Fe-K - Sn-L - Pb-L composite image ... 147 Figure 105: composite image Green: Cu-K – Blue: K-K and pictorial details characterized by copper (1-2) and potassium presence (3-5). ... 149 Figure 106: composite image Red: K-K – Blue: Pb-L and pictorial details characterized by potassium-lead mixture (3). ... 150 Figure 107: (top) Au-L image and composite image Red: Au-L – Blue: Fe-K, (bottom) pictorial details characterized by gold presence (1-2) and cumulative spectra comparison between a single and a double gold layer taken in rectangular selection (area 1). ... 151 Figure 108: copy of Madonna and Child with Saints Rosalia, Peter and Paul painted by Anthon van Dyck (1629, 45×35 cm2 size, private collection) (top), selected area investigated
by micro-XRF technique (a), microscope image of the selected area (b). ... 153 Figure 109: micro-XRF images obtained on a selected area of the painting (800 × 800 pixels, i.e., 2× 2 cm2). ... 154
Figure 110: composite image Red: As-K – Green: Cu-K (a); composite image Red: Cr-K – Green: Ba-K (b), Ti-K and Zn-K images (c-d). ... 155
11
Index of tables
Table 1: Inorganic pigments. ... 19
Table 2: Classication of elementary photon interactions... 37
Table 3: Some K-shell absorption jump ratios ... 38
Table 4: Nomenclature of X-ray lines. IUPAC (i.e. K-L3) and Siegbahn (i.e. Kα1) notation ... 39
Table 5: Some measured relative intensities ... 39
Table 6: Some K fluorescence yields ... 41
Table 7: beam size and gain of polycapillary lens... 68
Table 8: DXP technical specifications... 71
Table 9: Optical resolution data of microscope. ... 73
Table 10: Main inorganic Egyptian pigments used in the 18th Dynasty (New Kingdom). 121 Table 11: As-Fe K-lines ratio calculated in different sub-areas (1-3) of the painting... 129
Introduction
Paintings, come down to us and nowadays collocated in galleries and museums, are a valuable part of the cultural heritage of mankind. Their artistic, aesthetic and historical relevance categorizes them as objects of inestimable value. The pictorial art has seen over the time the evolution of several techniques that differ mainly in pigments and supports. Art historians and conservators are constantly concerned with the questions of where, when and by whom a painting was made. In many cases, stylistic considerations combined with aesthetic evaluations and archive studies are not able to provide comprehensive answers. Further, styles were sometimes imitated and attribution can be difficult to be determined. A painting consists of several layers subsequently applied for giving the desired optical effect: the shine of colors, the suggestion of shadows or the convincing illusion of an object’s texture, are realized by deliberately including multiple layers. In many historical paintings, pictorial layers have been applied for purposely hiding previous drawings due to a changing of the intent of the artist. The understanding of the chemical nature of pigments and the study of the creative process through the visualization of hidden figures “overpaintings” and retouches “pentimenti” create a direct link with the historic period of the artwork and they are helpful for its authentication.
The preciousness of the paintings requires the assessment of their integrity and the continuous attention of their state of conservation. Discoloring and degradation processes of paints must be cured or prevented before they become visible. Thus, the knowledge of the original materials is of crucial importance for the programming a restoration treatment or for the choice of environmental conditions of conservation, in manner to preserve their original structure as much possible.
In this context, historical paintings have been object of intensive studies for several decades. A large range of spectroscopic and spectrometric methods have been developed and combined for the understanding compositional aspects as well as to know stratigraphy. Scientific investigations need to preserve the original structure of the painting, limiting to the minimum the sampling. In order to fulfil this mandatory requirement, the development of non-destructive techniques (mainly based on portable instrumentation), allowed to not expose artworks to environmental stress or damage risks and it increased considerably the number of investigated objects, contributing to expand their knowledge and conservation procedures.
Nowadays, macro X-ray fluorescence (MA-XRF) is a well-established technique for the non-invasive and element-specific imaging of painted surfaces. It allows the determination of the spatial distribution of chemical elements over large areas, thus enabling to infer the presence of pigments or mixtures thereof across the entire surface of a work of art.
13 Its multispectral capabilities allow gaining information on pigments below the visible surface and to put in evidence the existence of hidden details. The technique is performed by scanning the painting with an X-ray beam of few hundreds of microns and the fluorescence radiation, properly detected, is used to build-up point-by-point the chemical mapping with high spatial resolution.
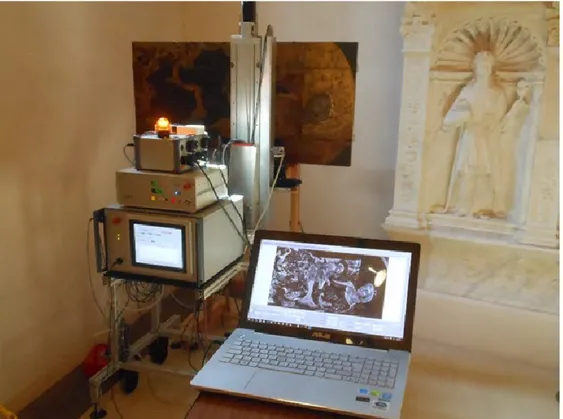
Recently, a novel mobile MA-XRF scanner has been developed allowing the (near) real-time elemental imaging of large dimension painted artworks.
To date, performances of this device in terms of lateral resolution, scanning speed and dimensions of the scanning area, makes it as one of the most (or even the most) efficient portable MA-XRF systems available in the scientific community for studying paintings. The development of the MA-XRF scanner and its application to the study of painted artworks represents the focus of this PhD project carried out at the LANDIS laboratory of LNS-INFN and IBAM-CNR in Catania (Italy).
The instrument is based on microfocus X-ray tube coupled to a polycapillary optic for transmission and focusing of primary radiation on the sample. The fluorescence induced on the sample is detected by a large area SDD detector operating in time-list event-mode. The scanner is fully controlled by a custom developed control unit programmed for the real-time control of all sensors and for a real-time data analysis. It allows the analysis of large surfaces up to 110 X 70 cm2. MA-XRF elemental mapping is performed with a sub-millimetric lateral
resolution by placing the painting out-of-focus of the optic. However, images with a lateral resolution of 38 µm can be achieved for analysis of pictorial details with a simple adjustment of sample in the optic focus position. MA-XRF scanner operates acquisitions in continuous mode with a maximum scanning speed of 100 mm sec-1, covering the full area in 4.2 hours.
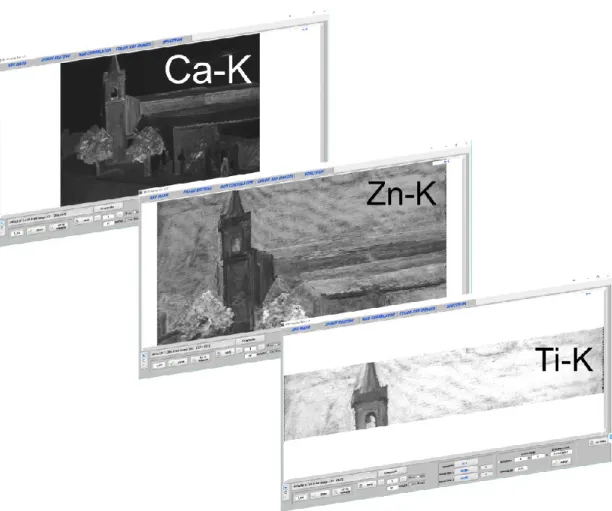
MA-XRF scanner works with an in-house programmed software allowing a real-time least square fitting of pixel spectra. Up to 5000 fit per second are operated in a live mode. Elemental maps are available for interpretation at the end of scanning.
The analytical capabilities of the scanner have been verified in a number of case-studies in collaboration with Museums and for which the MA-XRF scanner has been used in-situ. In the present PhD work we discuss MA-XRF technique applied for studying three different typologies of artworks.
As a first example, it is presented the MA-XRF investigation of “Paston Treasure”, a precious painting allocated at the Norwich Castle Museum (UK) and considered one among the most important painting in the history of British Arts. The research activity was carried out in collaboration with the Fitzwilliam Museum (UK, Cambridge), the Yale Centre for British Art (USA) and the Norwich Castel Museum (Norwich). MA-XRF analysis has provided knowledge of original painting materials of the artist and information concerning the creative process. Elemental images have revealed a hidden figure of a woman in the center of the composition and details emerged by X-rays analysis as her gown and hair ornaments have been helpful for inferring her identity, still now object to various interpretations.
Introduction
As a second example, it is discussed the use of MA-XRF at the Museo Egizio in Torino (Italy) for analysis of the funerary objects in the tomb of Kha and Merit (1428-1351 BC). This is one of very few known examples of Egyptian tombs never depredated before its discovery and never subject to the scientific analysis. The elemental maps of painted wooden coffers has revealed a complex palette of pigments and presence of hidden “pentimenti” identified in the painted scenes. Some parts of the written text in the body of the coffers that has become unreadable over the time was unveiled as well.
Finally, a collaboration with the Fitzwilliam Museum, has seen MA-XRF analysis of illuminated manuscripts, created in Italy during 14th century. MA-XRF analysis has allowed
to study the palette employed by illuminators, contextualizing their historic attribution. Further, macroscopic X-ray imaging allows to make readable the inscriptions in Latin present on the back side of the fragment, until then never decoded.
This work is arranged in four main Chapters:
The first Chapter discusses capabilities and potentialities of several imaging techniques that have given a great contribution in the field of art and conservation, with major emphasis to MA-XRF methodology.
The second Chapter is dedicated to fundamental aspects of the X-ray fluorescence and components to be used in X-ray spectrometry.
The third Chapter discusses the development of the MA-XRF scanner trough the detailed description of components, sensors and control system. The presentation of spectrometric figures of merit, acquisition-scanning mode and scanning speeds performances is also included in the third session of this work. In addition, the third Chapter explains the architecture and the functionalities of the in-house programmed software for the real-time elaboration of the images.
Finally, in the fourth Chapter the value of the technique is illustrated through the presentation of three analytical cases. Analytical results are presented and discussed.
Chapter
1
The paintings
Since antiquity up to the modern times paintings reflect the evolution of human creativity in application of natural and synthetic pigment materials on different pictorial supports. Paintings are complex materials with a multi-layered structure. In a very general description they can be schematized as in the sketch of Figure 1 [1].
The first layer is the support that can be of different nature. Since the intensive production of painting from middle ages up to the modern time, easel paintings making use of canvas or wood panels as pictorial supports are the most significant. However, other materials like metals, paper, parchments, marbles, etc., have been used since antiquity.
In the case of canvases, they were mounted on a frame and covered with an organic gelatinous glue for ensuring its protection and a sufficient adhesion of successive layers. The layer over the canvas is the ground. It is an intermediate layer between the support and the painting. A common materials used as a ground was whited gypsum or chalk (CaCO3), forming a smooth surface ready for the paint application. A white ground was employed for its capability of creating artistic effects on the full paintings (for instance giving more brightness to the colours). The ground composition was subject to changes over the time and even coloured ground have be used. Typically, they were obtained with a layer of lead-white (2PbCO3·Pb(OH)2), gypsum (CaSO4·2H2O), and a mixture of earth pigments.
The ground is usually used by the artists to draw initial sketch of their work by using charcoal, chalk, metal points, inks, etc.
Chapter 1.The paintings
The layer over the ground is the artistic paint, obtained by a mixture of fine powders responsible for the color: the pigments. A binder is used to keeps the particles of these powders together. Among binders for oil paintings there are walnut, linseed, and poppy seed oils, among binders for tempera, egg yolk, egg white, casein and Arabic gum are mostly employed. Sometimes, paint may also contain a diluent to make the paint spread more uniformly and (or) to change its transparency to the desired degree.
The varnish layer is transparent and optional. It may just bring addition protection to the outer layers of the painting or enhance the visual perception of the paint layers underneath. Varnish is often made of natural or synthetic resin.
Pigments represent an extended topic including nature of raw materials, manufacturing technologies, painting techniques [2]. They are both organic (e.g., madder lake, indigo) and
inorganic (e.g. smalt, vermilion). Mostly, they can be found in nature as minerals, while
others are prepared artificially. They can be found in the artworks as pure pigments or as mixture at a typical concentration level of several mass percent and thickness form a few up to tens of microns. Table 1summarizes some of the most commons pigments used in paintings including the period of use from antiquity since modern time.
17 Blue pigments Chemical name Formula Source/Date Used until
Azurite (Blue verditer)
Basic copper (II)
carbonate 2 CuCO3 · Cu(OH)2
mineral (Egyptians)
/artificial (1600) 1700
Cerulean Blue Cobalt (II) stannate CoO · n SnO2 artificial 1821 in use
Cobalt Blue Cobalt (II)-doped alumina glass CoO · Al2O3 artificial 1775 In use
Egyptian Blue Calcium copper (II) silicate CaCuSi4O10 mineral third millenium BC Romans
Lazurite
(from Lapis Lazuli) Utramarine
sulfur-containing sodium aluminum
silicate Na
8-10Al6Si6O24S2-4 mineral 1100 artificial 1828 in use
Manganese Blue Barium manganate (VII) sulfate BaMnO4-BaSO4 artificial 1907 in use
Phthalocyanine
Blue (Winsor Blue) Copper (II) phtalocyanine C32H16N8Cu artificial 1936 in use
Prussian Blue Iron (III) hexacyanoferrate
(III) Fe[Fe
3+Fe2+(CN)6]3 artificial 1704 in use
Smalt Cobalt(III)silicate SiOCoO 2+ K20 + Al2O3 + artificial 1400 1700
Verdigris Basic copper (II) Cu(OH)5 H 2 · (CH3COO)2 ·
2O
Cu corrosion products (acetates)/Greeks 1800
Red Chemical name Formula Source/Date Used until
Cadmium red
Cadmium sulfide (CdS) + cadmium selenide (CdSe) in varying proportion
CdS + CdSe artificial 1919 in use
Chrome red Basic lead(II)-chromate PbCrO4 · Pb(OH)2 artificial 1809 1900
Realgar Arsenic sulfide As4S4 mineral and artificial / Antiquity (Egyptians) 1800
Red lead (minimum) Lead(II,IV)-oxide Pb3O4
mineral and artificial / Antiquity (Greeks),
artificial (Romans) 1800
Red ochre Anhydrous iron(III)-oxide Fe2O3 natural earth and artificial / prehistoric in use
Vermillion
(cinnabar) Mercuric sulfide HgS
mineral antiquity (Greeks)/ artificial / 1700 (vermilion)
1800
Ochre Iron oxide and hydroxide Fe oxide and hydroxide mineral antiquity in use
White Chemical name Formula Source/Date Used until Titanium white Titanium dioxide TiO2 artificial 1921 in use
Barytes Barium sulfate BaSO4 mineral / artificial (1800) in use
Chalk (whitening) Calcium carbonate CaCO3 mineral antiquity In use
Chapter 1.The paintings
Lithopone Zinc sulfide and barium sulfate ZnSBaSO4 1874
Zinc white Zinc oxide ZnO artificial 1834 in use
Black Chemical name Formula Source/Date Used until Bone/Ivory Black Calcium phosphate + calcium carbonate
+carbon
Ca3(PO4)2+C+
CaCO3/Ca3(PO4)2 +C+
MgSO4/
animal prehistory in use
Green Chemical name Formula Source/Date Used until Cobalt green Cobalt(II)-oxide-zinc(II)-oxide CoO · ZnO artificial 1780 in use
Emerald green Copper(II)-acetoarsenite Cu(CHCu(AsO3COO)2 ·3
2)2 artificial 1814 1900
Green earth
complex aluminosilicate minerals
K[(Al,FeIII),(FeII,Mg)]
(AlSi3,Si4)O10(OH)2
Mineral antiquity
(Greeks) in use
Malachite
(Green Verditer) Basic copper(II) carbonate 2 CuCO3.Cu(OH)2 mineral and artificial / antiquity (Egyptians) 1500
Verdigris Basic Copper acetate Cu(OH)5 H 2 · (CH3COO)2 ·
2O
artificial antiquity
(Greeks) 1800
Viridian
(Chrome oxide) Chromium(III)-oxide dihydrate Cr2O3 · 2 H2O artificial 1838 in use
Yellow Chemical name Formula Source/Date Used until Cadmium yellow Cadmium sulfide CdS artificial 1820 in use
Chrome yellow Lead(II)-chromate PbCrO4 artificial /1816 in use
Cobalt yellow Potassium cobaltinitrite K3[Co(NO2)6] · H2O artificial /1852 in use
Lead tin yellow
Lead stannate (Type I) lead tin oxide silicate (Type II)
Pb2SnO4 (Type I)
Pb(Sn,Si)O3 (Type II) artificial /1200 1700
Ochre Iron oxide and hydroxide Fe oxide and hydroxide mineral/ antiquity in use
Lemon yellow Barium chromate or strontium chromate or mixture of lead chromate + lead sulphate
BaCrO4 artificial 1830 in use
Orpiment Arsenic sulfide As2S3 mineral and artificial / Antiquity (Egyptians) 1800
Naples yellow
(Lead antimonate) Lead(II)-antimonate Pb(SbOPb(SbO34))22 or artificial 1500 in use
Strontium chromite Strontium chromate SrCrO4 artificial 1900 in use
Zinc yellow Complex zinc potassium chromate KH2O · 4 ZnCrO4 · 3
2O. artificial 1850 in use
Brown Chemical name Formula Source/Date Used until Umber Iron(III)-oxide, partly hydrated + FeMnO2O3 (· H2O) +
2·(n H2O)+ Al2O3
nature earth
19 Table 1: Inorganic pigments.
1.1. Scientific investigation of paintings
1.1.1 XRF technique in Art and Archeology
In the study of art objects and other historical materials, the ability to employ non-destructive analytical methods and techniques which can be operated in situ is often mandatory. The artworks can be of different nature (e.g. paintings, metals, glass, wood, stone, ceramic, etc.). They can be decorated with pigment materials, and they may be well preserved or in a serious state of deterioration. In any cases their sampling for analysis is severely limited, or in many cases forbidden [3].
Studies involving scientific methods [4 - 6] are aimed to the identification and knowledge of different aspects concerning an art object. In many cases, the chemical composition is the primary type of information to be investigated. In addition, analytical results can provide novel insights on provenance, historical context, manufacturing technology and geographical spread of investigated cultural objects [7-12].
In this work our attention is focused on painting study, for which chemical analysis is aimed to the comprehension of the nature of pigments to the painting techniques and to the materials identification that distinguish a particular artistic movement.
Next to these cultural–historical motivations, scientific methods may also be applied to evaluate the state of conservation of artworks. In this way, the information obtained may be used to identify the most appropriate conservation policy and restoration [13-16].
Similarly, objects that have been subjected to restoration treatments (recently or in the past) may be investigated to discriminate original materials from new ones or to evaluate the efficacy of past treatments.
Finally, scientific methods are also suitable to gain information concerning the
authentication of artworks [17-18]. In the case of paintings, the occurrence of modern
pigments in a historic painting is often used to address question of authenticity. In such a case, conservators usually verify whether there is discrepancy between the assumed date of the painting and the date of introduction of the anomalous pigments.
Mostly, the scientific techniques applied to an art object need to be [19-20]:
i. Non-destructive. The analysis doesn't have to cause any (visible) damage to the sample. Sampling, if allowed, should be limited to very small amounts;
manganese oxide + aluminium oxide
Van Dyke brown
Iron(III)-oxide, partly hydrated + manganese oxide partly hydrated + humic acids Fe2O3 (· H2O) + MnO2·(n H2O) + humic acids
Chapter 1.The paintings
ii. Fast. The analysis should be fast because the time conferred for investigation of artworks is subjected to restrictions. In addition, a fast analysis allows to investigate a large numbers of objects allowing systematic and comparative studies.
iii. Versatile. The use of a single instrument should allow the analysis of many materials and objects of various shapes and dimensions;
iv. Sensitive. Analytical techniques should present the highest chemical sensitivity in order to allow the investigation of major, minor and trace elements.
v. Multi-elemental. – A single measurement should allow to detect most of the
elements composing a sample simultaneously.
Conventional X-ray Fluorescence (XRF) satisfies many of above mentioned requirements. Nowadays, XRF is a widely employed analytical method in scientific examination of artworks [21-24]. XRF is based on the irradiation of samples with a primary X-ray beam inducing atomic species to emit characteristic ray fluorescence. Identification of these X-ray lines in the spectrum provides information on the chemical elements composing the sample [25-29]. Moreover, a quantification of spectra is possible. Quantitative analysis is based on a calibration with reference materials of similar composition to the one under investigation or, more appropriately, it is based on absorption calculations taking into account the expected matrix composition through an opportune calibration procedure based on the well-established fundamental parameters [30- 36]. In the second Chapter of this work the important aspects of X-ray fluorescence methods, schematized in Figure 2, will be extensively discussed.
Figure 2: schematic of X-ray fluorescence technique.
X-ray spectrometry started to be extensively used in the Cultural Heritage field with the development of portable XRF instruments (PXRF). The portability of the XRF technique has allowed to increase noticeably the number and typologies of objects to be studied [37-
21 46]. Since spectrometers have been moved directly to museums or archaeological sites, immovable or otherwise inaccessible objects, have been easily reached for analysis [47-48, 3].
In the case of paintings, conventional XRF technique is operated locally and, in many cases, information obtained by the analysis can give misleading information.
1.2. XRF imaging techniques
A considerable impulse to further development of the XRF technique is arose from scholars, conservators, art historians of knowing more about the creative process and the artist's modus operandi together to the need to assess and predict the current and future conservation state of artworks.
The first motivation is essentially of art-historical nature and seeks to (better) reconstruct the history of an artwork, whereas second motivation is more strongly linked to potential conservation treatment of an artwork.
In particular, the main motivations to perform XRF analyses on valuable paintings can be synthetize in three interest aspects:
1) to study the original materials used by artist and establish a link between the painting and artist to whom it is attributed or (in the case of autograph works) to obtain novel insights into the evolution of his painting technique and materials. In several analytical cases, this purpose involves the combination and the comparison between data obtained from several paintings by the same artist, or to resort to combined measurements with other methods; 2) to visualize sub-surface layers that can be interested by overpainted hidden drawings, or the so-called pentimenti. The penetration capability of X-rays allows to go in deep besides the first pictorial layer (several tens to hundreds of micrometres), so elements present below the surface contribute to the elemental distribution images, revealing what that is not visible to naked eye. Overpainted drawings help to reconstruct the history of the painting;
3) to document the state of conservation of paintings and learn more about the material changes due to past conservation treatments or to the environmental conditions.
Over the time, in order to meet the above demands the possibility of going beyond the local investigation has been investigated and many efforts have been aimed towards the development of XRF imaging techniques [49].
XRF imaging is aimed to study an art objects in its full dimensions without leaving any parts not examined. It should provide readable results in the form of images that can be easily interpreted by archaeologists, conservators, art scientists and scholars.
In the 1990s, the first spectrometers coupled to a scanning device were developed for mapping the pigments distribution of decorated surfaces of artworks [50].
Chapter 1.The paintings
In scanning XRF as in conventional XRF, the sample is locally irradiated by a focused or collimated ray beam and the emitted fluorescence is recorded by an energy-dispersive X-ray detector. The sample is moved by using motorized stages; measurements are repeated sequentially pixel-by-pixel and the investigation is extended to the whole painted surface [51].
Scanning XRF imaging is a variant of XRF technique and its ability lies in the spatial visualization of the distribution of detected elements, providing additional concerning pigment signature, painting techniques, conservation state. Moreover, as discussed in the present work, the multispectral capability of XRF imaging technique allows to look beyond the painting surface putting in evidence hidden paintings or details not visible by the eyes. A further elaboration of the XRF imaging technique was possible thanks to the increasing availability of X-ray microbeams in Synchrotrons [52-57]. This allowed to develop advanced imaging technique for investigating samples at a microscopic scale obtaining elemental images with a lateral resolution in the micrometre scale of length. Its application allowed to map very small pictorial details of art objects [58-60]. Measurements based on synchrotron X-ray beams present several advantages as the high intensity and the monochromaticity of primary radiation. High brightness allows visualizing heavy elements of a paint with dwell times in the ms range with a better contrast and a higher lateral resolution. Furthermore, the tunable energy offers the possibility of inducing selective excitation of specific elements. The rapid diffusion of polycapillary lens and microfocus tubes, has allowed to develop the technique to portable instruments [38].
Later on, many efforts have been done in order to transfer the established Synchrotron Radiation- (SR)-μ-XRF imaging to the study of larger size objects (up to several square metres), starting the development of the macroscopic XRF imaging (MA-XRF). Macro XRF imaging uses a slightly broadened beam of about few hundred micron to illuminate the large paintig surfaces [61].
In general, the separation link between the established μ-XRF and the novel MA-XRF imaging, consists in resolving power of the mapping. An arbitrary border between both variants is usually taken at the 100 µm level.
Although the outstanding performances of SR based techniques, only small and medium sized artworks have been examined. In addition, the necessity of transporting artworks at synchrotron laboratory has limited further developments.
The new developments of microfocus X-ray tube with high performances and the increasingly diffusion of focusing polycapillary optics pushed the development of novel self-built and commercial mobile scanning XRF systems. Portable XRF scanners allowed the application of the study art objects, avoiding their mobility solving implications related to risks of theft, damage, non-optimal climatic conditions and additional costs [62, 63]. The first example of portable instrument for MA-XRF analysis of historical paintings was commercially available in 2001, it allowed to analyse a small area up to 5 × 5 cm2 [64].
Later, system developed by Hocquet et al. [65] introduced the possibility to scan a larger area but a still too slow scanning velocity (5 days for an area of 30 × 30 cm2 with 1 mm step
23 development has been given from Alfeld et al., making effectively possible the examination of large sample areas [66, 61, 55]. In [62] Alfeld et al. describe the design and optimization of different versions of mobile instruments and their comparison in term of spectroscopic capabilities. These devices were based on powered X-ray tubes, multi-detectors, and polycapillary lens instead collimators (pinholes) [63].
Although tube-based scanning systems are probably still not able to reach the capabilities of a synchrotron radiation-based scanner, its mobility, allowing in-situ investigations, compensates the more long acquisition times. Nevertheless, efforts for increasing the capabilities of portable MA-XRF instruments represent nowadays an open research field, so that their development can limit the SR-scanners to more demanding study-cases in terms of resolution or sensitivity.
In view of information provided by MA-XRF analysis particularly relevant in art-historical field and in art-conservation research, efforts have been undertaken for extending the applicability of the method to other types of two-dimensional art objects. Thus, MA-XRF analyses has seen recent innovative applications with promising results directed to study of painted artworks with support from canvas, as illuminated manuscripts [67], stained-glass panels [68], enamelled artworks [69] and painted woods.
1.3. Other imaging techniques
Over the past decades, a large range of sophisticated imaging techniques, each with its own sphere of application, strengths and weaknesses, have been fine-tuned, and used as complementary methods to chemical analysis of a painting or a cultural good in general [70, 1]. To use scientific analyses as a tool for art research, comprehensive understanding needs of a full range of available analytical methods allied with a solid knowledge of art history. Imaging techniques such as Multispectral imaging (MSI), X-ray radiography (XRR), Neutron activation auto-radiography (NAAR) are largely used as complementary methods to understanding the artist’s use of materials and for providing information on features as alterations or the physical structure of a painting. Each technique has a differentiated penetration-depth, as showed in Figure 3 their combination contributes to reconstruct the layers sequence and to detect underdrawings, changes “pentimenti”, or previous compositions hidden over time.
Further, imaging techniques are often combined with Raman and Fourier transform infrared (FTIR) spectroscopy for molecular and structural information about organic and inorganic pigments making it possible the detection of varnishes, blinders, complex mixtures [71-75]. This section explores the contribution of imaging techniques aimed to the study and to the conservation of the cultural heritage.
Chapter 1.The paintings
Figure 3: imaging techniques energy ranges and corresponding penetration depth into painting structure.
1.3.1 Multispectral Imaging (MSI)
Multispectral [76-78] imaging (MSI) consists of many pictures of the same scene acquired at a different wavelength. Generally, four electro-magnetic spectrum bands are employed: ultraviolet (UV, 360–400 nm), visible (VIS, 400–780 nm), infrared (IR, 780–1100 nm) and Infrared Reflectography (IRR 1000–1700 nm). The images can be acquired in reflection mode (R), fluorescence (F) or false color (FC) and they can also be performed in transmission, where the light which passes through the painting is recorded. Multispectral methods do not fulfil the analytical capabilities offered from the spectroscopic methods; however, their use has the advantage of being a rapid and relatively low-cost solution for the examination of large areas [79]. In order to identify pigments with an acceptable degree of certainty, at least one other material specific technique must be used to complement multispectral imaging diagnostics. The principle is based on the fluorescence of some pigments or other materials such as varnishes that are sensitive to emit light after having been illuminated with UV, visible or infrared radiation, in particular:
25 1) Visible light (VIS) imaging with the usual colour photograph serving as the reference for the other images. Visible Transmitted (VISTR) technique allows a better separation of paint layers and can make later alterations more visible.
2) Ultraviolet Fluorescence (UVF) is indicated as a surface technique, based on the illumination of the painting by ultraviolet radiation and the recording of the resulting emitted fluorescence [80]. Organic compounds can easily be detected as the presence of natural resin varnishes. In addition, UV based technique is sensitive to the identification of retouching applied on top of an aged varnish, that appear darker than the original materials. Ultraviolet Reflected (UVR) technique is useful for spotting different pigments that look alike in the visible range and for visualizing faded inks and prints. A more powerful variation of the UVR method is UV false colour (UVFC) combining UVR images to the visible image. In Figure 4, the simple UVF measurement setup is showed, it consists of a UV lamp and of a digital camera equipped with a cut UV filter. The experimental set up for the UVR is identical to the UVF except that you substitute a VIS cut filter for a UV cut filter. The result will be a monochromatic image of the UV reflected from the painting.
Figure 4: setup for Ultraviolet reflection (UVR) and fluorescence (UVF) analysis. 3) Infrared reflectography (IRR) technique is based on the illumination of the painting
with infrareds or only visible light (Infrared Fluorescence- IRF) and by recording the reflected infrared radiation, as sketched in Figure 5. IR radiation penetrates the surface layers of the painting and the underdrawing becomes visible, due to the transparency of some pigments, as such as lead white and titanium white [81]. IRR analysis has provided important information for authentication in paintings based on black carbon sketches drawn on a white gesso ground (calcium sulfate). Due to the IR radiation absorption by black carbon and reflection back from the ground, black carbon underdrawing become visible. In Section 1.3.1 a detailed description of the capabilities of IRR method follows. In some other cases, a better visual representation of underdrawings and alterations is given by performing Infrared
Chapter 1.The paintings
technique in transmission mode (IRTR) (see Figure 5). Further, IR based technique can be combined to a visible picture and infrared picture in the Infrared False Colour imaging (IRFC), it allows to distinguish different pigments that appear the same to the naked eye and retouches. The technique is very suitable for some pigments such as cadmium yellow that emits fluorescence in the infrared region.
Figure 5: (left) Setup for Infrared (IRR) reflected (IRR) and fluorescence (IRF) analysis; (right) Infrared transmitted setup (IRT).
4) Recently, Terahertz (THz) electro-magnetic spectral band has been explored for art objects studies. It is complementary to the other techniques and it lies between the infrared and microwave regions, about 0.1–10 THz; however, the 0.5–13 THz frequency range is preferred for paintings investigation [82-84]. THz technology is relatively less diffused than other parts of the electro-magnetic spectrum, because the devices are relatively bulky and have not yet been optimized for use on-site in museums and in field sites [85-87]. THz radiation can penetrate non-metallic optically opaque materials and it reaches all painting layers up to the support, revealing structural problems or paint’s flacking. Further, radiation induces molecular bending and stretching by exciting collective motions, so the technique results sensitive to humidity content, important for the conservation of paintings.
1.3.2 Infra Red Reflectography (IRR)
Infra-Red Reflectography (IRR) is, like X-ray radiography, a traditional well-established technique for the in-situ investigation of historical paintings [88]. Similarly, the technique allows the revelation of pictorial layers hidden by superimposed ones, due to the artist’s changes or to subsequent restorations, as well as the visualization of the under-drawing, executed by the artist on the preparation before laying the colors [89-91].
27 IRR was first employed by J.R.J. van Asperen de Boer in the 1960’s [92, 81] and nowadays, is performed routinely in many museums worldwide.
In particular, for the investigation of sub-surface layers of historical paintings, Near Infra Red (NIR) using the electromagnetic spectrum from 0.7 to 1.1 µm and Short-Wave Infrared (SWIR) referred to the band of 1.1–2.5 µm are highly suitable for visualizing carbon-based underdrawings (charcoal, graphite, soot ink and black chalk), especially used in 15th-16th century dated back paintings [93]. Sometimes, there is no common agreement on distinguishing NIR and SWIR. In different publications one can find various wavelengths for these ranges, or even no distinction for the SWIR band. IRR technique is based on the light exposure of a paint surface that partly reflects it from the top surface and partly penetrates it. Light propagating inside the paint layer is scattered by the pigment particles and the binder, which eventually returns part of the intensity back to the observer.
The under-drawing visibility essentially depends on the contrast between the radiation reflected by the preparation and that one absorbed by the drawing itself. For dark pigments (e.g., ivory black or carbon black) the factor of absorption is predominant, while for the bright white pigments as white gesso (calcium sulfate) the scattering is the only factor. In particular, sketches made by black carbon appear dark and can easily be observed because of the high absorption from carbon based pigments [94].
Also, the contrast depends on the layer (or multilayer) transparency – i.e. the grain size and concentration of the pigment, the medium used, the layer thickness – and on the existence of an enough reflecting ground. For example, the contrast is maximized when the former is traced out with carbonaceous pencils or inks on a gypsum ground. On the contrary, the drawing may not be visible when it is realized with iron-gallic inks, which are nearly transparent to IR radiation. Thus, the main IRR limitation is due to impossibility to visualize underdrawings, which were not realized with a carbon-based material, white (calcium carbonate) and red chalk (haematite) and metal points.
IRR measurement is performed in reflection geometry and full-field mode, and the technique has the advantage that the radiation employed is conveniently available by using conventional incandescent lamps and electronic flash tubes and does not constitute no health hazards. At first, IR radiation reflected by the painting impressed photographic films, but their limited sensitivity in the 0.7-0.9 μm spectral range produced poor quality images. Indeed, radiation in this range passes through some pigments, in particular reds and whites, while greens and blues resulted nearly opaque.
The later development of Vidicon tubes sensitive up to 1.9 µm [95, 92] allowed to visualize underlying features of the paintings in a more effective way compared to IR films. Vidicon tubes limitation is that they have scarce light sensitivity, so that measurements request an intense illumination, which can induce a detrimental warming of the painting surface. Moreover images are characterized by a very low contrast due to the limited number (some tens) of grey levels, and are affected by
Chapter 1.The paintings
geometrical distortion, due to the camera lens and to the device intrinsic characteristics. In order to have a high spatial resolution the measured area must be very small (10×10 cm2 to have a resolution of 4×4 pixel/mm2).
The reproduction of a large panel thus requires the collection of several images (more than 100 for an area of 1 m2) that are successively combined in a mosaic. Since the
single images are brighter in the centre and darker on the borders as consequence of the non-uniform sensitivity of the detector’s area, the resulting reflectogram generally appears tiled, in many cases even after equalization. Over the time, Vidicons were replaced by solid state array cameras, as CCD or CMOS cameras, with sensitivity from 0.7 to 1.1 µm [96]. Although Low-cost CCD detectors have a higher intensity resolution, less geometrical distortion and the image has a much better uniformity than in Vidicon case, they do not improve the quality of the acquired images in a significant way, indeed, their sensitivity is limited up to 1.1 μm so that the acquired images have the same low informative content. However, expensive CCD devices may strongly improve the underlying features.
Among the first materials employed for solid state arrays there was PtSi (sensitive to 1.0-5.0 µm) [97, 98] that required liquid nitrogen cooling and the spectral range acquired was adjusted by IR filters, selecting the best spectral band suited for the underdrawings visualization. Today the most common material is InGaAs [99, 100]. These detectors are sensitive to radiation between 0.9 and 1.7 µm, no require liquid nitrogen cooling and are featured a higher quantum efficiency compared to vidicon tubes and PtSi solid state arrays. In order to record higher wavelengths also solid state detectors made of HgCdTe and InSb are available, these devices are considerably more expensive and require cooling in order to obtain acceptable signal-to-noise ratios.
However, solid state detectors commonly available have a size of considerably less than 1 Mpixel, so that the assembling of sub-areas cannot be avoided. In complementary way to the full field IRR mode, in 1990 Bertani describes an IRR scanning system achieving a spatial resolution of 200 μm in the spectral region between 1.1 and 1.5 µm [101]. In addition, recently, a multiband approach based on acquisitions in narrow-bands [102], introduces some advantages over the conventional IRR performed in wideband modality (i.e., in the large near-infrared band).
Multiband IRR opens the way to new applications for the study of artists’ materials, allowing acquisition of information about some pigments and their mapping across the painting. Daffara et al. [103, 104] describe an advanced IRR scanning device which records 14 bands in the NIR and SWIR from 0.7 to 2.3 µm and allows for multispectral imaging, achieving a spatial resolution of 500 µm. Scanning systems require measurement times in the range of hours to scan 1 square meter at maximum resolution. Finally, measurements in transmission geometry of canvas paintings [105-107], exploiting their slight transparency to IR radiation, have been described several decades ago but until recent periods its application was hindered by the low sensitivity of IR detectors, which necessitated long exposure times. However,
29 transmission IR images are less surface sensitive than reflectograms, so that the underdrawings weakly visible in the IRR, can be observed in the transmission image.
1.3.3 X-Rays Radiography (XRR)
Among the imaging techniques that may reveal the inner structure of a painted artifacts in non-destructive way XRR (X-Rays Radiography) is a well-established technique, performed from the end of the 19th century soon after discovery of the X-rays [108].
Conventional X-ray radiography is mainly done in transmission mode with no energy discrimination. Typically, an X-ray tube is placed on one side of the painting and the transmitted X-rays are detected using an X-ray film, phosphor imaging film or pixel detector, as is showed in Figure 6.
Figure 6: X-ray radiography setup.
The development of X-radiography gave conservators and art historians access to information related to the entire three-dimensional structure of an art object. Paintings are multi-layered objects structured with a support (wooden panel, canvas on a frame, copper plate, etc.), a ground (layer of gypsum, chalk or lead white), and the pictorial layer [109]. Radiography is used to visualize the distribution of these layers through the primary beam absorption that follows the Beer-Lambert law [110, 66, 52, 61]. However, the most interesting information comes from the paint layers, allowing different artists’ hands to be distinguished in different stages of a painting, the discovery of previous compositions beneath the surface of the painting and, in a few cases, the detection of fakes. Each layer is characterized by its attenuation coefficient, that depends by density and thickness, and the absorbance image is directly proportional to the attenuation coefficients. The use of analogue films for the detection allow the main advantage of a higher lateral resolution in the range of 2 μm related to the grain size in X-ray films, but these have been gradually replaced by pixelated detectors. Although, the lateral resolution obtained with commercial digital
Chapter 1.The paintings
detectors is several tens of μm due to the pixel size, their higher sensitivity requires shorter exposures and it results in a lower dose of radiation absorbed by the investigated object. In addition, digital radiography requires no time consuming processing of films and directly provides digital data for advanced image processing. Conventionally XRR technique is operated in full-field mode, but also XRR scan is possible using small beam instead a broad X-ray beam.
Although, the technique is suitable to investigate large numbers of painted surface, because a single radiography can be taken in a time of minutes it has a number of important limitations. In contrast to MA-XRF technique, XRR is not able to discriminate the chemical nature of the elements, because the X-ray absorbance observed is an integration over all the absorbance of the specific elements. Contributions to the radiographic contrast map from (small quantities of) weakly absorbing elements (with low atomic number or without metals in their formulae) may frequently be obscured by those of heavier elements that are present in higher concentrations. Thus, the absorption contrast in XRR images is mostly caused by the heavy metal paint components limiting the readability of hidden compositions. In general, the pigments that are most likely to block X-rays are those made of lead as lead white (lead Z=82), chrome yellow (lead chromate), Naples yellow (lead antimonate) and minium (lead oxide). The pigments with weaker absorption power are zinc white (zinc Z=30), cadmium yellow (cadmium Z=48) and emerald green (arsenic Z=33). Also, very weak absorbers include lime white (calcium Z=20), umber (manganese Z=Mn, iron Z=26), cobalt blue (cobalt Z=27), red/yellow ochre (iron Z=26), Prussian blue (iron Z=26) and the worst absorbers are the organic pigments based on carbon (Z=6): carbon black and carmine lake.
For the same reason the contributions of support and ground layers can make the radiographs difficult to read, so that different approaches to reduce their influence have been developed. In several cases, acquisition of X-radiographs of the same area using different operating conditions for the X-ray source and varying the exposure time can be a useful method for providing different features of the structure to be highlighted in the resultant images. Many of the techniques developed to make X-radiographs more readable have made use of moving X-ray sources or paintings [111].
This approach consists in developing a simple form of tomography, named
strato-radiography or strati-strato-radiography [112, 113].Methods have also been developed to
minimise the tonal differences between the different regions in an X-ray plate during the printing process. Radiographs produced by this method are often named logetronic
radiographs. The technique relies on exposing different parts of the X-ray plate to different
amounts of light during printing, either by using masks, or by using a cathode ray tube, whose output at a given point in its raster scan can be varied. Another method of minimising the tonal differences created by structures such as cradles is to expose the X-ray plate with the interstices between cradle members filled with a material that has a similar X-ray absorbency to the surrounding wood [114].
Moreover, the influence of the support can be nearly removed by performing electron emission based on the positioning the film directly on the paint layers [115, 114]. Both are exposed to the X-rays, which pass through the film before reaching the painting. The X-ray tube is operated at a high voltage (several hundred kV) with a suitable filter absorbing the
31 lower energetic part of the tube spectrum. The photoelectrons emitted by the surface layers of the painting darken the film, while the high energy X-rays pass through it without interaction. Given the strong absorbance of electrons in paint layers the images obtained are dominated by surface paint layers with covered layers making only minor contribution. On the other hand XRR allows for a study of the support of paintings [116, 117], in contrast to the MA-XRF that does not result in information deeper than a few tens of micrometres from the sample surface due to the self-absorption effect. In this way, paintings made on canvas from the same loom can so be identified [118, 119].
In the conventional XRR, the detector has basically no energy discrimination only some influence can be exercised on the absorption process by varying the voltage of the X-ray tube. However an alternative is to perform Energy resolved radiography (ED-XRR) that generates pixelated images because energy dispersive detectors are employed to collect the images. Thus, ED-XRR may be developed by using a monochromatic X-ray beam (SR radiation) in combination with a detector without energy discrimination [120, 121].
The dichromography or K-edge imaging is a radiographic method that employs monochromatic X-rays of different energies that allows to obtain elemental distribution image by subtracting images acquired with energies above and below the absorption edge of an element. Also, ED-XRR may be performed by employing polychromatic beam in combination with an energy dispersive X-ray detector [122]. In several research groups Zemlicka et al. [123], Scharf and al. [124, 125], F.P.Romano et al. [126] , Color X-ray Cameras, conventional CCD detectors and Timepix detectors supported by proper processing procedure of the experimental data are employed for creating images in given energy intervals which enable identification and separation of elements.
1.3.4 Neutron Activation Auto-Radiography (NAAR)
The purposes of the neutron activation method are almost the same as those of X-rays analyses. Namely, the main end is to reveal details of composition hidden by the top layers of the painting under investigation. In the same way of X-rays, neutrons penetrate through material and become absorbed differently by different elements [127-129].
Neutron Activation Auto-Radiography (NAAR) technique was developed by Sayre and Lechtman [130, 131] and it is based on the transient radioactivity induced in the sample by exposing it to the low-energy thermal or cold neutrons for a period adequate to generate the desired level of internal radioactivity.
The flux of incident neutrons, when absorbed by certain atomic nuclei in the irradiated material, transforms the nuclei into radioactive isotopes, In this way, the sample is activated and placed in contact with a photographic medium, photographic film or image plates, which becomes darkened by the radioactive decay, as sketched in Figure 7. This resulting radiation may include alpha particles, beta particles and gamma radiation [132].
The presence of different activated radioisotope with different half-lives allows to acquire the different elemental distributions by changing the photographic medium in appropriate time windows. Similar to the X-ray fluorescence spectroscopy, the study of gamma radiation energies allows for distinguishing the elemental composition of the pigments because of direct correlation between the energies of the gamma-ray photons and the atomic number.
Chapter 1.The paintings
The image produced on a photographic film by β-particles emitted by the activated painting provides an image of pigment distribution. The darkening of the photographic medium indicates the greater abundance of an element.
Figure 7: NAAR experimental setup.
The contrast obtained is dependent on the exposure time of the photographic medium, which cannot be extended indefinitely to avoid overlap with slower decaying isotopes and overexposure in areas of high concentration. The lateral resolution of NAAR images is dependent on the grain size and thickness of the film employed and the distance between film and paint surface. Finally, the energy of the emitted β-radiation influences the lateral resolution, as it determines the absorption in the photographic medium.
Unlike X-rays, neutrons are better absorbed by light elements, which allows for the detection of phosphorus- (present in bone/ivory black-carbon), carbon- (carbon-based black pigments containing a mixture of Ca3(PO4)2, CaCO3 and C), also hydrogen- and nitrogen-containing substances surrounded by heavy elements.
NAAR represents a very suitable tool for the visualization of elements such as manganese (present mainly in oxidized form in the earth pigment umber), copper (present in copper-based greens and blues) and mercury (present in vermilion) due to their susceptibility to activation. Differently, lead (present mainly in lead white) and iron (present in a broad range of pigments, among them earth pigments and Prussian blue) are not transformed into radioactive equivalents and cannot be imaged by this method. Neutron activation is also applied for detection of trace elements in artistic materials, which helps in determining pigment origin [133].Among the main drawbacks of NAAR analysis, there is that of requiring the transport of the painting to the place where the research reactor is installed. Furthermore, after activation the painting needs to stay for several weeks at the reactor facility to acquire the autoradiographs and, from a safety point of view let, needs that the
![Figure 10: florescence yields, Auger electrons and Coster-Kronig after the K-, L1-, L2- or L3-photoelectric effect [158]](https://thumb-eu.123doks.com/thumbv2/123dokorg/4518203.34817/42.892.146.777.377.920/figure-florescence-yields-auger-electrons-coster-kronig-photoelectric.webp)
![Figure 25: simulated spectra for a Rh-anode X-ray tube at different voltages using Axil analysis software [202]](https://thumb-eu.123doks.com/thumbv2/123dokorg/4518203.34817/60.892.205.710.115.486/figure-simulated-spectra-anode-different-voltages-analysis-software.webp)