Ciclo XXI
Settore scientifico disciplinare di afferenza: FIS/05
X-Ray studies of the physics of matter around super–massive
black–holes in nearby Seyfert galaxies
Tesi di: Relatore:
Mauro Dadina Chiar.mo Prof. Giorgio Palumbo
Coordinatore Dottorato: Chiar.mo Prof. Lauro Moscardini
Esame finale 2009
Scuola di dottorato in Scienze Matematiche, Fisiche, Chimiche ed Astronomiche Dottorato di ricerca in Astronomia – XXI ciclo
PhD Thesis in Astronomia
a quelle che sono sempre state qui, a quelle che sono arrivate e a quelle che ora non ci sono.
at INAF/IASF–Bo as part of
the institute’s research activities
1 The scientific framework 1
1.1 The AGN . . . . 2
1.2 The unified models . . . . 4
1.3 The Seyfert galaxies in X-rays . . . . 7
1.3.1 The X-rays emission mechanism . . . . 9
1.3.2 The neutral absorption in type II Seyfert galaxies . . . . . 10
1.3.3 The reflection component . . . . 11
1.4 Open questions . . . . 14
1.4.1 Testing the UM . . . . 14
1.4.2 The emission mechanism . . . . 15
1.4.3 Testing the matter flow around SMBH . . . . 16
2 The data 19 2.1 The BeppoSAX sample . . . . 20
2.1.1 Data reduction and analysis . . . . 22
2.2 The X–C f A sample . . . . 23
2.2.1 The X-ray data . . . . 25
2.3 The XMM-Nweton sample . . . . 26
2.3.1 Spatial and Timing Analysis . . . . 27
2.3.2 Spectral Analysis . . . . 28
3 Testing the UM using the X-ray continuum 31 3.1 The methods of analysis of the BeppoS AX data . . . . 31
3.2 The X-ray continuum parameters to test the UM . . . . 34
3.3 The average absorption properties . . . . 38
CONTENTS CONTENTS
3.4 Identification of higly absorbed sources in the X M M–Newton sample 40
3.5 The origin of the narrow component of the FeKα line . . . . 45
3.6 Summary of the results obtained testing the UM . . . . 53
4 The X-ray emission mechanism 55 4.1 The emission mechanism . . . . 55
4.2 The multiwavelenght characteristics of the X–C f A sample . . . . 58
4.3 Picking-up Compton-thick and Starburst dominated objects . . . . 59
4.4 The X-rays and the Optical emission line characteristics . . . . . 62
4.4.1 X-ray vs. Hαluminosity . . . . 63
4.4.2 X-ray vs. [OIII]λ5007luminosity . . . . 67
4.5 MBHand Eddington ratios for the X–C f A sample . . . . 71
4.6 Summary of the results obtained on the emission mechanism . . . 75
5 Key study objects: i) Mrk 509 79 5.1 The case of Mrk 509 . . . . 80
5.2 Observations and data reduction . . . . 81
5.3 Fe K band emission of Mrk 509: the XMM-Newton data . . . . . 82
5.3.1 The 6.4 keV emission line . . . . 85
5.3.2 The ionized Fe K emission line . . . . 85
5.3.3 Ionized absorption? . . . . 87
5.3.4 Time resolved spectral variability and total rms spectrum . 87 5.4 The view of the Fe K band emission . . . . 91
5.4.1 The S uzaku pin data to constrain the reflection fraction . 94 5.5 A physically self-consistent fit: possible origin of the spectral fea-tures . . . . 95
5.6 Discussion . . . . 96
5.6.1 Neutral/lowly ionized Fe emission line . . . . 97
5.6.2 Ionized Fe emission lines . . . . 97
5.6.3 Ionized Fe absorption lines . . . . 98
5.7 Conclusions . . . . 99
6 Key study objects: ii) NGC 3783 101 6.1 XMM-Newton observations . . . 101
6.2.1 Spectral features of interest and selection of the energy
res-olution . . . 102
6.2.2 Selection of the time resolution . . . 103
6.3 Excess emission maps . . . 104
6.3.1 Continuum subtraction . . . 106
6.3.2 Image smoothing . . . 106
6.4 Results . . . 107
6.4.1 Light curves of the individual spectral features . . . 107
6.4.2 Correlation with the continuum light curve . . . 109
6.4.3 High/Low flux state line profiles . . . 109
6.5 The deduced scenario for NGC 3783 . . . 110
7 Key study objects: iii) IRAS 13197-1627 115 7.1 The XMM–Newton observation and first–look analysis . . . 116
7.2 The 2–12 keV spectrum of IRAS 13197–1627 . . . 118
7.2.1 X–ray reflection from the accretion disc and Fe reso-nant absorption . . . 123
7.2.2 A partial covering alternative . . . 127
7.3 The previous ASCA and BeppoSAX observations . . . 127
7.3.1 Confirming the reflection–dominated spectrum with Bep-poSAX . . . 129
7.3.2 Long–term spectral variability . . . 129
7.4 Origin of the reflection–dominated spectrum . . . 132
8 Overview on the obtained results 135 8.1 The UM . . . 136
8.2 The emission mechanism . . . 137
8.3 Matter flows close to SMBHs . . . 138
A The BeppoSAX data 141 A.1 Atlas of the 2-100 keV spectra . . . 163
iv CONTENTS
C The X M M–Newton sample data 199
C.1 Atlas of X-ray spectra . . . 204
1.1 Schematic view of the UM. The scheme accounts for the differ-ent kinds of RL and RQ AGN. The physical compondiffer-ents that are thought to be present in the circumnuclear region around the SMBH are represented (M. Polletta adapted from Urry & Padovani 1995) 5
1.2 Schematic representation of the continuum emission measured in Seyfert galaxies (Courtesy of J. Manners) . . . . 7
1.3 Schematic representation of the X-ray spectrum observed in type I Seyfert galaxies (Courtesy of M. Cappi) . . . . 8
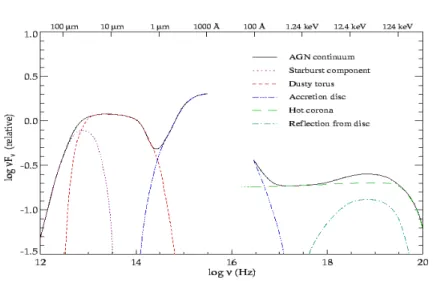
1.4 Le f t panel : the X-ray reflection component emerging from a neu-tral slab (solid line). The dashed line shows the incident contin-uum. Most of the radiation below 20 keV is absorbed by metals in the reflecting slab and re-radiated at lower energies (i.e. ther-malized). Right panel : the reflection spectra predicted assuming different ionization states for the reprocessing slab. The ionization states are described by the ionization parameter ξ (see text). When the reflector is ionized, strong emission lines are produced at E≤2 keV. (Figures from Fabian et al. 2000) . . . . 11
vi LIST OF FIGURES
1.5 The shape of reflection lines from the accretion disk is sculpted by the interplay of Doppler and transverse Doppler shifts, relativistic beaming and gravitational redshift. These effects are taken into account step-by-step moving from the upper to the lower panel of this figure. In the first three panel, only the contribution coming from two narrow annuli of the accretion disk are considered. In the lower panel it is plotted the summed profile considering the emission from the entire accretion disk (Figures from Fabian et al. 2000) . . . . 13
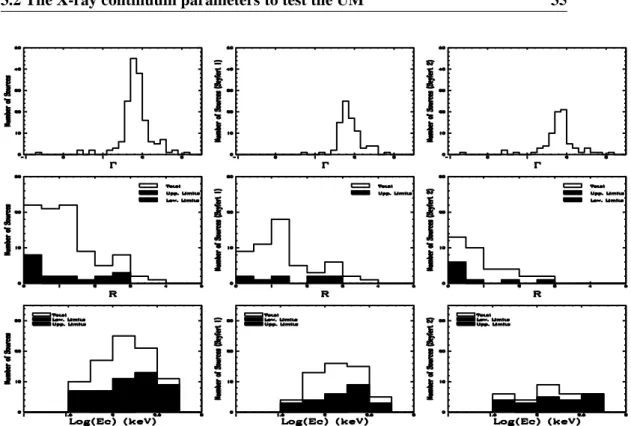
3.1 Photon index Γ (first row), R (second row) and Ec (third row) in units of cm−2distributions for the whole dataset (left column), for type I objects (center column), and for type II objects (right column). 35 3.2 Distribution of the observed photon index for the X M M–Newton
sample. The upper panel refers to the entire sample, the middle panel to the type I objects and the lower panel to the type II Seyferts. 37 3.3 NH(in units of cm−2) distributions for the whole dataset (left
col-umn), for type I objects (center colcol-umn), and for type II objects (right column). . . . . 38
3.4 Distribution of the observed absorbing columns for the X M M– Newton sample. The upper panel refers to the entire sample, the middle panel to the type I objects and the lower panel to the type II Seyferts. . . . 39
3.5 Diagram of the absorbing column density NH versus the ratio be-tween the observed 2–10 keV flux and the reddening-corrected [O III] flux taken from Panessa (2004). Filled polygons are type 1 Seyferts and open polygons are type 2 Seyferts. The shaded region (lower-left to upper-right diagonals) indicates the expected correlation under the assumption that L2−10keV is absorbed by the NHreported on the ordinate, starting from the average FHX/F[O III] ratio
ob-served in type 1 Seyfert galaxies and by assuming a 1% reflected component. Also, the shaded region (upper-left to lower-right di-agonals) obtained by Maiolino et al. (1998) is shown. . . . 42
3.6 Distribution of the photon index before (left panel, see Figure 3.2) and after (right) correction for Compton-thick candidates for which a value of Γ=1.62 is assumed (see text for details). . . . 44
3.7 Distribution of the absorption column densities before (left, see Figure 3.4) and after (right) correction for Compton-thick candi-dates. Upper and lower limits are indicated with arrows. . . . 45
3.8 Distribution of the Fekα emission line energy centroid (first row) and of its EW (second row). Distributions for the whole sample of observations (left panel), for the type I objects (center panel) and for type II objects (right panel). . . . 46
3.9 Upper panel: Log(EWFeKα) vs. Log(NH). As expected, the sources are divided in two families: the ones that follow the expectations if the FeKα line is produced in the absorption matter and the can-didate Compton-thick ones that display low absorption and large EW. The solid line indicates the prediction by Makishima (1986). Left panel: Log(F2−10keV/F20−100keV) vs. Log(NH). The two quanti-ties are correlated as expected since the 2-10 keV band is strongly affected by the absorption while the 20-100 band is almost free from absorption. The solid line is the best fit obtained with linear
regression methods Right Panel: Log(EWFeKα) vs. Log(F2−10keV/F20−100keV).
The two quantities are strongly correlated ( Pnull≤0.01). The ra-tio between X-ray fluxes is a model independent indicator of the absorption affecting the low energy band. Thus, this correlation strongly indicates that the narrow component of FeKα line in emis-sion is indeed produced by the same matter responsible for the absorption. The solid line is the linear regression obtained using Bukley-James method (Isobe et al. 1986). . . . 49
viii LIST OF FIGURES
3.10 Panel (a): Log(EWFeKα) vs. L2−10,observed. Panel (b): Log(EWFeKα)
vs. F2−10,observed. Panel (c): Log(EWFeKα) vs. L20−100,observed.
Panel (d): The same as panel (c) but only for Seyfert 1 objects. Panel (e): Log(EWFeKα) vs. F20−100,observed. Solid lines in panel
(a), (b), and (c) are the linear regressions obtained for the whole sample of observations. The dashed line in panels (c) and (e) is the linear regression obtained considering only type I objects. As vis-ible in panel (b) the less scattered relation is obtained considering the 2-10 keV observed flux. The relation is linear, as expected if the correlation is due to selection effects, i.e.considering that in faint objects only large EW were detectable by the MECS instruments on-board BeppoS AX. . . . 51
4.1 Distribution of the 2–10 keV luminosities before (left) and after (right) correction for Compton-thick candidates (after Table 3.3). Upper limits have been indicated with arrows. . . . 56
4.2 Left panel: Photon index Γ plotted versus the measured NH (in units of cm2). No significant trend relating these two quantities is found; center panel: R vs. Ec (in units keV), no correlation is found between these quantities; right panel R vs. Γ. The two quantities are correlated with a high significance level (Pnull≤1%). The line is the linear regression best fit. . . . 57
4.3 FX/F[OIII] vs. F[OIII]/FIRdiagram. Compton thin, Compton thick and starburst regions have been separated by dashed lines. Type 1 objects are plotted as filled polygons, type 2 as empty polygons, ’mixed Seyfert’ objects as crosses and Compton thick candidates as stars. . . . 60
4.4 Left panel: Log of 2-10 keV luminosity versus log of Hαluminosity
(narrow+broad components) corrected for the Galactic and NLR extinction. The dotted line shows the best fit linear regression ob-tained by fitting type I Seyferts and low-z quasars from Ward et al. (1988). Right panel: the same plot using the ’Compton thick’ corrected luminosity. The solid line shows best fit linear regres-sion line obtained by fitting the total sample of Seyfert galaxies and the low-z quasars. Filled polygons are type I Seyfert, open polygon sare type II Seyfert, ’mixed Seyfert’ objects are indicated as crosses, Compton thick candidates are stars and low-z quasars are ’rounded-stars’. . . . 64
4.5 Correlation between 2-10 keV versus Hαfluxes. Hαnarrow+broad
components are corrected for the Galactic and NLR extinction. Symbols as in Fig. 4.4 . . . . 66
4.6 Left panel: Log of 2-10 keV luminosity versus log of [OIII]λ5007
lu-minosity corrected for the Galactic and NLR extinction. The solid line shows the best fit linear regression line obtained by fitting type 1 Seyfert, a sample of bright type 1 Seyferts (QSO, Mulchaey et al. 1994) and a sample of PG quasar (PG, Alonso-Herrero et al. 1997). Right panel: the same plot using ’Compton thick’ corrected luminosity. The solid line shows our best fit linear regression line for the total sample of Seyfert galaxies, the PG quasars and bright type 1 Seyfert. Symbols are as in Fig. 4.4 . . . . 69
4.7 Correlation between log of 2-10 keV versus log of [OIII]λ5007fluxes,
the latter corrected for the Galactic and NLR extinction. . . . . . 70
4.8 Left panel: Distribution of the log of black hole masses in unit of solar masses . Right panel: Distribution of the log of LBol/LEdd ratio, assuming that LBol/LX∼ 30. In both panels the shaded areas represent the distribution of type 1 Seyferts only. . . . 73
4.9 Log of 2-10 keV luminosity versus log of black hole mass (symbols as in fig 4.6). Compton thick candidates are plotted as stars. The solid lines show the L2−10keV as a function of the black hole mass for Eddington ratios of 1.0 and 0.01. . . . 74
x LIST OF FIGURES
5.1 3.5–10 keV EPIC–pn light curves of the XMM-Newton observa-tions. The abscissa shows the observation time in seconds. The time between the different observations is arbitrary. The black, red, green, blue and light blue show the light curves during the 2000– 10–25, 2001–04–20, 2005–10–16, 2005–10–20 and 2006–04–25 observations, respectively. . . . . 82
5.2 (Upper panel) Observed–frame 3.5–10 keV summed XMM-Newton EPIC– pn spectrum fitted in the 3.5–5 and 8–10 keV band with a power law. (Panel a) Data/model ratio. This ratio shows a clear evi-dence for a neutral Fe K emission line and further emission from ionized Fe, as well as other complexities around 7 keV. (Panel b) Data/model ratio when two resolved emission lines (for the Fe Kα and Kβ) are included in the spectral fitting. Strong residuals are still present, indicative of ionized Fe K emission, while no resid-ual emission redward of the neutral Fe K line appears. (Panel c) Data/model ratio when a narrow emission line is included in the model to reproduce the ionized emission. (Panel d) Same as panel c, but with a single broad emission line instead of a narrow line. In both cases (panel c and d), an absorption feature is present around 7 keV. (Panel e) Data/model ratio when an absorption component (modeled using xstar) and a relativistic ionized line are added to the power law and the emission from neutral Fe K. . . . . 84
5.3 (Left panel) Contour plot of the sigma vs. intensity of the neutral Fe K line. (Right panel) Contour plot of the energy vs. intensity of the narrow line used to fit the ionized Fe K emission. The narrow line energy is not consistent with emission from Fe XXV (neither with the forbidden at 6.64 keV, nor with the resonant at 6.7 keV), Fe XXVI or Fe Kβ, whose energy is indicated by the vertical dotted lines (from left to right). . . . 85
5.4 Superposition of the pn (green), MOS1 (black) and MOS2 (red) summed spectra of all the XMM-Newton observations. The data are fitted, in the 3.5–5 and 8–10 keV bands with a power law, ab-sorbed by Galactic material. The same structures are present in the three spectra. In particular, a narrow drop of emission is present in all the instruments at the same energy (see vertical dotted line). (Inset panel) Confidence contour plot of the intensity vs. energy of the narrow unresolved ionized absorption when using the pn data alone (dashed contours) and including the MOS data as well (solid contours). The lines indicate the 68.3 (black), 90 (red), 99 (green) and 99.9 (blue) per cent confidence levels. . . . 88
5.5 Lower panel: Total rms variability spectrum of the XMM-Newton ob-servations. The data (blue crosses) show the spectrum of the vari-able component. The best–fit model is a power law with spectral index Γ=2.18 (red line) plus a Gaussian emission line (improving the fit by ∆χ2of 8.9 for the addition of 2 parameters). The dashed line highlights the centroid energy of the neutral Fe Kα line, while the dotted line is placed at the maximum of the variability excess, modeled with the Gaussian emission line. The excess variability energy corresponds to a drop of emission of the real spectrum. . . 90
5.6 XMM-Newton (black) and XIS0+XIS3 (red) summed mean spec-tra. The data are fitted, in the 3.5–5 and 7.5–10 keV bands, with a simple power law, absorbed by Galactic material, and the ratio of the data to the best fit model is shown. The arrows mark absorption features in the spectrum. . . . 92
6.1 The X-ray light curves of NGC 3783 in the 0.3–10 keV band. Left
panel: light curve of the 2000 observation. Right panel: light
curves of the 2001a and 2001b observations. . . . 102 6.2 The 4–9 keV residuals against a simple power-law plus cold
ab-sorption continuum model for the spectrum of NGC 3783 during the 2001b observation. The data are obtained from EPIC pn. . . . 104
xii LIST OF FIGURES
6.3 The excess emission maps of the 4–9 keV band in the time-energy plane at 2.5 ks time resolution. The images have been smoothed. Since the 6.4 keV line core is very strong and stable, the color map is adjusted to saturate the line core and allow lower surface brightness features to be visible. Left panel: excess emission map from the 2000 observation. Right panel: excess emission map from the 2001a and 2001b observations. . . . 105 6.4 The light curves of the total 0.3–10 keV continuum flux and of the
four spectral features (Tab. 2) extracted from the excess maps of the 2001a and 2001b observations (Fig. 6.3, Right panel), with errors computed from simulations. The time resolution is 2.5 ks. . . . . 108 6.5 Upper panel: The 0.3–10 keV light curve of NGC 3783 during
2001b observation at 2.5 ks time resolution. Middle panel: The 0.3–10 keV light curve of NGC 3783 during the 2001b observa-tion after subtracobserva-tion of a 4th degree polynomial (long-term vari-ations) at 2.5 ks time resolution. Lower panel: The 5.3–6.1 keV (‘red+wing energy band) light curve extracted from the excess emis-sion map of the 2001b observation (Fig. 6.3, Right panel) at 2.5 ks time resolution. . . 110 6.6 The cross correlation function calculated between the de-trended
0.3–10 keV continuum light curve and the 5.3–6.1 keV feature (red+wing) light curve. . . . 111 6.7 The Fe K line profile during the High flux (open squares) and the
Low flux (solid circles) phases of the 5.3–6.1 keV feature. The ra-tios are computed against the best-fitting continuum model. The energies are in the observer frame. . . . 111
7.1 Soft (S: 0.3–3 keV) and a hard (H: 3–12 keV) EPIC–pn source light curve together with the resulting hardness ratio (bottom panel). As revealed by fitting a constant to the data, the hard band is more variable than the soft one (χ2r = 1.65 vs. χ2r = 0.85 for 67 dof).
However, the hardness ratio is still consistent with a constant value throughout the observation. . . 117
7.2 The broadband (0.3–12 keV) EPIC–pn spectrum of IRAS 13197– 1627. The spectrum exhibits strong curvature in the hard band which is a clear sign of absorption by a substantial column of gas in the line of sight. Fe emission is detected at 6.4 keV in the rest– frame (vertical dotted line) together with a deep absorption edge at 7 keV. A soft excess is present below ∼ 3 keV and is characterised by a bump around 0.9 keV. Data have been rebinned for visual clarity.118 7.3 The 2–12 keV pn spectrum is shown together with a simple model
(solid line) comprising a power law absorbed by a column density of ∼ 6.2 × 1023cm−2of neutral matter at the redshift of the source and a resolved (σ ∼ 90 eV) Gaussian emission line at 6.4 keV. Only the pn data are shown but all spectral analysis is performed simultaneously with the MOS data as well. Notice several resid-uals: absorption structures are seen around 6.8 keV and 7.1 keV. Moreover the model systematically underestimates the data in the 5–6 keV band and above 10 keV. In the Figure, data have been rebinned for visual clarity. . . 119 7.4 Top: A Gaussian line is added to the baseline model and its energy
and normalisation are varied. The contours represent an improve-ment of ∆χ2 = −1, −2.3, −4.61, −9.21 in fitting the joint pn–MOS data. The ∆χ2 = −1 contour (outermost) is shown as a reference of the best–fitting continuum model. Bottom: In this case the Fe Kα line of the baseline model is forced to be unresolved. The shape of the residuals strongly suggests the presence of X–ray reflection from the disc (broad Fe emission line and broad Fe absorption edge).121 7.5 Same as in Figure 7.4, but now for the best–fitting model
com-prising Compton–thin absorption and reflection from the accretion disc, both with slightly super–solar Fe abundance (see text for de-tails). The only remaining residual is a narrow absorption line at 6.8 keV. The rest–frame energies of the closest transitions (Fe and Fe resonant absorption) are shown as vertical lines. . . . 122 7.6 In the top panel I show the result of our best–fitting model in the 2–
12 keV band (see Table 1). Only the pn data are shown for clarity. In the bottom panel, I show the model components. . . 126
xiv LIST OF FIGURES
7.7 In the top panel I show the baseline XMM–Newton model applied to the BeppoSAX data (MECS and PDS detectors). The fit is ac-ceptable but large residuals are seen around 20–30 keV where re-flection is expected to dominate. In the bottom panel, I add the disc reflection component, i.e. I apply the XMM–Newton best–fitting model to the BeppoSAX data. . . . 128 7.8 The 2–10 keV reflection flux is plotted against the 2–10 keV
contin-uum flux from the three available observations. This demonstrates that the reflection component responds to the continuum long–term variability within the errors. As a reference the best–fitting linear relationship is shown. . . . 131
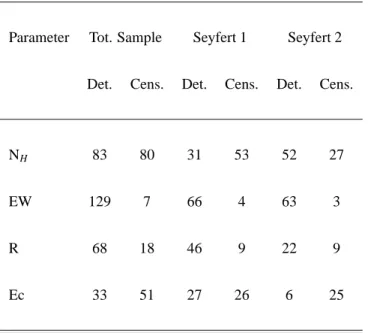
3.1 General characteristics of the data analyzed here. The number of detections and censored data are reported for the interesting pa-rameters for the whole sample of objects (columns 2 and 3), for the Seyfert 1 galaxies (columns 4 and 5), and for the Seyfert 2 ob-jects (column 6 and 7). The 90% confidence interval limits were used for censored data and the detected values were defined if de-termined with a 99% confidence level . . . . 33
3.2 Mean spectral properties obtained with the BeppoS AX sample. Col. I: Spectral parameter; Col. II: Seyfert 1 mean value; Col.III: Seyfert 2 mean value; Col. IV: Probability that Seyfert 1 and Seyfert 2 are drawn from the same parent populations. . . . . 36
3.3 Compton-thick/thin Seyfert 2 candidates . . . . 43
3.4 Mean properties of the FeKα emission line. Col. I: spectral pa-rameter; Col. II mean value for the whole sample; Col. III: mean value for Seyfert 1; Col. IV: mean value for Seyfert 2. Col. V: Probability that the parameters of type I and type II objects are drawn from the same parent population. . . . 47
4.1 Correlation statistics in luminosities . . . . 68
xvi LIST OF TABLES
5.1 Top panel: Best–fit values of the summed spectra (XIS0+XIS3) of all observations fitted in the 3.5–10 keV band. Both model A and B include a power law and two Gaussian lines Kα+β to fit the 6.4 keV excess. In addition to this baseline model, either another Gaussian component (Model A) or a DISKLINE profile (Model B) have been added to reproduce the ionized line, respec-tively. In Table the best–fit power law spectral index (Γ) and nor-malization as well as the Fe Kα energy, width and normaliza-tion are reported for model A and B. The energy, width and nor-malization are reported when a Gaussian profile for the ionized Fe K line is considered (Model A), while the best fit energy, in-ner radius and normalization are presented when a DISKLINE profile is fitted (Model B). Standard disc reflectivity index, outer disc radius and disc inclination of α = 3, rout = 400 rg and 30◦ have been assumed for the relativistic profile. Bottom panel: Best fit results of the summed XMM-Newton pn and EPIC-MOS data of Mrk 509 (fitted in the 3.5–10 keV band). The model (wabs*zxipcf*(pow+zgaus+zgaus+pexrav+kdblur*(reflion))) con-sists of: i) a power law; ii) two Gaussian emission lines for the Fe Kα and Kβ emission (this latter has energy is fixed to the expected value, 7.06 keV, intensity and width tied to the Kα values); iii) a neutral reflection continuum component (pexrav in Xspec) with R=1 (value broadly consistent with the pin constraints and the val-ues previously observed; De Rosa et al. 2004), Solar abundance and high energy cut off of the illuminating power law at 100 keV; iv) a ionized disc reflection spectrum (reflion model; Ross & Fabian 2005) with the disc inner and outer radii and the emissivity of 6, 400 rg and −3, respectively. The best fit disc inclination and ion-ization and the normalion-ization of the disc reflection component are shown; v) an ionized absorption component (zxipcf) totally cov-ering the nuclear source. The best fit column density, ionization parameter and outflow velocity are reported. a) In units of 10−2
photons keV−1cm−2s−1at 1 keV; b) In units of 10−5photons cm−2 s−1; c) In units of eV; d) In units of 1022atoms cm−2. . . . 93
6.1 Date, duration, useful exposure and mean EPIC pn 0.3–10 keV count rate for each XMM-Newton observation of NGC 3783. . . . 103 6.2 Spectral features of interest in the 4–9 keV band with the selected
band-passes and mean intensity. . . 105
7.1 The best–fitting parameters from joint fits to the 2–12 keV (pn) and 2–9.5 keV (MOS) spectrum of IRAS 13197–1627 (χ2 = 442 for 438
dof). . . 124 7.2 The best–fitting model to the XMM–Newton data is applied to the
previous ASCA (2–10 keV) and BeppoSAX (2–80 keV) observa-tions. I report the most relevant best–fitting parameters and the resulting statistics (χ2/dof). For the BeppoSAX (XMM–Newton) ob-servation, the baseline model also comprises a ∼7.5 keV (∼6.8 keV) absorption line. . . 130
A.1 List of the sources analyzed in this thesis. Col. I: Object Name; Col. II and III: Right ascension and declination (Equinox 2000); Col. IV: Redshift; Col. V: Seyfert type; Col. VI: Radio class. . . . 141 A.2 Observations Log. Col. I: Object name; Col. II: Observation date;
Col. III: MECS exposure in ks; Col. IV: PDS exposure in ks; Col. V: MECS detection significance in the 2-10 keV band express in terms of standard deviation; Col. VI: PDS detection significance in the 20-100 keV band express in terms of standard deviations. In parentheses, values concerning the 20-50 keV band for those sources that are not detected in the 15-100 keV band. . . 144 A.3 Best-fit spectral parameter. Col. I: Observation name; Col. II:
To-tal absorber Col. density; Col. III: Photon index; Col. IV: Energy centroid of the emission FeKα line; Col. V; EW of the emission line; Col. VI: Reflection parameter R; Col. VII: High-energy cut-off; Col. VIII: 2-10 keV flux; Col. IX: 2-10 keV observed luminos-ity; Col. X: 20-100 keV flux. Upper limits (3σ confidence level) have been calculated following the method presented in Sect. 3.3; Col. XI: 20-100 keV observed luminosity. . . . 150
xviii LIST OF TABLES
B.1 The X–C f A galaxy sample Col. (1): Galaxy name; Col. (2):
op-tical classification, ’*’= objects with a changed classification with respect to the original given by HFS97. The quality rating is given by “:” and “::” for uncertain and highly uncertain classification, respectively, as reported in HFS97.; Col. (3): Hubble type; Col. (4) total apparent B magnitude of the galaxy; Col. (5): galaxy distances; Col. (6): Col. (7)-(8) optical position in epoch J2000. . 191
B.2 Multi-wavelength luminosities and MBH of the total X-ray sam-ple: Col. (1): galaxy name; Col. (2): optical classification; Col.
(3): Satellite used: ’C’=Chandra, ’X’=X M M–Newton, ’A’=ASCA; Col. (4): logarithm of the 2-10 keV flux in units of erg cm−2 s−1, not corrected for Compton thick candidates. Col. (5): logarithm of the 2-10 keV luminosity, corrected for Compton thick candidates. Col. (6): X-RAY REFERENCES: (1) Cappi et al. 2006; (2) This work; (3) Pappa et al. 2001; (4) Guainazzi et al. 2005b; (5) Terashima et al. 2002; (6) Eracleous et al. (2002); Col. (7): Final classification: ’√’=Compton thick candidates, ’×’=Compton thin candidate and ’?’=doubtful objects.; Col. (8): logarithm of the [OIII]λ5007luminosity corrected for Galactic absorption and NLR
extinction; Col. (9): logarithm of the Hα (broad+narrow compo-nent) luminosity corrected for Galactic absorption and NLR ex-tinction; Col. (10): logarithm of the MBH value in units of M⊙;
Col. (11): MBH meaurement methods; M: maser kinematics; G: gas kinematics; S: stellar kinematics; R: reverberation mapping; Iσ: inferred from the mass-velocity dispersion correlation; Col.
C.1 The X M M–Newton sample: Col. (1): galaxy name. Col. (2): other name. Col. (3): optical classification as given by HFS97: “S” represents Seyfert, “L” represents LINER, and “T” represents objects with LINER plus H II-region spectra. “2” implies that no broad Hα is detected; “1.9” implies that broad Hα is present, but not broad Hβ; “1.5” implies that both broad Hα and broad Hβ are detected, with substantial contributions from both the BLR and NLR (Osterbrock 1981). Objects with a changed classification with respect to the original given by HFS97 (see also Ho et al. 1997b and HU01) are denoted by “*” after their name. Col. (4): Hubble type as listed in HFS97. Col. (5): distance from Tully (1988), except when marked with (a) Paturel et al. (2002), (b) Cecil et al. (2002), (c) Tonry et al. (2001), and (d) Thim et al. (2004). Col. (6): total apparent BT magnitude of the galaxy. Col. (7)–(8): nuclear optical position in epoch J2000 as given by HU01. . . 199 C.2 Col. (1): galaxy name. Col (2): Galactic absorption along the
line of sight, in units of 1020cm−2. Col. (3): measured absorption column density, in units of 1022cm−2. Col. (4): power-law photon index. Col. (5): photon index of the soft power-law component. Col. (6): temperature of the thermal component (kT ) in units of keV. Col. (7): equivalent width of the Fe K line, in units of keV. Col. (8): reduced chi-squared and number of degrees of freedom. Col. (9)–(10): observed fluxes in the soft (0.5–2 keV) and hard (2–10 keV) X-ray bands, in units of 10−13 erg cm−2s−1. Col. (11)–(12): Log of the absorption-corrected luminosities in the soft (0.5–2 keV) and hard (2–10 keV) X-ray bands (computed using distances from Table C.1) . . . 202
Seyfert galaxies are the closest active galactic nuclei. As such, we can use them to test the physical properties of the entire class of objects. To investigate their general properties, I took advantage of different methods of data analysis. In particular I used three different samples of objects, that, despite frequent overlaps, have been chosen to best tackle different topics: the heterogeneous BeppoS AX sample was thought to be optimized to test the average hard X-ray (E≥10 keV) properties of nearby Seyfert galaxies; the X-C f A was thought the be optimized to compare the properties of low-luminosity sources to the ones of higher luminosity and, thus, it was also used to test the emission mechanism models; finally, the
X M M–Newton sample was extracted from the X-C f A sample so as to ensure a
truly unbiased and well defined sample of objects to define the average properties of Seyfert galaxies.
Taking advantage of the broad-band coverage of the BeppoS AX MECS and PDS instruments (between ∼2-100 keV), I infer the average X-ray spectral proper-ties of nearby Seyfert galaxies and in particular the photon index (<Γ>∼1.8), the high-energy cut-off (<Ec>∼290 keV), and the relative amount of cold reflection (<R>∼1.0). Moreover the unified scheme for active galactic nuclei was positively tested. The distribution of isotropic indicators used here (photon index, relative amount of reflection, high-energy cut-off and narrow FeKα energy centroid) are similar in type I and type II objects while the absorbing column and the iron line equivalent width significantly differ between the two classes of sources with type II objects displaying larger absorbing columns. Taking advantage of the X M M–
Newton and X–C f A samples I also deduced from mwasurements that 30 to 50%
of type II Seyfert galaxies are Compton thick.
Confirming previous results, the narrow FeKα line is consistent, in Seyfert 2
xxii LIST OF TABLES
galaxies, with being produced in the same matter responsible for the observed ob-scuration. These results support the basic picture of the unified model. Moreover, the presence of a X-ray Baldwin effect in type I sources has been measured using for the first time the 20-100 keV luminosity (EW∝L(20-100)−0.22±0.05). This find-ing suggests that the torus coverfind-ing factor may be a function of source luminosity, thereby suggesting a refinement of the baseline version of the unifed model itself.
Using the BeppoS AX sample, it has been also recorded a possible correla-tion between the photon index and the amount of cold refleccorrela-tion in both type I and II sources. At a first glance this confirms the thermal Comptonization as the most likely origin of the high energy emission for the active galactic nuclei. This relation, in fact, naturally emerges supposing that the accretion disk penetrates, de-pending to the accretion rate, the central corona at different depths (Merloni et al. 2006): the higher accreting systems hosting disks down to the last stable orbit while the lower accretting systems hosting truncated disks. On the contrary, the study of the well defined X–C f A sample of Seyfert galaxies has proved that the intrinsic X-ray luminosity of nearby Seyfert galaxies can span values between 1038−43erg s−1, i.e. covering a huge range of accretion rates. The less efficient systems have been supposed to host ADAF systems without accretion disk. However, the study of the
X–C f A sample has also proved the existence of correlations between optical
emis-sion lines and X-ray luminosity in the entire range of LX covered by the sample.
These relations are similar to the ones obtained if high-L objects are considered. Thus the emission mechanism must be similar in luminous and weak systems.
A possible scenario to reconcile these somehow opposite indications is assum-ing that the ADAF and the two phase mechanism co-exist with different relative importance moving from low-to-high accretion systems (as suggested by the Γ vs. R relation). The present data require that no abrupt transition between the two regimes is present.
As mentioned above, the possible presence of an accretion disk has been tested using samples of nearby Seyfert galaxies. Here, to deeply investigate the flow pat-terns close to super-massive black-holes, three case study objects for which enough counts statistics is available have been analysed using deep X-ray observations taken with X M M–Newton. The obtained results have shown that the accretion flow can significantly differ between the objects when it is analyzed with the ap-propriate detail. For instance the accretion disk is well established down to the
last stable orbit in a Kerr system for IRAS 13197-1627 where strong light bending effect have been measured. The accretion disk seems to be formed spiraling in the inner ∼10-30 rgin NGC 3783 where time dependent and recursive modulation
have been measured both in the continuum emission and in the broad emission line component. Finally, the accretion disk seems to be only weakly detectable in rk 509, with its weak broad emission line component.
Finally, blueshifted resonant absorption lines have been detected in all three objects. This seems to demonstrate that, around super-massive black-holes, there is matter which is not confined in the accretion disk and moves along the line of sight with velocities as large as v∼0.01-0.4c (whre c is the speed of light). Wether this matter forms winds or blobs is still matter of debate together with the assessment of the real statistical significance of the measured absorption lines. Nonetheless, if confirmed, these phenomena are of outstanding interest because they offer new potential probes for the dynamics of the innermost regions of accretion flows, to tackle the formation of ejecta/jets and to place constraints on the rate of kinetic energy injected by AGNs into the ISM and IGM. Future high energy missions (such as the planned Simbol-X and IXO) will likely allow an exciting step forward in our understanding of the flow dynamics around black holes and the formation of the highest velocity outflows.
Chapter 1
The scientific framework
It is universally assumed, that the vast majority of massive galaxies host super-massive black-holes (SMBH) at their center (Kormendy & Richstone 1995, Magor-rian et al. 1998). This was assumed as a paradigm for active galactic nuclei (AGN) only ∼10 years ago. Now, deep infra-red observations have proved that this is in-deed the real nature of the massive dark object that lies, for example, in the nucleus of the Galaxy (Eckart & Genzel 1996).
AGN are the compact objects that display the largest stable release of energy in the Universe (Lbol∼1038−47erg s−1). As such, they are of intrinsic interest and,
giving their luminosity, they could represent powerful markers to trace the distant Universe.
In recent years it has been discovered that the SMBH and the bulge/spheroidal component of the host galaxies have most probably evolved together. This is proved by the existence of the tight relations between the mass of the SMBH and the mass of the bulge and the dynamics of the stellar population that form the bulge (Magorrian et al. 1998; Merritt & Ferrarese 2001a, 2001b; Marconi & Hunt 2003; Marconi et al. 2004).
Finally, it has been definitively proved that the cosmic X-ray background (CXB) is sinthetized by a mix of absorbed and unabsorbed AGN that must rapidly evolve with cosmic time, the evolution depending on the mass of the SMBH itself (Co-mastri et al. 1995, Gilli et al. 2001, 2007) and thus on the mass of the spheroid of the host galaxies.
These evidences clearly indicate that the understanding of the physics of AGN,
of their structure and evolution are among of the most important goals of modern astrophysics.
In this thesis, I will focus on some specific topics regarding nearby radio-quiet (RQ) AGN. These AGN are privileged targets since the absence of relativistic en-hanced emission due to the jets of radio-loud (RL) objects offers an undisturbed vision of the nuclear regions. In particular, I will focus only on the nearby AGN, the Seyfert galaxies, and the problematic involving their inner few parsecs. The main scope of this work, in fact, was to investigate the physics of the AGN core from the edges of the putative dusty torus towards inner limits of the accretion
disk (see next section). In doing so, I will present some open problems that I tried
to tackle and the results I obtained.
The main astrophysical problematic I will face may be divided in two major families: a) the validity of the Unified Models for AGN (UM, Antonucci 1993) and b) the physics of the accreting matter close to the last stable orbits.
While the first topic was investigated using samples of nearby objects, the sec-ond topic was studied both using the same samples as for point a) but also focusing the attention of few objects that can be regarded as three case studies.
1.1
The AGN
Early after their discovery, it was supposed that the energy emission of AGN could hardly be reconciled with stellar activity given the fast variability patterns measured in the electromagnetic emission of AGN. This put very small and tight constraints on the dimensions of the regions from which the AGN emission was produced. Moreover, while the energy output of a typical galaxy is usually con-centrated within no more than a decade in the frequency domain (being the sum of almost co-eval star populations), the AGN spectra are clearly described by a power-law emission from radio (I.R.) to X- (γ-) rays with similar energy release in decades of frequencies. In particular, one of the fingerprints of AGN emission is that the X-rays are at least 1000 times more intense in AGN with respect to normal galaxies. This fact alone explains why the high-energy bands are fundamental tools in understanding the AGN physics.
High luminosity, variability and spectral shape, clearly indicated that the mech-anism acting at the center of the AGN should be highly efficient and restricted
The scientific framework 3
to operate in regions with dimensions of few/some light-sec. Simple order-of-magnitude estimates clearly indicated, since the 70ies, that extraction of gravita-tional energy due to accreting matter onto a SMBH was the most likely explanation to the observed emission. The basic considerations were that:
1. the typical dimensions (Swartschild radius, rs=GMr ) of systems centered around
SMBH are of the order of a few to a few thousands of light-second moving from 106to 109M⊙objects, i.e. these dimensions are in accordance with the variability measured in AGN;
2. the gravitational potential energy induced by a SMBH is a huge reservoir of energy;
3. the gravitational energy can be transformed in electromagnetic radiation with an efficency (η∼0.42 for Kerr BH) that is almost 60 times higher than the efficency of p+− p+cycle.
These were the theoretical and observational evidences at the basis of the so called S MBH paradigm.
During the now five decades of active studies on the AGN, these cosmic sources have been classified in a large variety of sub-classes. These sub-classes often di-rectly reflected the methods of discovery/detections of the AGN activity in the studied objects (this is, for instance, the case of narrow emission line galaxies, NELG, detected first in X-ray and than optically classified as narrow line objects, i.e. Seyfert 2 galaxies). This leaded to the creation of the Seyfert, LINER, NELG, OVV, BLLac, Quasar, BLRG, NLRG... and so on classes. This tendency have been, at least partially inverted in the last decade during which the AGN zoo has been significantly reduced to a few major families.
From an observational point of view, within the AGN family clearly exist a major separation between objects that display strong radio emission (radio loud objects, RL) and the ones that display a drop of power at frequency lower than the IR (RQ objects).
Another major difference between AGN classes rises from the spectral charac-teristics in the IR-optical-UV domain. In this energy range, in fact, all the sources display narrow (FWHM≤1000 km s−1) emission lines of both permitted and for-bidden transitions. Only a fraction of AGN shows, with the narrow lines, also
broad (FWHM≥2000 km s−1) lines due to permitted transitions only. The latter objects have been classified as type I AGN and the former as type II.
As above mentioned, the Seyfert galaxies are the closest AGN to our Galaxy and are found at z≤0.2/0.3. As such their observation, expecially in X-rays, often provide good quality spectra making of the Seyfert galaxies a privileged class of objects to test the physics of the inner regions of the AGN. They are defined as RQ AGN with Lbol≤2×1042 erg s−1. Seyfert nuclei are typically associated to spiral
galaxies with absolute magnitude upto Mv∼-21, -22.
1.2
The unified models
In the middle of 80ies it was proposed by Antonucci & Miller 1985 (see An-tonucci 1993 for a review on this topic) the so-called unified model (UM) of AGN. The basic idea of such scenario is that all the differences between the classes of AGN are due to two simple facts: a) the geometry of the observer-object system and b) the presence of a relativistic jet of matter coming from the core regions of the accretion systems.
The UM (see Figure 1.1) assumes that if a few basics conditions are fulfilled than, at least at the zero-th order, almost all classes of AGN can be reconciled in a single picture. These conditions may be summarized as follow:
• a SMBH, is located at the center of the AGN and it’s responsible of the
emission of a huge quantity of energy;
• the source is surrounded by a geometrically thin accretion disk;
• the accretion disk is surrounded by a geometrically and optically thick dusty
torus;
• above the accretion disk and within the dusty torus are located the clouds
responsible for the production of the broad permitted emission line detected in the IR-optical-UV spectra of type I AGN (BLR);
• at larger distances from the nucleus and well outside the dusty torus, are
located the clouds responsible for the emission of the narrow lines observed in both type I and II objects;
The scientific framework 5
Figure 1.1: Schematic view of the UM. The scheme accounts for the different kinds of RL and RQ AGN. The physical components that are thought to be present in the circumnuclear region around the SMBH are represented (M. Polletta adapted from Urry & Padovani 1995)
• in some (∼10%) of the AGN, the presence of jet that carry outward the matter
at relativistic speeds is responsible of the emission in the radio frequencies.
It is clear that the UM was and is a simple geometrical model/scenario that, apart for the existence of a compact accrettor as primary responsible of the energy release, does not assume, for example, any model for the formation of the jets or the production of the X-rays. As such, the testing of the UM is, in principle, only the validation of a geometrical scheme. Nonetheless, being born to explain the observational evidences, it justifies in an elegant way a number of experimental proofs and it was also able to predict many observational evidences obtained only after the formulation of the model itself. Moreover, the UM has been assumed as a basic model for a variety of physical scenarios such as the synthesis of the cosmic X-ray background. Thus, the testing of the UM is of fundamental importance also for this and other research fields. By the way, in the following of this section, for purposes of simplicity, I will briefly describe the general properties of the Seyfert galaxies using the UM scenario as the reference one.
At a first order approximation, the broad band nuclear spectrum of Seyfert galaxies can be described by a simple power-law:
Fν∝να (1.1)
where Fνis the energy irradiated per time unit, ν is the frequency and α is the spectral index (α∼1 from IR to optical). On this major pattern, other important spectral features are overimposed (see Figure 1.2).
The most prominent ones are the emission bump peaking in the B band and called big blue bump (BBB). It is visible only in type I source thus its origin must be located within the dusty torus. It’s shape resembles the black-body one and thus the BBB is most probably due to the superimposition of multitemperature black-body emission due to the different region of the accretion disk itself. This interpretation have, nonetheless, to face some controversial observational results. It is expected that the observed variability should have different characteristic times moving from optical to UV since in the different bands the accretion disk should contribute with the matter at different radii. This is not what has been observed in some cases (Ulrich et al. 1997) where the variations were observed to occur simultaneously at all wavelength.
The scientific framework 7
Figure 1.2: Schematic representation of the continuum emission measured in Seyfert galaxies (Courtesy of J. Manners)
Also the IR emission is thought to be of thermal origin and due to the reprocess-ing of the primary radiation from dust. Indeed, the presence of a local minimum at ∼ 1µm hints at a thermal emission mechanism. This is, in fact, likely due to reprocessing from dust closest to the nuclear source (∼o.1 pc) having temperature of the order of 2000 K: at higher temperatures the grains sublimate.
1.3
The Seyfert galaxies in X-rays
The high energy emission from AGN comes from the innermost regions of the accreting systems centered around SMBH. For this reason, X-rays are expected to be tracers of the physical conditions experienced by matter before disappearing into SMBH. Moreover, thanks to their high penetrating power, energetic photons, escaping from the nuclear zones, test the matter located between their source and the observer. Thus, they offer powerful diagnostics to understand the geometry and the physical conditions of the matter surrounding the SMBH.
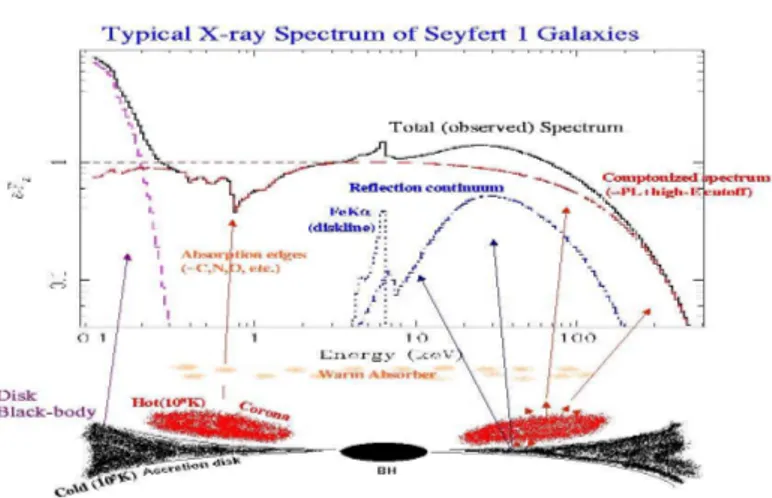
Figure 1.3 shows the typical X-ray spectrum of a Seyfert 1 galaxy and a sketch of the regions close to the SMBH that are thought to be responsible for the observed spectral features. In the framework of the standard model, these components can be briefly listed and identified as follows:
Figure 1.3: Schematic representation of the X-ray spectrum observed in type I Seyfert galaxies (Courtesy of M. Cappi)
1.3). At E≥50 eV, the power-law emission decline after an exponential cut-off;
• a reflection component is also measured above ∼6 keV and peaking at
E∼30-40 keV. It also includes also the strongest emission line measured in X-ray, i.e. the broad FeKα emission line at 6.4 keV. This component comes from the accretion disk and/or the inner walls of the dusty torus (Ghisellini, Haardt & Matt 1994)
• in a significant fraction of type I AGN, the nuclear radiation passes through
a partially ionized plasma (the so-called warm absorber). This plasma im-prints on the primary continuum the main narrow absorption features in soft X-ray band;
• in most type I sources an excess above the power-law is observed at low
energies (E≤2-3 keV). This component is named so f t excess. It’s origin is unknown and still highly debated. It is supposed to be peaked at E∼0.1-0.2 keV (Gierli´nski & Done 2006) independently from the mass of the SMBH. This hardly disfavors a thermal origin of such component since, in that case, the emission peak should scale with the mass of the SMBH (T∝M1/4BH). A
probable atomic origin has been proposed both in terms of absorption due to atomic transitions or emission of forests of lines due to Iron and other
The scientific framework 9
elements (Gierli´nski & Done 2006, Crummy et al. 2006).
As previously said, the UM predicts that the type II objects are intrinsically identical to type I but with observational differences introduced by absorbing mat-ter that inmat-tercept the line of sight. Thus the type II Seyfert are expected to display all those spectral features that are not hidden by the absorption matter. They are also expected to show in the X-ray spectra, a low-energy cut-off due to the cold absorption induced by the dusty torus. This is indeed observed (see §1.3.2).
1.3.1 The X-rays emission mechanism
The baseline model for the production of X-rays in Seyfert galaxies is known as two–phase model (Haardt & Maraschi, 1991, 1993). It assumes that close the SMBH the optically thick, geometrically thin accretion disk (cold phase, T∼105−6 K) is sandwiched by a optically thin and geometrically thick corona (hot phase). It is assumed that the largest part of the gravitational energy is released in the corona, probably for the reconnection of magnetic fields (Burm, 1986) as it happens in the sun. Whatever the mechanism, it is assumed that the corona reaches temperatures of the order of T∼109 (i.e. kT∼100 keV). At this temperature the the electron
population in the corona becomes mildly relativistic (β∼0.7 and the corresponding Lorentz factor becomes γ∼1.4). The interactions between the photons and the matter in the two phases leads to a complex process that can be simplified in the following cycle:
1. the X-ray emission from the corona is emitted in part towards the observer and in part towards the accretion disk;
2. the accretion disk thermalize the X-ray photons coming from the corona and re-emit the energy budget received by the corona in the UV/soft X-ray regime. These photons must cross the corona;
3. here, UV photons are Comptonized to X-ray energies by the e−in the Corona that emits part of the photons towards the disk and part towards the observer sustaining the cycle (return to point 1).
In the two–phase model, the power-law shape typical of the X-ray spectrum (Turner & Pounds 1989, Nandra & Pounds 1994) of the Seyfert galaxy is indeed
due to the sum of the different Maxwellian-like distribution of the X-ray photons produced in different order of scattering. It is worth considering here that in this scenario the inverse Compton is the main cooling mechanism acting in the Corona and that the final spectral shape depends also on the cooling rate (Merloni et al. 2006). Finally, it is worth noting that in this picture it is predicted the presence, in the X-ray spectra of Seyfert galaxies, of an high-energy cut-off (Ec) corresponding to the temperature of the e−of the Corona.
1.3.2 The neutral absorption in type II Seyfert galaxies
The most striking broad feature observed in the X-ray spectra of Seyfert galax-ies is the cut–off in the soft X-ray band due to absorption by material associated to dusty torus. This material suppresses the primamry emission via photoelectric absorption. The observed absorption (hydrogen equivalent) column density (NH)
in type I objects are often consistent with what expected to take into account the absorption due to the matter located in the Galaxy along the line of sight. In type II sources, the measured NHspans from few 1022 cm−2up to NH≥1025cm−2. When
the absorbing column exceeds few×1024cm−2, the primary emission is completely blocked and only a reflected component is accessible to the observes. In this case, the source is named Compton-thick (CT).
Even thought somewhat at odds with the UM, some examples of type I (type II) sources suffering (non suffering) of absorption in X-rays have been found (Maccac-aro et al. 1982, Fiore et al. 2001a, Panessa & Bassani 2002, Bianchi et al. 2008a, Brightman & Nandra 2008). Some possible explanation of this occurrence can be listed as follow: i) the dust-to-gas ratio of the X-ray absorbing material could be lower than it is in the Galaxy (Maiolino et al 2001a); ii) the dust grain size of this material could be larger than Galactic ones (Maiolino et al 2001b); iii) the line of sight does not intercept the torus but pass trough disk winds located within dust sublimation radius (Weingartner & Murray 2002).
Nonetheless, it must be stressed that some bona f ide type II Seyferts do not dis-play any significant hints of absorptions have been observed (Bassani et al. 1999; Panessa & Bassani 2002; Bianchi et al. 2008a; Brightman & Nandra 2008). These sources, thus, are that targets that Antonucci (1993) defined as the true Seyfert 2, i.e. the ones that could pose serious problems the the UM theory. If confirmed,
The scientific framework 11
Figure 1.4: Le f t panel : the X-ray reflection component emerging from a neutral slab (solid line). The dashed line shows the incident continuum. Most of the radiation below 20 keV is absorbed by metals in the reflecting slab and re-radiated at lower energies (i.e. thermalized). Right panel : the reflection spectra predicted assuming different ionization states for the reprocessing slab. The ionization states are described by the ionization parameter ξ (see text). When the reflector is ionized, strong emission lines are produced at E≤2 keV. (Figures from Fabian et al. 2000)
they are most probably few (Panessa & Bassani 2002). Thus it is possible to assess that the UM is, in general, a valid interpretation scheme.
1.3.3 The reflection component
As previously said (§1.3.1) the optically thick material of the disk is irradiated by the primary emission produced in the hot corona. The hard X-ray photons thus should penetrate the surface slab of material and penetrate within the disk. Here these photons are expected to be subjects to many interactions like Compton scat-tering by free or bound electrons, photoelectric absorption and either fluorescent line emission or Auger de–excitation. Each photon undergoes either destruction through Auger de–excitation, or is scattered out of the slab, or reprocessed into fluorescent line photons which escapes from the slab.
The left panel of Figure 1.4 shows the expected X-ray reflection continuum from an illuminated slab. The dashed line shows the incident spectrum while the solid line shows the reflected component (Reynolds 1997; Fabian et al. 2000).
When the disc ionization is low, as shown in the left panel of Figure 1.4, low energy photons (E≤10-20 keV ) are mainly photoelectrically absorbed by the ions in the slab. The higher energy photons, on the contrary, are mostly back scattered via Compton down scattering. Thus, the net effect is that the reflection spectrum shows an hump between 30-40 keV. This spectral feature has been observed in the X-ray spectra f Seyfert galaxies with the Ginga satellite (Pounds et al. 1990; Nandra & Pounds 1994), then with BeppoS AX (Perola et al. 2002), and now with
S uzaku (Reeves et al. 2006).
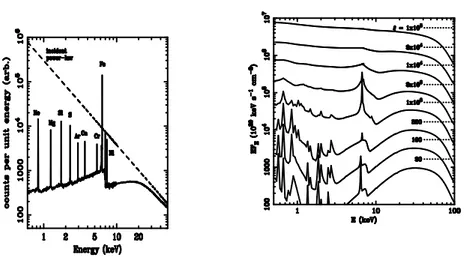
The high luminosity of the corona can photoionize the surface layers of the accretion disk (Ross & Fabian 1993; 2005). The right panel of Figure 1.4 shows the expected reflection continuum and the associated emission lines for different values of the ionization parameters ξ defined as ξ=4πrL2n, where L is the X-ray luminosity
received by the ionized matter, n is the number density of the ionized matter and r is its distance from the source of ionizing photons. The emerging emission lines in the ionized reflection case are mainly due to Oxygen, Carbon, Nitrogen, Neon and the Iron L-shell transitions. These lines appears when the ionization state is moderate (ξ≤5000 erg cm s−1). On the other hand, for higher ionization states, all the elements (including Iron) are completely ionized and the reflection spectrum mimics the incident power-law and the slab behave like an almost perfect mirror.
In addition to the continuum, the reflection component contains also a series of emission lines (see left panel of Figure 1.4). The strongest emission line is the FeKα because of the highest fluorescent yeld and abundance. This emission line is emitted for fluorescence at an energy ranging between 6.4 to 7.1 keV depending on the ionization state of the matter.
Even if thought to arise as an intrinsically narrow emission line, this feature is supposed to originate close to the SMBH where the relativistic effects induced by the strong gravitational field and the high velocity reached by the accreting matter are supposed to be able to act on the emission line (see Figure 1.5).
These effects were first measured with ASCA satellite (Tanaka et al. 1995) in the X-ray spectrum of the Seyfert 1 MCG-6-30-15 and were later confirmed by the detections of similar features in the spectrum of several Seyfert galaxies (Nandra et al. 1997).
The new generation high sensitivity X-ray telescopes have shown clear evi-dence of an almost ubiquitous narrow component of the Fe narrow line (Nandra
The scientific framework 13
0.5 1 1.5 Line profile
Gravitational redshift General relativity
Transverse Doppler shift Beaming
Special relativity Newtonian
Figure 1.5: The shape of reflection lines from the accretion disk is sculpted by the interplay of Doppler and transverse Doppler shifts, relativistic beaming and gravitational redshift. These effects are taken into account step-by-step moving from the upper to the lower panel of this figure. In the first three panel, only the contribution coming from two narrow annuli of the accretion disk are considered. In the lower panel it is plotted the summed profile considering the emission from the entire accretion disk (Figures from Fabian et al. 2000)
2006) produced by matter far from the SMBH. They also confirmed the presence of such broad line (Longinotti et al. 2008) but cast doubts about their interpre-tations since at least part of the so-called red wing can be explained in term of ionized and/or partial covering models (Pounds et al. 2003; Pounds et al. 2004; Turner et al. 2005).
1.4
Open questions
In the previous sections I introduced some fundamental pieces of evidence and theoretical scenarios that compose the average picture of the Seyfert galaxies. In this section I will briefly described some open problems that I tried to tackle during the work done for this thesis. I will also introduce the applied methods.
1.4.1 Testing the UM
In recent years, the number of cases in which the zeroth-order UM predictions seem not to be completely adequate to explain all observational evidences is in-creasing, both in the local and in the distant universe. Type I AGN with significant absorption have been found (Mateos et al. 2005, Fiore et al. 2001a, etc.) as well as type II AGN without X-ray absorption (Caccianiga et al. 2004, Corral et al. 2005, Barcons, Carrera & Ceballos 2003, Panessa & Bassani 2002, Pappa et al. 2001, Bianchi et al. 2008a). As above mentioned (see §1.3) X-rays are one of the most direct evidences of nuclear activity and are, therefore, fundamental to study the accretion processes.
Here I will take advantage of the broad-band of BeppoS AX that offered, for the first time, the opportunity to measure with a remarkable sensitivity the spec-tral shape of AGN in the 0.1-200 keV range simultaneously. This potential had been exploited to study in detail a number of sample selected in different manners (see for example Maiolino et al. 1998; Malizia et al. 2003; Perola et al. 2002). These studies were fundamental in making important steps forward in the compre-hension of the emitting mechanism at work in the production of X-rays (Perola et al. 2002) and to partially reveal the geometry of the cold matter surrounding the central SMBH (Maiolino et al. 1998; Bassani et al. 1999; Risaliti et al. 1999). Here the broad band X-ray data from BeppoSAX will be statistically inspected to
The scientific framework 15
infer the average characteristics of the nearby Seyfert galaxies contained a sam-ple of ∼100 sources (see §2). Their the 2-100 keV band spectra will be used to perform simple tests on the UM for the AGN. The broad-band of BeppoSAX, in fact, allows for the very first time to test the UM using as indicators as the relative amount of reflection and the Ec. The problem of BeppoS AX sample resides in the fact that it is an heterogeneous sample of objects. As such, it cannot be used to infer the average properties of the Seyfert family. To do that, I will take advantage of two other samples named X M M-Newton and X-C f A samples (see §2.2 and 2.3 respectively) that are expected to be complete and unbiased.
1.4.2 The emission mechanism
It is not clear whether at very low luminosities the predictions of UM are still valid (Panessa & Bassani 2002, Ho et al. 2001, Merloni et al. 2003). The key for the comprehension of the whole AGN phenomenon seems to reside in a combina-tion of the UM hypothesis and the fundamental parameters of AGN, such as black hole mass, Eddington ratio, and perhaps the black hole spin. After the discovery that SMBHs reside at the center of most, if not all, galaxies in the nearby universe (Kormendy & Richstone 1995, Magorrian et al. 1998) and that a large fraction of them are active (at least 40%, Ho, Filippenko & Sargent 1997b), it is of fundamen-tal importance to understand the accretion physics in AGN and what triggers the different levels of activity.
One of the distinctive characteristic of nearby nuclei is their intrinsic faintness, i.e. LBol<1044erg/s (Ho 2003), as well as their low level of activity; in terms of
Eddington luminosity most of them have L/LEdd <10−2compared to L/LEdd ∼ 1
of luminous AGN.
Whether low luminosity AGN (LLAGN) are a scaled-down luminosity version of classical AGN or objects powered by different physical mechanism is a debated issue. It is not clear in fact, whether LLAGN are powered by radiatively ineffi-cient accretion flows, such as advection dominated accretion flows (ADAF) and their variants (Narayan & Yi 1994, Abramowicz 1997) instead of the standard ge-ometrically thin optically thick accretion disk typically proposed as the accretion mechanism acting in the central regions of luminous AGN (Shakura & Sunyaev 1973). LLAGN could also represent scaled up versions of black hole binaries in