UNIVERSITY
OF TRENTO
DEPARTMENT OF INFORMATION AND COMMUNICATION TECHNOLOGY 38050 Povo – Trento (Italy), Via Sommarive 14
http://www.dit.unitn.it
WEB SITE QUALITY EVALUATION:
LIGHTWEIGHT OR HEAVYWEIGHT MODELS?
Luisa Mich, Mariangela Franch,
Pierluigi Novi Inverardi and Pietro Marzani
April 2003
Web site quality evaluation: Lightweight or
Heavyweight Models?
1Luisa Mich1, Mariangela Franch2, Pierluigi Novi Inverardi2, Pietro Marzani2 1 Department of Computer and Telecommunication Technology
University of Trento, Via Sommarive 14, I 38050 Trento (I) Tel. +39-0461-882087 – Fax +39-0461-882093
2 Department of Computer and Management Sciences University of Trento, Via Inama 5, 38100 Trento (I)
Tel. +39-0461-882150 – Fax +39-0461-882124 {franch, pnoviinv, pmarzani}@cs.unitn.it
Abstract. One of the most critical decisions in a quality evaluation project
is to establish the level at which to analyse the characteristics of the Web sites. This choice should be driven by the underlying goals of the evaluation. Scalability and flexibility are thus desiderable features of the models used to evaluate the quality of a Web site. In this paper we describe two separate studies of Regional Tourist Boards in the Alps that were conducted instantiating the meta-model 2QCV3Q (7Loci). Specifically, we will show that the results of the first study - based on a lightweight model - are consistent with those obtained with the more detailed heavyweight model in the second study.
1 Introduction
To use a frequently cited metaphor in methodologies for software systems development, this paper aims to deal with the problem of choosing a “weight” for the model to be used to evaluate the quality of a Web site. In the software engineering field, in particular, this implies comparing and choosing between lightweight (more often called “agile”) and heavyweight methods (see for example [3]). We share Kruchten’s point of view [13], which can be summarized in these words: the right question is not so much which of the two approaches is the better (tantamount to asking if there is a method with the “ideal” weight), but rather which method has the “right” weight for a given project. Therefore a highly important feature of a model intended to evaluate Web site quality is its scalability, understood as its having a theoretical reference framework that can be periodically calibrated in accordance with the objectives of the evaluation.2 This means that it is often necessary to adapt the
evaluation models to the domain and to the type of site (or sites) to be evaluated.
1 This paper has been produced within the scope of the eTourism project financed by the Fondazione Cassa di Risparmio di Trento e Rovereto.
Another element to take into account is the development phase of the site (design of a new site, analysis of an existing site in order to redesign it, etc.). In fact, many existing models are specialized for electronic commerce, notable examples being [2], or are built ad-hoc for a specific project (in this category we find the model used in [11] to identify the factors contributing to the success of a hotel Web site, or the evaluation table used for the annual ranking of the best e-commerce sites [6]).3
Nonetheless, it would be useful to have a theoretical reference framework or meta-model to serve as a conceptual schema for the quality criteria used in an evaluation project. This framework must therefore be (a) scalable, to allow for an evaluation at varying degrees of detail, based on the “evaluation purpose”, the sponsor’s requirements and the user’s needs; (b) domain independent, applicable in diverse sectors, from the tourist sector to non-profit organizations, from service companies to the public administration; (c) general purpose, whether corporate or individual, educational or for electronic commerce (B2B, B2C, etc); and (d) user-friendly, to facilitate its comprehension and application by people with different skills.
In studying the need for and possibility of having a common conceptual base for the evaluation of quality in Web sites, and in particular the scalability requirement, we will refer to the 2QCV3Q framework - also called 7Loci -, which we developed using classical rhetorical principles [9] and which can be seen as a meta-model for classification of diverse criteria for Web site quality. The results of the evaluation projects realised thus far have shown that it indeed satisfies the property requirements listed above. In fact, since its development five years ago we have applied it to sites of various kinds and in distinct domains. Moreover, the objectives of the various quality assessments performed were different, thereby attesting to its flexibility.4
More recently, we have used the 7Loci meta-model to carry out two studies of the quality of the Web sites of Regional Tourist Boards (RTB) in the Alps, having different objectives and the sites included in the first group were a sub-group of the second. The meta-model 7Loci was thus used to define two different tables or quality models, based on the "purpose of the evaluation." In particular, in the first of these – where the aim can be described as benchmarking of the sites [4] – a more standardized table was used wherein the loci or dimensions of 7Loci were evaluated based on a limited grouping of attributes (from 3 to 6, for a total of 24 characteristics to evaluate). In the second project – where the aim was to provide indications for an eventual re-designing of the sites based on the needs of tourists and of the RTBs – a more highly detailed table was produced [10]. Specifically, for this second project the requirements for each dimension of the meta-model were reformulated in terms of Boolean questions (from a minimum of 8 to a maximum of 27). The nature of the tables used in the two projects differs greatly; we will show that despite this difference the results obtained with the lightweight version of the model in the first
3 Several models and frameworks for evaluating the quality of Web sites currently exist and an extensive bibliography is available at http://www.cs.unitn.it/WebSiteQuality. See also the related work section in [9].
study are consistent with those obtained with the more detailed heavyweight model in the second study.
The paper is structured as follows: the next section introduces our approach to quality evaluation; section 3 describes the two evaluation projects, highlighting the calibration of the 7Loci meta-model; section 4 contains the comparison of the results obtained, with special attention given to their consistency and comparability. The concluding section puts forth some useful preliminary findings that emerged regarding the adaptive nature of 7Loci to diverse projects.
2 Our approach to quality evaluation
2.1 The 2QCV3Q meta-model
In our Web site evaluation projects we developed an original framework, or meta-model called 2QCV3Q (in Latin V stands for U), which takes its name from the initials of the Ciceronian loci of classical rhetoric that it is based on [1]. Also called 7Loci, the meta-model takes into special consideration the inherently communicative nature of a Web site [8], [9].
Using the Ciceronian loci made it possible to identify the fundamental dimensions of a Web site, resulting in a framework that when compared with existing models can be seen as a meta-model for classification of diverse criteria for quality (table 1). In other words, the seven loci or dimensions constitute the general framework of the “quality models”, which is independent of the sites under analysis. The first dimension, Identity, regards the image that the organisation projects and therefore all elements that come together in defining the identity of the owner of the site. Content and Services refer, respectively, to the information and services available for users. Location regards the visibility of a site; it also refers to the ability of the site to offer a space where users can communicate with each other and with the organisation. Maintenance comprises all activities that guarantee proper functioning and operability of the site. Usability determines how efficiently and effectively the site’s content and services are made available to the user. Feasibility includes all aspects related to project management.
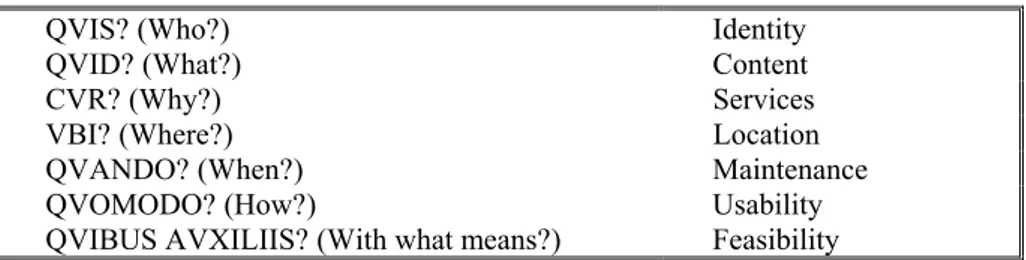
Table 1. Dimensions of the 2QCV3Q (7Loci) meta-model
QVIS? (Who?) Identity
QVID? (What?) Content
CVR? (Why?) Services
VBI? (Where?) Location
QVANDO? (When?) Maintenance
QVOMODO? (How?) Usability
QVIBUS AVXILIIS? (With what means?) Feasibility
The 7Loci meta-model supports a systemic approach to evaluating Web site quality that takes into account these diverse components coming together at a site and
the importance of satisfying the needs of all actors.
As regards the evaluation process, in our projects we have followed some general guidelines for adopting a problem-solving approach in the evaluation of quality. A general model of the evaluation process is given in figure 1. In short, it envisages an initial set-up phase which includes the identification of the evaluation requirements, a design phase in which the evaluation plan and techniques are defined, and a final realisation phase. Given the dynamic nature of quality, it is important to see the evaluation process as iterative.
Evaluation purpose Site mission Users requirements Quality requirements Set-up Evaluation plan Design Evaluation results Realization
Fig. 1 - Quality evaluation process
The seven loci scheme can be used to support "quality requirements" identification in the set-up phase. However, for purposes of this paper, the most important activity is the definition of the evaluation model in terms of the 7Loci meta-model. This "instantiation" or calibration of the evaluation model gives as output the specifications of the characteristics for each locum and determines the level of detail at which each dimension must be analysed. In other words, to design or evaluate a specific Web site, it is necessary to adapt the 7Loci model by identifying the quality criteria that relate to the seven loci or dimensions considered. From an economic point of view, the "weight" of the resulting model determines the resources (time and financial) necessary for the evaluation project. For this reason it is very important to adapt the evaluation method to the different projects, tailoring it to their goals.
In the next section we describe in greater detail the two studies we realised in the context of a broader research project aimed to bring to light the characteristics of both the demand for and offering of tourism in Alpine destinations, focusing on the objectives of the evaluation and on the quality evaluation models used for each study.
3 Evaluating the quality of Web sites of the Regional Tourist
Boards (RTB) in the Alps
To evaluate the quality of the Web site of the (public) tourist boards is the principal objective of one line of study of a triennial research project on tourism in the Alps. The other three research areas are closely related and provide vital information regarding the characteristics of the alpine tourism offering (focusing on the role of tourist promotion boards) and demand (the way in which users choose a specific destination and the use of Internet to obtain information and to make reservations). In
this context we realised two different projects evaluating Web site quality; in short, the aims for each project are, respectively:
1. to compare the principal Web sites of the alpine regions, to identify possible benchmarks;
2. to identify guidelines and recommendations for the design or re-design of the Web site for a tourist destination.
Both the projects were carried out with a consideration that the tourism offering in the Alps is based on the activity of hundreds of small- and medium-sized enterprises (SMEs) and focusing on the importance of the “do it yourself” tourist.5 In such a
context, Web marketing can be construed as a B2C (business to customer) activity and, moreover, a Web site can play the role of Destination Management System (DMS) able to gather information about services, attractions and tourist products [14]. In the alpine territory, activities such as destination management and tourist promotion take place at three different levels, both from an institutional and a geographical point of view: the national level (involving France, Italy, Switzerland, Austria, Germany and Slovenia); the regional level, by the main tourist regions as defined by administrative boundaries; and at the local level, by the specific tourist area inside each region. Working from the results of the other research areas, which identified the regional level as the most important for the definition of tourism strategies, we focused on the Regional Tourist Boards (RTB). Moreover, conditions are comparable at a regional level and the number of RTBs to be analysed is manageable enough to allow for an in-depth study of numerous sites, both factors of considerable importance particularly for the second evaluation project. Scouting the official alpine RTBs' sites we identified 26 Web sites distributed as follows: 7 in Italy, 8 in Austria, 6 in Switzerland, 3 in France, 1 in Slovenia (the national Tourist Board site was considered, given that there are no RTBs) and 1 in Germany.6
3.1 The first evaluation project: benchmarking of the RTB Web sites
Starting from a consideration of the role of the RTBs, the general aim of the first quality evaluation project can be formulated as follows: “to analyze the diffusion and practical application of DMSs in the alpine tourist regions in order to identify the best RTB Web sites, taking into account both organizational and a technological aspects”.
To define a suitable (or "rightweight") evaluation model, we had to take into account in addition to this goal, the need to analyse the Web site from a marketing point of view. This requires expert knowledge in tourism, and familiarity with: (a) the objectives of the RTBs and their goals for the Web site; (b) the RTB organizational structure; and (c) the activities of the RTBs in the alpine regions. In short, from the results emerging from the other three lines of research in the eTourism project, the
5 This and other related information are described in papers prepared as part of the other research lines of the project and are available at www.cs.unitn.it/eTourism/.
6 Surprisingly, this initial scouting activity was more difficult than expected because in many cases there was no clear indication that we were dealing with the official RTB site.
RTBs in the Alps present a variety of organizational forms and financing structures. However, their institutional functions can be classified in three main groups: advertising and promotion; projects for tourism marketing; studies, surveys and gathering of statistical data. From these results we identified three organisational models: fragmented, semi- integrated and integrated.
Considering the purpose of the evaluation and the results of a preliminary survey of the RTBs, for the first evaluation project we instantiated the 7Loci meta-model as a table with 24 questions, from 3 to 6 for each dimension (excluding in this phase the last dimension – feasibility). The table was adapted from a standard one used in projects with similar objectives and constraints (see for example, [8]). In addition, each question was assigned a weight that reflected its importance.
In the realisation phase we focused on ten RTB sites. In particular, we evaluated the most important Austrian tourist region, Tirol (Austrian RTBs are built on the same technological platform); the most structured RTB Web sites for Switzerland (Canton Ticino, Valais, Zentralschweiz and Freiburgerland) and for Italy (Piemonte, Valle d’Aosta, Trentino, Veneto and Alto Adige). As regards the evaluators, we involved four experts in the tourism sector, two of whom were also expert in marketing, one in statistics and one in quality evaluation. The results of the evaluation are given in detail in [4]. Table 2 allows for a comparison of the scores the RTBs received for each dimension. In this sense, it can be considered as a benchmark analysis.
Table 2: A benchmark analysis of the RTB Web sites
Identity Content Services Location Management Usability
Tirol 3,4 3,4 3,75 2,2 3,2 2,95 Canton Ticino 2,3 3,25 3,25 2,2 3,15 3,1 Valais 3,05 2,5 3,75 2,2 3,45 2,75 Zentralschweiz 2,35 2,65 2,25 1,8 2,35 2,5 Freiburgerland7 3,65 3 2,75 1,2 2,15 2,95 Piemonte 1,6 1,4 1 1,4 2,85 2,5 Valle d’Aosta 2 2,85 2,5 1,6 3,25 2,6 Trentino 3,35 3,75 3,25 2,4 2,85 2,5 Alto Adige 3,05 3,1 2,5 1,8 2,85 1,7 Veneto 1,65 2,75 2 1,6 1,6 2,6
3.2 The second evaluation project: requirements for a RTB site
Given the aim of our project - to identify guidelines and recommendations for the design or re-design of the Web site for a tourist destination – in the first part of the research we gathered more information on the needs of the “do-it-yourself” tourist
7 Several of the regions studied have a tourist industry that is not exclusively alpine (Cultural or sea-based offerings are significant in many regions, for example in Veneto). A deeper analysis of tourism data for Freiburgerland showed that the alpine sector played only a secondary role, and was therefore not included in subsequent studies.
and those of other categories of users (local operators and tourists, as well as the professionals and technicians involved in designing and maintaining the Web site). To elicit the requirements [7] for the site of an RTB we used a number of techniques: interviews, analysis of the benchmark Web sites in the first project, survey of the literature on best practices, brainstorming sessions, output of the questionnaire on user demand. According to a customer orientation approach, we gave precedence to the perspective of tourists while at the same time considering the objectives and functions of the RTBs. We then analysed and classified the requirements as quality criteria on the basis of the first six dimensions of the 7Loci meta-model.
Then we reformulated them as Boolean questions, resulting in a detailed model to support the assessment of the quality of the Web sites of these organisations. The quality model was produced following an iterative approach. The end result was a table with about one hundred “elementary” questions for the dimensions of the 7Loci framework and as such it represents a "heavyweight" model in respect to that used in the project described above (the complete table is given on the web site www.cs.unitn.it/etourism/).
To apply the table we had to make some critical decisions, given that the evaluation involved all 26 RTBs. For example, we had to choose the language to use for the assessment (the official language of the region; one has two official languages), and to establish both the order in which to evaluate the dimensions (the Identity of a site includes a series of features that can be assessed more correctly after the Content and Services dimensions) and the order in which to evaluate the sites (a parallel evaluation of the site with each dimension of the framework - this for every site of the specific country). Thus it was possible to obtain more homogeneous assessments without having to open all the sites of the different RTBs. For about 12% of the questions we used support tools (e.g., Xenu, http://home.snafu.de/tilman/ xenulink.html; Watson, http://watson.addy.com). The final performances of the Web sites are given in the web site www.cs.unitn.it/etourism/.
4 Comparing the results of the lightweight and heavyweight models
Both evaluation projects revealed that the quality of the RTB Web sites is vastly different from one region to another. In order to ensure the consistency of the models, we made an initial comparison of the nine sites examined in both projects. To do this we recalculated the weights of the items in the first (lightweight) model based on the number of questions on the given topic in the second (heavyweight) model. Table 3 contains the average scores received by the sites in the two evaluations (for 2001 and 2002). Particularly worth noting is that the difference in scores using the two models were modest, with only one site shifting two positions while the others change only one or remain unchanged.
Table 3. Ranking of nine sites
Average scores for the
dimensions
Ranking ranking Delta
2002 2001 2002 2001 Canton Ticino 0,81 0,76 1 2 1 Tirol 0,80 0,86 2 1 1 Trentino 0,73 0,75 3 3 0 Alto Adige 0,70 0,68 4 6 2 Valais 0,70 0,74 5 4 1 Valle d'Aosta 0,66 0,72 6 5 1 Zentralschweiz 0,56 0,63 7 7 0 Piemonte 0,52 0,44 8 9 1 Veneto 0,46 0,57 9 8 1
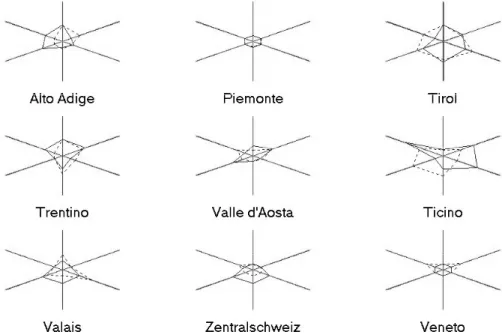
A closer look shows that in some cases a site moves one position in the ranking of average scores on account of larger shifts that are balanced in the relative ranking of the single dimensions. A more accurate comparison was thus undertaken with an analysis including more variables; the star (radar) graphs in figure 2 highlight the strongest dimensions for each site (the dimensions are represented in a clockwise pattern, starting from Identity at the top of the vertical axis). Similar results were also found for the weak areas.
Fig. 2 – Strong points in 2001 (broken lines) and in 2002 (solid lines)
As the graphic shows, the two models divide the sites in a largely coherent and homogeneous manner (see table 4): the only shift regards Veneto and Zentral-switzerland, which moved from a higher group to a lower group respectively, and vice versa. Similar results were found for the weak points.
Table 4 –Strong RTB sites found in the two evaluations
Evaluation 2001 Evaluation 2002
Sites strong in 4 or more
dimensions Tirol and Canton Ticino Tirol and Canton Ticino Sites strong in 2 or 3
dimensions
Trentino, Alto Adige, Veneto, Valais and Valle d’Aosta
Trentino, Alto Adige, Zentralswitzerland, Valais and Valle d’Aosta
Weak sites Piemonte and Zentralswitzerland
Piemonte and Veneto
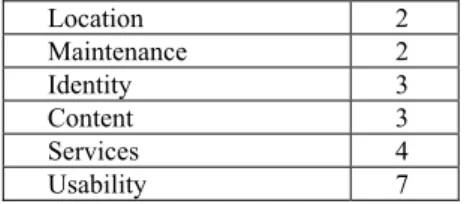
At this time we cannot yet say with certainty how much these results stem from concrete changes to the site (difficult to check) and how much they reflect differences in the information gathered with the two models. Table 5 can help with this point; the type of indications it provides can be useful when making further revisions to the detailed model. To this end, statistical techniques such as correspondence analysis can be applied [5], as well as an analysis of the principal components.
Table 5 – Number of sites that made changes to the different dimensions Location 2 Maintenance 2 Identity 3 Content 3 Services 4 Usability 7
5. Conclusions
Web site quality evaluation presents a number of trade-offs. These are due both to the nature of quality and to the complexity of Web sites. One aspect at the basis of these tradeoffs is represented by the level of detail of the Web site analysis. In fact, it strongly influences both the efforts (cognitive and operative) and the resources (time and finance) needed for the evaluation projects. In this paper we have put forth the 2QCV3Q or 7Loci meta-model as a common conceptual framework that supports the evaluator in finding the "rightweight" quality model, doing so by taking into account the goals of the project. In particular, the comparison of the results of the two studies described here support the hypothesis that it is possible to evaluate Web site quality by adopting an “adaptive” rather than “predictive” method. What’s more, it is possible and efficient to adopt a relatively standard model built around the dimensions of 7Loci – largely domain independent – to identify high performing sites and to rank them. If, on the other hand, the aim is to identify weaknesses in the site and plan its eventual re-design, the 7Loci dimensions can be used to define a more detailed model based on user needs. In summary, the two models have the following characteristics: the first model is general purpose and domain-independent, and consequently more subjective; the second model is much more detailed, requiring more time to set up, also meaning that it can become obsolete sooner; the use of boolean questions however greatly reduces arbitrariness here but requires attention in defining the questions (deciding whether, for example, information on hotels should be classified by category or if a time limit should be set for downloading the home page). The 7Loci meta-model described in this paper provides a flexible general framework for the evaluator to use as a support tool, no matter the depth of analysis.
Acknowledgements We would like to thank the members of the eTourism group and
References
1. Cicero M.T., “De Inventione”, 58 BC, in De Inventione, De Optimo Genere Oratorum, Topica, Vol. 2, Rhetorical Treatises E.H. Warmington (ed.), H.M. Hubbell (translator) Harvard University Press.
2. Elliot S.R., Morup-Petersen A.S., Bjorn-Andersen N., “Towards a framework for evaluation of commercial Web sites”, S. Klein (ed) Proc. 13th Int. Conf. Electronic Commerce, Bled, Slovenia, 19-21 June 2000, pp. 69-86.
3. Fowler M., “The New Methodology”, Software development, December 2002, www.martinfowler.com/articles/newMethodology.html.
4. Franch M., Martini U., Mich L., “The quality of promotional strategies on the Web: the case of Alpine Regional Destination”, in Proc. 7th World Cong. Total Quality Management, Verona, I, 25-27 June 2002, vol. 2: 643-652.
5. Greenacre J.M., Theory and Application of Correspondence Analysis, Academic Press, New York 1984.
6. Insead eLab, Global Internet 100, survey 2000, 2001, elab.insead.edu/pdf/GlobalInternet 100Survey2000.pdf
7. Kotonya G., Sommerville I., Requirements Engineering, Processes and Techniques, Wiley, 1998.
8. Mich L., Franch M., “2QCV2Q: A Model for Web Sites Analysis and Evaluation”, Khosrowpour M. (ed), Proc. IRMA, Anchorage, Alaska, May 21-24, 2000, IDEA, Hershey, PA, 2000, pp. 586-589.
9. Mich L., Franch M., Gaio L., “Evaluating and Designing the Quality of Web Sites”, IEEE Multimedia, Jan-Mar, 2003, pp.34-43.
10. Mich L., Franch M., Cilione G., Marzani P., Tourist Destinations and the Quality of Web Sites: a Study of Regional Tourist Boards in the Alps, to be published in Proc. Enter2003. 11. Morrison A.M.; Taylor S., Morrison A.J., Morrison A. D., “Marketing Small Hotels on the
World Wide Web”, Information Technology and Tourism, Vol.2, 1999, pp.97-113. 12. Olsina L., Rossi G., “Measuring Web Application Quality with WebQEM”, IEEE
Multimedia, October-December 2002, pp. 20-29.
13. Osterweil L.J., Kruchten P., Fowler M., Schäfer W., “Lightweight or Heavyweight Processes: Is This Even the Right Question?”, in Proc. ICSE2002, Orlando, F, ACM Press, p 649, 2002.
14. WerthnerH., KleinS., Information Technology and Tourism. A Challenging Relationship (eds), Springer, Vienna, 1999.
15. Wöber K.W., Scharl A., Natter M., Taudes, “Success Factors of European Hotel Web Sites”, K.W. Wöber, A.J. Frew, M.Hitz (eds.) Proc. Int. Conf. ICT in Tourism, Innsbruck, A, 2002, Springer, pp. 397-406.