- 45 -
Chapter II
Chapter II
Chapter II
Chapter IIIIII
3. Material and Methods 3.1. Experiment rig
The experiment rig consist of one capillary connected to two flow meter: one is for the air and the other for liquid flow. During the experiments the range of flow rate of liquid is between 10-4 m3/s to 10-6 m3/s and the flow rate of air is about 10-3 m3/s .In Fig. 23 is shown the scheme of the used rig.
Fig.23 Scheme of rig
The gravity pump (1) assures the ߂ to the liquid rate and after the liquid goes trought the liquid's flow meter (2) that permits to check the rate. The air comes from the reducer (4) and then it goes trought the air's flow meter(3). Finally the liquid rate and the air rate go inside the
- 46 - A photograph of the Taylor flow apparatus is shown below in Fig. 24.
Fig.24
The equipment consists of:
• Two flows meter Rotameters to monitor the air(fig.25) and liquid (fig.26) flow. The air is supplied via laboratory compressed air and the liquid is supplied from a gravity-fed tank (fig.27). The height of the tank of the pump is 2 meters.
- 47 -
Fig.27 Gravity pump
• The liquid and gas are combined in a tee inlet before entering the capillary. The tee inlet has been developed in a previous study to minimize pulsations because the Y inlet has permitted the liquid entering inside the pipe of air, for details Simmons et al. 2003 paper and Tsoligkas et al. 2007.
- 48 -
Fig.29 Air reducer
• The capillary is supported on a Newport breadboard. The angle of the capillary to the horizontal is adjustable to ensure that the capillary can be positioned perfectly vertically. The liquid leaving the capillary drains into a beaker, with the gas disengaging into the atmosphere. The capillary has a diameter of 3 mm and it’s different from the previous study where it was about 1 mm and the length was 20 cm.
- 49 -
3.2. PIV
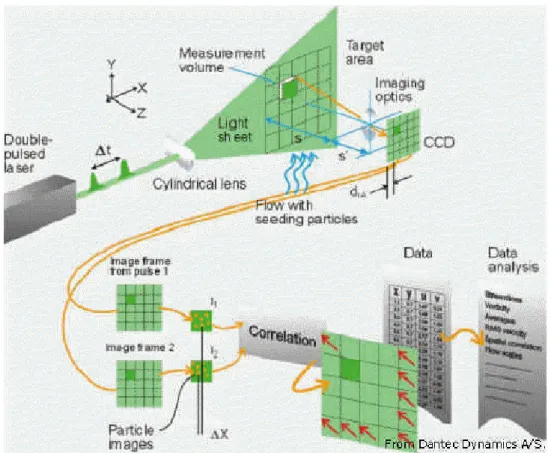
Particle image velocimetry (PIV) is an optical method of fluid visualization. It is used to obtain instantaneous velocity measurements and related properties in fluids. The fluid is seeded with tracer particles which, for the purposes of PIV, are generally assumed to faithfully follow the flow dynamics. It is the motion of these seeding particles that is used to calculate velocity information of the flow being studied. Other techniques used to measure flows are Laser Doppler velocimetry and Hot-wire anemometry.
Fig. 30 schematic functioning of PIV
The main difference between PIV and those techniques is that PIV produces two dimensional vector fields, while the other techniques measure the velocity at a point. During PIV, the particle concentration is such that it is possible to identify individual particles in an image, but not with certainty to track it between images. When the particle concentration is so low that it is possible to follow an individual particle it is called Particle tracking velocimetry, while Laser speckle velocimetry is used for cases where the particle concentration is so high that it is difficult to observe individual particles in an image.
- 50 - Basically a PIV equipment (see Figure 30 ), is composed of a dual head Nd:YAG laser (New Wave Research, Fremont, CA), single frame-straddling CCD (TSI PIVCam 10-30, TSI Inc.) capturing the images, with a resolution of 1024x1024 pixel, a DELL Precision 620 workstation running INSIGHT 5.1 (TSI Inc.) for image processing. In the experiments argued in this work the calibration was 378pixels for 3 mm of diameter. The seeding particles used were hollow 10µm diameter silver coated particles and the synchronizer was a TSI LASERPULSE 610030 (TSI Inc., Shoreview, MN). In the PIV technique, a laser light sheet illuminates a plane of interest within the flow field, which is seeded with suitable tracer particles, often the same as LDA. Usually a dual head pulsed laser is utilized allowing two laser pulses to be emitted separated by a short user-defined time, t (of order 0.1 ms).
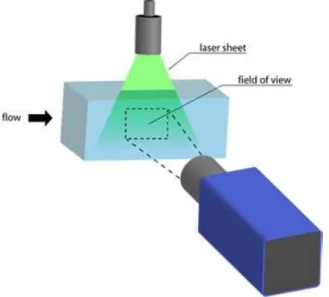
Fig. 31 Layout of PIV equipment
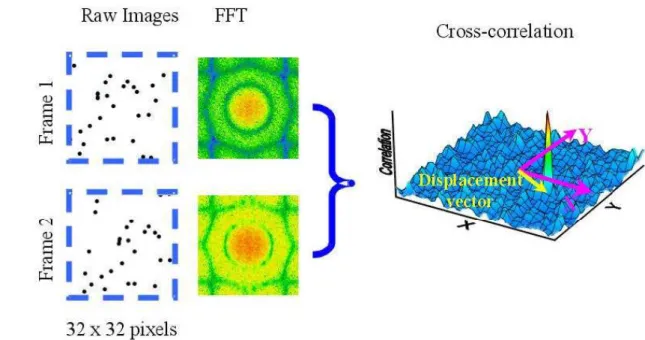
Virtually all modern PIV systems utilize digital cameras to image the illuminated plane of interest and then cross-correlation algorithms are used to determine the particle displacement in time ∂t. For each measurement, images A and B (from each laser pulse pair) are separately stored on the camera sensor. The series of double frame images are continuously downloaded to a PC where they are then stored for analysis. Each image frame is discredited into a regular grid of square interrogation cells, which are typically 32 × 32 pixels. Therefore, for calculation purposes, the image consists of a grid of smaller interrogation cells. To ensure a good Signal to noise ratio (SNR) the particles inside each interrogation area, should be around 5 (Raffel et al.., 1998). The frames are split into a large number of interrogation areas, or windows. It is then possible to calculate a displacement vector for each window with help of signal processing and autocorrelation or cross-correlation techniques. This is converted to a velocity using the time between laser shots and the physical size of each pixel on the camera. The size of the interrogation window should be chosen to have at least 6 particles per window on average. The synchronizer
- 51 - controls the timing between image exposures and also permits image pairs to be acquired at various times along the flow. The two-frame cross-correlation technique is superior to auto correlation methods, having the best signal to noise ratio, no directional ambiguity and the ability to measure zero velocity (Raffle et al., 1998).
Fig. 22 Schematic representation of the cross – correlation
For the PIV to give the best result, is necessary that the duration of the light pulse is short enough to capture a neat image of the particles, but is more important to regulate the time ∂t from two different pulses, in order to have a clear displacement of particles between two images. Time intervals too large increase the possibility that the particles leave the selected space. At the same time an interval too short reduces the actual resolution of the measurement. The cross correlation is then performed for a set of two images, taken at known ∂t, assigning to every interrogation window, the relative displacement vector (Keane and Adrian, 1990). The spatial resolution of this technique depends on the size of the selected space in which, the flow field has been divided. Assigning a velocity vector for each interrogation area, a Sub-grid filtering is actually applied; the vector field is determined by locating the centric of the tallest correlation peak in the cross-correlation plane of images. During the experiments the laser was positioned perpendicular to the capillary and the camera of PIV in front of the capillary.
- 52 -
Fig33 Setup capture images
For accurate PIV analysis, it is ideal that the region of the flow that is of interest should display an average particle displacement of about 8 pixels. This is a compromise between a longer time spacing which would allow the particles to travel further between frames, making it harder to identify which interrogation window travelled to which point, and a shorter time spacing, which could make it overly difficult to identify any displacement within the flow. The scattered light from each particle should be in the region of 2 to 4 pixels across on the image. If too large an area is recorded, particle image size drops and peak locking might occur with loss of sub pixel precision. There are methods to overcome the peak-locking effect, but they require some additional work. If there is in house PIV expertise and time to develop a system, even though it is not trivial, it is possible to build a custom PIV system. Research grade PIV systems do, however, have high power lasers and high end camera specifications for being able to take measurements with the broadest spectrum of experiments required in research. If, for example, you want to spend less money, of course you get less resolution and lower frame rates.
- 53 -
Fig.34 Laser energy setup
There are also PIV analysis software available in the open source community. The results can have similar or even better quality compared to the expensive commercial PIV systems. Commercial timing electronics come in varying resolutions. For macro PIV setups, lasers are predominant due to their ability to produce high-power light beams with short pulse durations (Fig.34). This yields short exposure times for each frame. Nd:YAG lasers, commonly used in PIV setups, emit primarily at 1064 nm wavelength and its harmonics (532, 266, etc.) For safety reasons, the laser emission is typically bandpass filtered to isolate the 532 nm harmonics (this is green light, the only harmonic able to be seen by the naked eye). A fibre optic cable or liquid light guide might be used to direct the laser light to the experimental setup. The optics consist of a spherical lens and cylindrical lens combination. The cylindrical lens expands the laser into a plane while the spherical lens compresses the plane into a thin sheet. This is critical as the PIV technique cannot generally measure motion normal to the laser sheet and so ideally this is eliminated by maintaining an entirely 2-dimensional laser sheet. It should be noted though that the spherical lens cannot compress the laser sheet into an actual 2-dimensional plane. The minimum thickness is on the order of the wavelength of the laser light and occurs at a finite distance from the optics setup (the focal point of the spherical lens). This is the ideal location to place the analysis area of the experiment. The correct lens for the camera should also be selected to properly focus on and visualize the particles within the investigation area. To perform PIV analysis on the flow, two exposures of laser light are required upon the camera from the flow. Originally, with the inability of cameras to capture multiple frames at high speeds, both exposures were captured on the same frame and this single frame was used to determine the flow. A process called autocorrelation was used for this analysis. However, as a result of autocorrelation the direction of the flow becomes unclear, as it is not clear which particle spots are from the first pulse and which are from the second pulse. Faster digital cameras using CCD chips were developed since then that can capture two frames at high speed with a few hundred ns difference between the frames. This has allowed each exposure to be isolated on its own frame for more accurate
cross-- 54 cross-- correlation analysis. The limitation of typical cameras is that this fast speed is limited to a pair of shots. This is because each pair of shots must be transferred to the computer before another pair of shots can be taken. Typical cameras can only take a pair of shots at a much slower speed. High speed CCD cameras are available but are much more expensive. The camera was mounted on a computer controlled traverse, able of controlling movements of the order of 0.5 mm. The frame capture delay ∆t was chosen in function of the maximum displacement that a particle could travel in the interrogation window. ∆t was calculated as follows:
∆t=ଶ
Where U is the velocity of flow: U=ሺ ୕ైା୕ృሻ
π
ర ୈమ
where Q is the volume flow rate of liquid and gas and D is the diameter of capillary. In figure xx the input of timing setup.
Fig.35 Timing setup
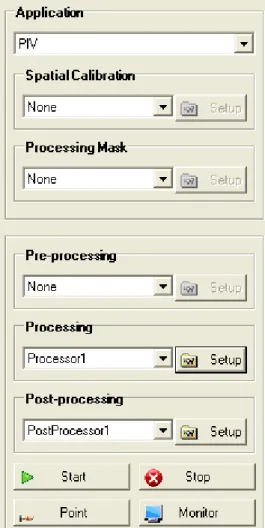
Typically, the raw PIV data obtained from the cross-correlation of two images need to be validated and optionally smoothed before statistical values are calculated or various derived quantities are computed. Below the inputs of program’s processing of PIV are shown:
- 55 -
Fig 36 Setup program after capture
- 56 -
3.3. HSV
The equipment of High Speed Video camera consist of two parts: the camera can film up to 250,000 frames/. The second part is the detector (Fig.38) that records the frames and it connects the computer with the camera.
Fig.38 detector
- 57 -
3.4. Malvern Mastersizer
The Mastersizer measures particle diameters from 0.02 to 2000 microns (dependent on the dispersion accessory). Two dispersion accessories at a time can be connected to the optical unit. Each dispersion accessory is provided with a coded measurement cell cassette. When a cell is inserted into the optical unit it is automatically recognized by the system which configures itself to operate with the dispersion accessory. The cell is fitted with a laser safety shutter override and a half-turn locking mechanism locks the cell into the correct location with a single action.
Fig.40 Mastersizer
The system is designed to be operated using Standard Operating Procedures (SOPs) to give consistent results between laboratories and individual users. The current range of dispersion accessories allows the measurement of wet and dry suspended samples. Two measurement modes of operation are provided, Manual and Automatic. Manual measurement mode is designed to enable the user to explore the full range of options available and to carry out tests to aid Method Development and the creation of SOPs. Automatic measurement mode (SOP) provides the user with a consistent measurement framework to enable comparable results to be obtained with the minimum of training. Comprehensive help and advice pages are provided at all stages in the performance of manual measurements and the creation of SOPs. SOP stands for Standard Operating Procedure. Although these are widely used in the pharmaceutical industry to provide traceability of methods they also provide the non-pharmaceutical user with a reliable means of
- 58 - automating a measurement to ensure that a wide selection of personnel can obtain consistent results regardless of their training and familiarity with the instrument. The quality and value of a good SOP depends on the quality of the method development work on which it is based. A good series of manual measurements to establish the ideal parameters to be encapsulated in an SOP will always give better results than a series of arbitrary values based on guesswork. However, the Malvern software provides a powerful SOP editing facility which enables users to review and refine SOPs as required and this should be regarded as an ongoing process.
3.5. Rheology and surface tension equipment
3.5.1.Rheometer
The rheometers are designed to fulfill the requirements of measurement as implied by full meaning of the term rheology defined as the study of the deformation and flow of matter. Deformation is measured in the non-destructive region of elastic or visco-elastic deformation. This can give invaluable information concerning the microscopic interactions in the test material, as well as measuring the shear stress/shear rate relationships at higher stresses. In the controlled-stress technique, the stress can be applied and released at will, and the actual behaviour of the sample can be measured directly. This is not usually possible with conventional controlled-shear rate
instruments. In addition, most real life situations can be simulated more accurately using controlled stress measurements.
- 59 -
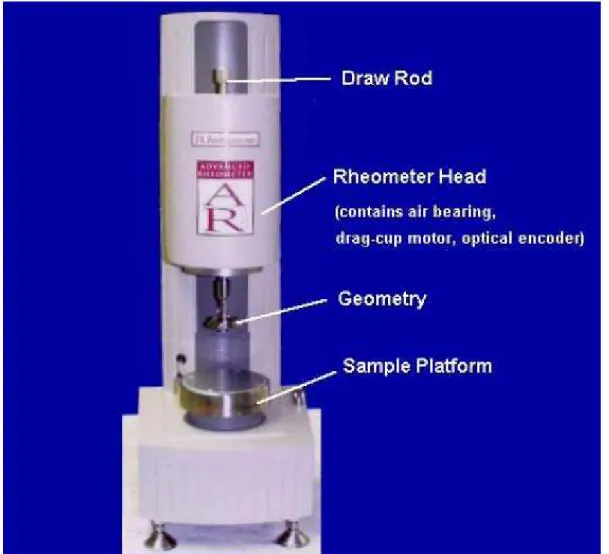
Fig 41 Shows a schematic of the front of the rheometer
The instrument consists of a main unit mounted on a cast metal stand with the electronics control box. The rheometer contains an electronically controlled induction motor with an air bearing support for all the rotating parts. The drive motor is equipped with a hollow spindle, with a detachable draw rod inserted through it. The draw rod has a screw threaded section at the bottom, which allows the geometry to be securely attached. The measurement of angular displacement is done by an optical encoder device. This can detect very small movements down to 0.6µrad. The encoder consists of a non contacting light source and photo cell, arranged either side of a transparent disc attached to the drive shaft. On the edge of this disc are extremely fine, accurate photographically etched radial lines. Therefore, this is a diffraction grating. There is also a stationary segment of a similar disc between the light source and encoder disc. The interaction of these two disc results in diffraction patterns that are detected by the photo cell. As the encoder disc moves when the sample strains under stress, these patterns change. The associated circuitry interpolates and digitizes the resulting signal to produce digital data. This data is directly related to
- 60 - the angular deflection of the disc, and , therefore, the strain of the sample. The main electronics are housed in a separate control box. Temperature control is achieved in the standard configuration via a Peltier plate system.
- 61 -
3.5.2.Tension balance
The torsion balance consists of a bar suspended from its middle by a thin fibre. The fibre acts as a very weak torsion spring. If an unknown force is applied at right angles to the ends of the bar, the bar will rotate, twisting the fibre, until it reaches an equilibrium where the twisting force or torque of the fibre balances the applied force. Then the magnitude of the force is proportional to the angle of the bar. The sensitivity of the instrument comes from the weak spring constant of the fibre, so a very weak force causes a large rotation of the bar.