CHAPTER 4
A route to metallacrowns: Fe(III) and its complexation by
salicylhydroxamic and benzohydroxamic acid
Iron is an essential element in all organisms but its supply is restricted by its extreme insolubility under physiological conditions. For this reason, microorganisms produce low molecular weight chelating agents, called siderophores, that can solubilize iron from the environment by complexing and transporting it into the cells (Neilands, 1976). An important structural feature of many siderophores is the incorporation of hydroxamate groups, which are capable of selectively binding Fe(III) in the presence of other biologically important metal ions. Actually, both natural and sintetic hydroxamic acids are able to coordinate Fe(III) with very high affinity (Albrecht-Gary and Crumbliss, 1998; Santos et al., 1998), giving rise to simple complexes or also to self-assembled macromolecules, as metallacrowns.
Salicylhydroxamic acid (SHA), in conjunction with highly charged metal ions as Fe(III), is well suited to the synthesis of metallacrowns, because of its ability to act as a ditopic ligand. SHA can, in principle, bind two Fe(III) ions, giving rise to a dinuclear, fully deprotonated complex which will constitute the basic unit of a SHA based metallacrown (Pecoraro et al., 1996). The structure of such a precursor complex was hypothesized by Pecoraro et al. (Pecoraro et al., 1996; Mezei et al., 2007), but never isolated. Actually, the experimental evidence so far available on M2+
/SHA systems denies full deprotonation and formation of 2:1 complexes of SHA. As shown in the previous chapter, it has been observed that the divalent Ni(II) forms with SHA only mononuclear complexes where the N-H proton remains bound to the nitrogen atom, irrespective of the strong polarization effect induced by the divalent metal ion bound at the hydroxamate O,O site.
In this chapter a kinetic, thermodynamic and infrared spectroscopic investigation of the binding of Fe(III) to SHA is presented. For control purposes, the same study has been carried out also for the system Fe(III)/benzohydroxamic acid, BHA (Scheme 1.1 of Chapter 1). The obtained results show that the final product of the reaction corresponds to a complex as that depicted in Scheme 4.1; the thermodynamic and kinetic features of the process leading to formation of this complex have been worked out.
thermodynamic and kinetic behaviors of solutions of Fe(ClO4)3 have been investigated at different HClO4 concentrations in order to better understand the mechanism of the metal-ligand binding reaction, which is coupled to metal hydrolysis and self-aggregation processes.
Scheme 4.1 The structure assumed for the dinuclear complex of SHA that can represent
the repetitive unit of a SHA based metallacrown.
4.1 Fe(III) hydrolysis and self-aggregation equilibria
The processes of Fe(III) hydrolysis and self-aggregation in aqueous solution have been investigated by UV/VIS spectrophotometry, at I = 1 M (NaClO4) and at [H+
] values between 0.01 M and 1 M (HClO4). Lower acid concentrations have not been used, in order to avoid precipitation of Fe(OH)3. The spectrum of Fe(ClO4)3 in 1 M HClO4 displays a band centred at 240 nm whose intensity becomes negligible at values of λ higher than 300nm (Figure 4.1A). The maximum intensity does not display any horizontal shift on changing the Fe(ClO4)3 concentration and a plot of the absorbance at 240 nm vs Fe(III) concentration (Figure 4.1B) yields a straight line; both observations indicate that the only species present at [H+
] = 1 M is Fe(H2O)63+ .
Figure 4.1 (A) UV-visible spectra of Fe(ClO4)3; (B) Absorbance dependence on CM at λ =
240 nm. [H+ ] = 1 M, [Fe(ClO4)3]= 1.4×10 -5 to 2.7×10⁻³ M; I = 1 M (HClO4), T = 298K.
Figure 4.2A shows the spectrum of Fe(ClO4)3 at different concentrations, recorded at [H +] = 0.01 M. In this case, the absorption band moves towards higher wavelengths (a shoulder between 450 and 500 nm can be observed) and the Beer-Lambert law is not longer obeyed (Figure 4.2B), revealing the presence of more than a single species in solution and related equilibrium processes.
Figure 4.2 (A) UV-visible spectra of Fe(ClO4)3; (B) Absorbance dependence on CM at λ =
240 nm. [H+] = 1.2×10⁻² M, [Fe(ClO
4)3] = 1.4×10
-5 to 4.4×10⁻³ M; I = 1 M (NaClO 4),
T = 298 K.
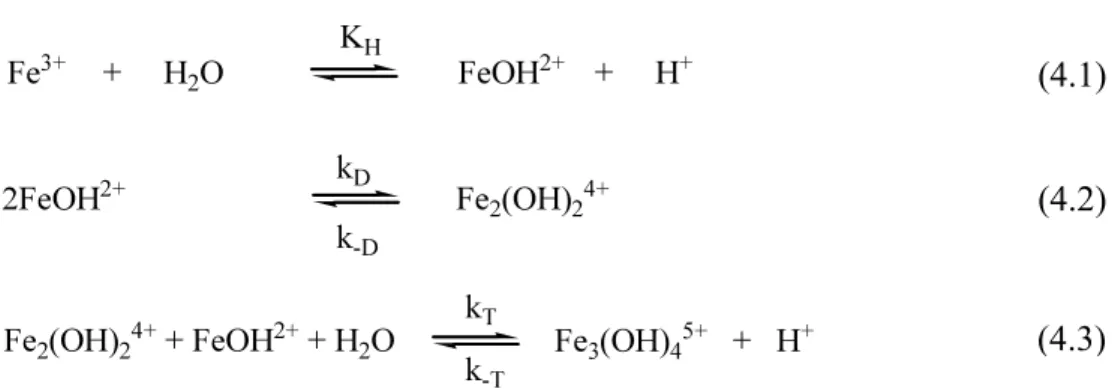
The equilibria between the species are originated by hydrolysis and self-aggregation processes, which have been analyzed on the basis of the reaction Scheme 4.2. Reactions (4.1)-(4.3) are suggested by the results of the kinetic experiments described below.
(A) (B)
Scheme 4.2 Reactions involved in Fe(III) hydrolysis and aggregation processes.
Concerning the analysis of the static measurements of the equilibria (4.1)-(4.3), the absorbance of solutions of Fe(ClO4)3 was measured at different metal and acid concentrations and the data have been analysed using a multivariate non-linear least square treatment, as described in Appendix V. The values of KH, KD = kD/k-D, and KT = kT/k-T obtained by such an analysis are reported in Table 4..
Table 4.1 Reaction parameters for hydrolysis and self-aggregation reactions of Fe(III);
I = 1 M (HClO4/NaClO4), T = 298 K. 103 KH 10-3 KD 10-1 KT 10-3 kD k-D 10-1 kT k-T kDʹ′ a k-Dʹ′ a (M) (M-1 ) (M-1 ) (M-1 s-1 ) (s-1 ) (M-1 s-1 ) (s-1 ) (M-1 s-1 ) (s-1 ) 1.9 2.3 4.9 b 1.5 b 0.56 c 4.3 c 1.1 65 0.030 c 1.3 a
rate parameters for reaction (4.5).
b from kinetics at [H+] = 0.1 M. c from kinetics at [H+] = 0.01 M. (4.1) (4.2) (4.3)
4.2 Fe(III) hydrolysis and self-aggregation kinetics
Kinetics of the system (4.1)–(4.3) have been investigated using the stopped-flow technique. The experiments have been performed in the concentration-jump mode by mixing a given volume of a Fe(ClO4)3 solution, brought at the desired pH and ionic strength value, with an equal volume of water brought to the same pH and ionic strength value. Reaction (4.1) of Scheme 4.2 involves the proton loss/acquisition from a water molecule coordinated to Fe(III); this process is very fast and its rate cannot be measured by the stopped-flow technique; the kinetic effects measured should be thus related to the self-aggregation steps (4.2) and (4.3) of Scheme 4.2. Experiments at [H+
] = 1 M do not show any kinetic effect. Actually, according to the equilibrium data of Table 4.1 it can be deduced that, at [H+
] = 1 M, the species by far prevailing is the Fe3+
ion. On the other hand, stopped-flow experiments performed at [H+
] = 0.1 M give rise to monoexponential kinetic curves (Figure 4.3A), revealing the occurrence of a single kinetic effect.
The dependence of the time constant 1/τ on [Fe(ClO4)3], at this acidity value, is linear. The dynamic behavior of the system can be rationalized taking into account steps (4.1) and (4.2) of the reaction Scheme 4.2. At this level of the analysis step (4.3) can be neglected, as the equilibrium data of Table 4.1 show that, at [H+
] = 0.1 M, the trimer concentration is very small. Reaction (4.1) can be always considered equilibrated, as it is much faster than reaction (4.2). Under these circumstances the concentration dependence of the reciprocal relaxation time can be described by equation (4.4)
1/τf = 4 KH kD [FeOH2+ ]/([H+
] + KH) + k−D (4.4)
where [FeOH2+
] has been evaluated from CM, the analytical Fe(III) concentration, using the relationship [FeOH2+
] = αFeOH CM. The molar fraction of FeOH, αFeOH, is evaluated as described in Appendix V. The plot of 1/τf vs [FeOH2+
]/([H+
]+KH) is linear (insert of Figure 4.3A) and allows to obtain the values of kD and k−D as the slope and the intercept of the
Figure 4.3 Stopped-flow experiments showing the kinetic behavior of Fe(ClO4)3 solutions
upon dilution jumps at I = 1 M (HClO4/NaClO4) and T = 298 K: (A) CM = 0.11 M, [H +
] = 0.1 M; (B) CM = 0.036 M, [H
+
] = 0.01 M. Note that while curve (A) is perfectly monoexponential, curve (B) deviates from the monoexponential behavior shown by the continuous line. Inset: plot of the kinetic data according to equation (4.4).
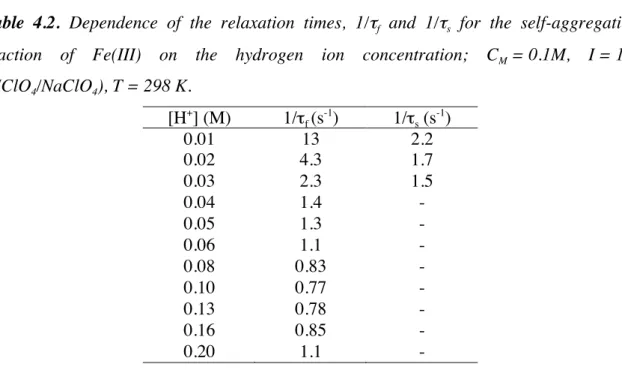
Table 4.2 shows that the values of 1/τf decrease on rising the proton level up to [H+ ] = 0.1 M and then exhibit a small but well defined increase for 0.1 M ≤ [H+
] ≤ 0.2 M. This behavior reveals that a further reaction step (step (4.5)), competes with step (4.2) for the formation of the dimer.
k’D FeOH2+ + Fe3+ ⇄ Fe2(OH)2 4+ + H+ (4.5) k’−D
This process becomes more important at the highest investigated acidities, where the ratio [Fe3+
]/[FeOH2+
] becomes high and where H3O+
can actively compete with H2O to attack the dimer, thus favoring its decomposition into monomers.
Table 4.2. Dependence of the relaxation times, 1/τf and 1/τs for the self-aggregation
reaction of Fe(III) on the hydrogen ion concentration; CM = 0.1M, I = 1M
(HClO4/NaClO4), T = 298 K. [H+] (M) 1/τf (s-1) 1/τs (s-1) 0.01 13 2.2 0.02 4.3 1.7 0.03 2.3 1.5 0.04 1.4 - 0.05 1.3 - 0.06 1.1 - 0.08 0.83 - 0.10 0.77 - 0.13 0.78 - 0.16 0.85 - 0.20 1.1 -
Taking into account also reaction (4.5), the fast effect time constant dependence on [H+ ] turns into equation (4.6)
1/τf =4(kD + k’D[H+ ]/KH)(KH/([H+ ] + KH))[FeOH2+ ]+(k−D + k’−D[H + ]) (4.6)
An estimation of k’D and k’−D (Table 4.1) has been done by applying a statistical treatment
to equation (4.6) imposing to KH, kD and k−D the values previously obtained.
Experiments performed at [H+
] = 0.01 M give, instead, biexponential kinetic curves (Figure 4.3B). The change of behavior should be ascribed to the involvement of step (4.3) that, at this lower acidity level gives a considerable contribution to the observed kinetics. In this case the fast relaxation step could not be analyzed as a fast equilibrium not affected by the slow effect, because the two effects (steps (4.2) and (4.3)) are poorly separated in the time scale and influence each other. Therefore a full kinetic analysis of coupled reactions was applied to the Scheme 4.2. The Castellan’s method (Castellan, 1963) was employed, which makes use of the exchange rates to obtain the concentration dependencies of fast (1/τf) and slow (1/τs) relaxation times (see Appendix VI). The rate constant of steps (4.2) and (4.3) have been evaluated by combining them as shown in equations (4.7) and (4.8), according to a procedure developed in our laboratory (D'Amico et al., 2002) which has been adapted to the present system (see Appendix VI).
1/τf × 1/τs = 6χDχT CM 2 + 4χ
Dχ−T CM + χ−Dχ−T (4.8)
where χD, χT, χ−D and χ−T are apparent rate parameters linked to the individual rate constants
of steps (4.2) and (4.3) as shown below. A plot according to equation (4.7) is shown in Figure 4.4A. The slope and intercept of the straight line interpolating the data points provide 4χD + χT = (139 ± 2) M−1s−1andχ
−D + χ−T = (1.7 ± 0.2) s−
1
respectively. On the other hand, the parabolic function represented in Figure 4.4B, which corresponds to equation (4.8), enables us to obtain the parameters 6χDχT = (1.4 ± 0.1)×10
3 M−2s−2, 4χ Dχ−T= (1.4 ± 2)×102 M−1s−2andχ −Dχ−T= (1 ± 0.7)s− 2
.Combination of these parameters yields the apparent rate constants, which are linked to the individual rate constant of Scheme 4.2 by the relationships kD = χDKH 2/(K H + [H +])2, k T = χTKH/(KH + [H +]), k −D =χ−D and k−T = χ−T/[H +]. The rate constants evaluated at [H+] = 0.01 M are reported in Table 4.1.
Figure 4.4 Dependence 1/τf + 1/τs (A) and 1/τf × 1/τs (B) on CM at [H +
] = 0.01 M, I = 1 M (HClO4/NaClO4), T = 298 K.
Special attention has been paid to the characteristic of the reverse reaction of step (4.3) since in literature two different formulas, Fe3(OH)4
5+
and Fe3(OH)3 6+
, have been proposed for the trimer (Sommer and Margerum, 1970).
If the trimer structure had corresponded to the formula Fe3(OH)3
6+, its formation from dimer and FeOH2+
would not involve any loss of protons, thus the reverse step would be independent of the hydrogen ion concentration. On the contrary, formation of Fe3(OH)45+ should involve the loss of a proton with a consequent dependence of the reverse step on [H+
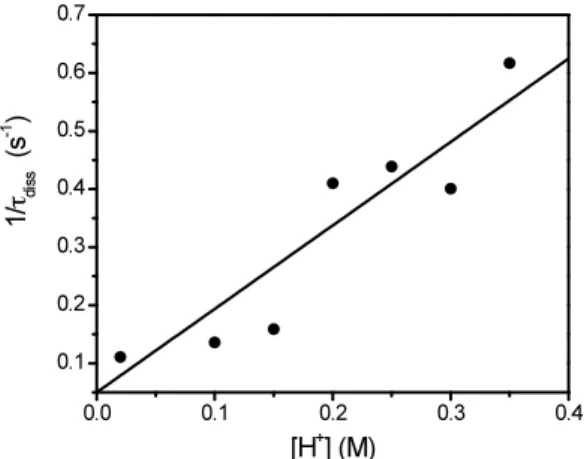
]. In order to clarify this point a series of experiments was devised where a solution containing the preformed trimer was mixed with given amounts of HClO4 and the time constant of the trimer decomposition, 1/τdiss, has been measured for each [H+] value. The rate constant 1/τdiss resulted to be directly proportional to [H+] (Figure 4.5), thus indicating that the main trimer formed is Fe3(OH)45+
.
Figure 4.5 Dependence of the rate constant of trimer decomposition on the hydrogen ion
concentration; I = 1 M (HClO4/NaClO4), T = 298 K.
Beside the above-described kinetic processes, a very slow reaction was detected in the time scale of hours (Figure 4.6). This reaction, whose time path was monitored by classical spectrophotometry, is ascribed to formation of more complex Fe(III) aggregates, and was not further investigated.
Figure 4.6 Kinetic trace recorded by spectrophotometric measurements for Fe(III). CM =
2×10⁻⁴
M, λ = 532 nm, [H+
] = 0.1 M, I = 1 M (HClO4/NaClO4) and T = 298 K.
4.3 Formation equilibria of the Fe(III)/BHA and Fe(III)/SHA complexes
The equilibria of the interaction of Fe(III) with BHA and SHA have been investigated by spectrophotometric titrations at I = 1 M (NaClO4) in the acidity range 0.01 M ≤ [HClO4] ≤ 1 M. All titrations were performed under conditions of metal excess in order to exclude formation of complexes as ML2 or ML3.
4.3.1 The Fe(III)/BHA system
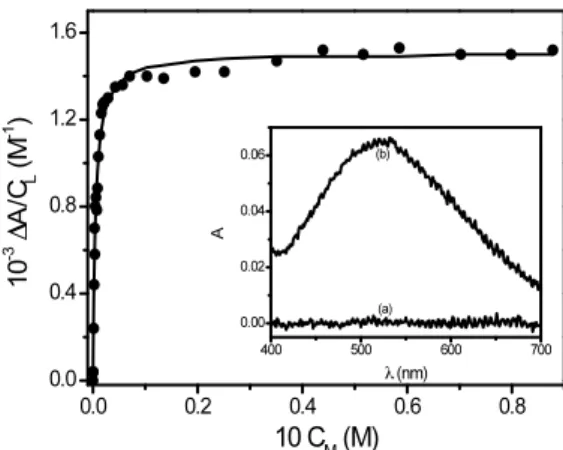
Titrations of BHA with Fe(III) provide monophasic binding isotherms (Figure 4.7), which represent the formation of a 1:1 complex (MLT), according to the apparent reaction (4.9)
K1app
Mf + Lf ⇄ MLT (4.9)
Figure 4.7 Binding isotherm for the interaction of Fe(III) with BHA at I = 1 M
(HClO4/NaClO4) and T = 298 K. Inset shows the spectral change induced by complex
formation; [BHA] = 2.5×10⁻⁴ M, [H+] = 0.1 M, inset: (a) C
M = 0 M, (b) CM = 1.7×10 -1 M.
The binding isotherms have been analyzed according to equation (4.10)
ΔA/CL = Δε K1app CM/(1 + K1app CM) (4.10)
where ΔA = (A − A0), Δε = (εML −εL − εM) and K1app is the equilibrium constant of the apparent reaction (4.9). The dependence of K1app on [H
+
] displays the rather unusual behavior shown in Figure 4.8.
Figure 4.8 Dependence of the apparent binding constant, K1app, for the Fe(III)/BHA system
on [H+
] at I = 1 M (HClO4/NaClO4) and T = 298 K. Inset: dependence of K1app on αFeOH,
the molar fraction of FeOH2+
coupling between the processes of complex formation and the processes of hydrolysis and aggregation of Fe(III). At [H+
] values lower than 0.025 M dimer and trimer formation subtract metal to complexation, so K1app decreases as [H+
] tends to zero. At the highest [H+ ] values complex formation is also hindered because the concentration of the reactive species of the metal, FeOH2+
, is reduced. Moreover, for [H+
] ≥ 1M, BHA tends to form the species BHAH+
(Garcia et al., 2001), which is reluctant to bind the metal. As a result, the dependence of K1app on [H
+
] exhibits a maximum. On the basis of the reaction Scheme 4.2 the [H+] dependence of K
1app is given by equation (4.11)
K1app = αFeOH KML (4.11)
where KML is the equilibrium constant of reaction (4.12). KML
FeOH2+
+ H2L ⇄ FeHL2+
+ H2O (4.12)
A plot of K1app vs αFeOH according to equation (4.11) yields a straight line (insert of Figure 4.8) whose slope provides the value of KML reported in Table 4.3.
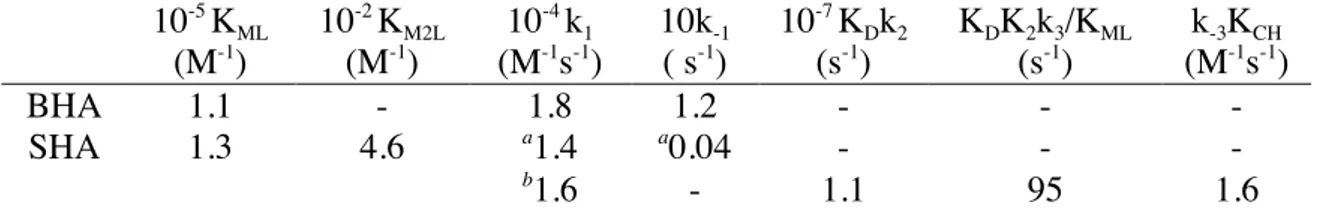
Table 4.3 Reaction parameters for complex formation reactions of Fe(III) with BHA and
SHA; I = 1 M (HClO4/NaClO4), T = 298 K. 10-5 KML 10-2 KM2L 10-4 k1 10k-1 10-7 KDk2 KDK2k3/KML k-3KCH (M-1) (M-1) (M-1s-1) ( s-1) (s-1) (s-1) (M-1s-1) BHA 1.1 - 1.8 1.2 - - - a 1.4 a 0.04 - - - SHA 1.3 4.6 b 1.6 - 1.1 95 1.6
4.3.2 The Fe(III)/SHA system
The thermodynamic study of the Fe(III)/SHA system reveals two different behaviors depending on the medium acidity. For high [H+
] values the binding isotherms are monophasic as those obtained for the Fe(III)/BHA system while for lower [H+
] values they become biphasic (Figure 4.9), indicating that, under these circumstances, a further binding step becomes operative.
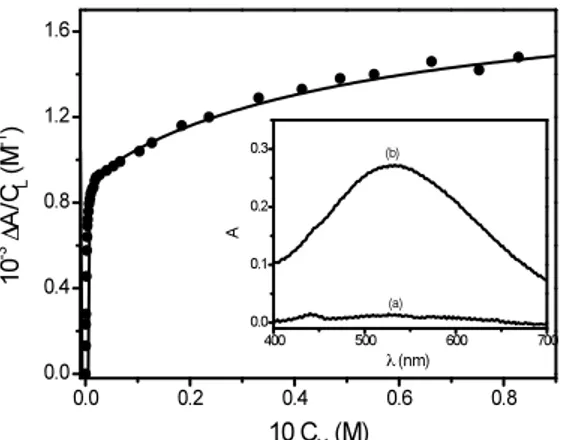
Figure 4.9 Binding isotherms for the interaction of Fe(III) with SHA at I=1 M
(HClO4/NaClO4) and T = 298 K. Inset shows the spectral change induced by complex
formation; [SHA] = 2.5×10⁻⁴ M, [H+ ] = 0.022 M, inset: (a) CM = 0 M, (b) CM = 1.7×10⁻¹ M.
Therefore, formation of a dinuclear complex has been supposed, according to equation (4.13). KM2L FeH2L 2+ + FeOH2+ ⇄ Fe 2L 3+ + H 3O + (4.13)
Titration curves have been analyzed using equation (4.14) (Rossotti and Rossotti, 1961).
ΔA/CL= (Δε1 K1app CM +Δε2 K1app K2app CM2
)/(1+K1app CM + K1app K2app CM2
) (4.14)
where Δε1 = (εMLT − εLf − εMf), Δε2 = (εM2LT − εLf − εMf), and K2app is the equilibrium constant for formation of M2LT from reaction of MLT with Mf. Note that, in the case of monophasic behavior, equation (4.14) is reduced to equation (4.10).
The values of both K1app and K2app depend on [H+
] as shown in Figure 4.10A and 4.10B, respectively.
Figure 4.10 Dependence of the apparent binding constants, K1app and K2app, for the
Fe(III)/SHA system on [H+
] at I = 1 M (HClO4/NaClO4) and T = 298 K; (A) plot of K1app vs
[H+], inset: dependence of K
1app on αFeOH. (B) plot of K2app vs [H
+], inset: dependence of
[H+
]×K2app on αFeOH.
The trend of K1app is similar to that observed for the Fe(III)/BHA system and has been analyzed using equation (4.11), being now KML = [FeH2L
2+
]/[FeOH2+
][H3L], while the trend of K2app has been analyzed using the equation (4.15)
K2app = KM2L αFeOH /[H+
] (4.15)
A plot of [H+
]×K2app vs αFeOH yields the value of KM2L, the equilibrium constant of reaction (4.13). The values of KML and KM2L are reported in Table 4.4.
4.4 Fe(III)/BHA and Fe(III)/SHA complexes formation kinetics
The kinetics of Fe(III) binding to BHA and SHA have been investigated under pseudo-first order conditions (CM/CL ≥ 10) using the stopped-flow method. For both systems coupling of complex formation with Fe(III) hydrolysis and self-aggregation processes has been taken into account.
4.4.1 The Fe(III)/BHA system
The kinetic traces obtained for the binding of Fe(III) to BHA are monoexponential (Figure 4.11) and the dependence of 1/τ on CM is linear (Figure 4.12) in the range of [H+
] concentration between 0.1 M and 1 M.
Figure 4.11 Stopped-flow traces recorded at λ = 520 nm upon mixing BHA 2.5×10⁻⁴
M and Fe(ClO4)3 9.0×10
-3 M at I = 1 M (HClO
4/NaClO4) and T = 298 K.
The rate of reaction largely increases on reducing [H+
] from 1 M to 0.1 M, in parallel with the increase of [FeOH2+
] induced by the [H+
] reduction. This observation indicates that FeOH2+
is the reactive species, while the hexa-aquoion Fe3+
, although present in large excess at both acidity levels, reacts with BHA to a negligible extent. It can be assumed, therefore, that, in the case of BHA, the prevailing binding step is represented by reaction (4.12).
Taking into account that reaction (4.12) is coupled to the hydrolysis and self-aggregation steps through the common species FeOH2+
and that [Mf] ≈ CM, the concentration dependence of the relaxation time of the complex formation reaction is given by the relationship (4.16) where αFeOHCM = [FeOH
2+ ].
1/τ = k1 αFeOH CM + k−1 (4.16)
Equation (4.16) also explains the kinetic behavior of the system at [H+
] = 0.01M. Here, a descending deviation from linearity can be observed in the plot of 1/τ vs CM (Figure 4.12).
Figure 4.12 Dependence of 1/τ on CM at different [H +
] values for the Fe(III)/BHA system at I = 1 M (HClO4/NaClO4) and T = 298 K; [BHA] = 2.5×10
-4
M, [H+
] =1 M , 0.1 M
, 0.01 M . The inset represents the dependence of 1/τ on [FeOH2+
], calculated at all acidities by the relationship [FeOH2+
] = aFeOH CM.
Such a deviation depends on the behavior of αFeOH that, at [H+] = 0.01M, decreases as the metal ion content is raised, owing to the self-aggregation steps, which become more important and subtract the reactive species FeOH2+
to the binding process. When considering, instead, a plot of 1/τ vs [FeOH2+
] = αFeOH CM (insert of Figure 4.12), all data points lie on a single straight line according to equation (4.16), which provides the values of k1 and k−1 collected in Table 4.4.
4.4.2 The Fe(III)/SHA system
For this system kinetics are still monoexponential at [H+] = 1.0 M, provided that CM ≤ 0.04 M (Figure 4.13A).
Figure 4.13 Stopped-flow traces recorded at λ = 532 nm upon mixing SHA 2.5×10⁻⁴
M and Fe(ClO4)3 9.0×10
-3
M at I = 1 M (HClO4/NaClO4) and T = 298 K; (A) [H +
] = 1.0 M (monoexponential trace), (B) [H+
] = 0.01 M (biexponential trace). The inset shows the slowest of the two effects on a magnified scale.
In these conditions the metal concentration dependence of the relaxation time is linear (Figure 4.14A), as for the system Fe(III)/BHA. Hence, the observed kinetic effect is ascribed, also in this case, to formation of a mononuclear complex between Fe(III) and SHA.
The behavior becomes more complex at [H+] = 0.1 M and even more at [H+] = 0.01 M (Figure 4.13B). Actually, the system displays now two kinetic effects, in contrast with the behavior of the Fe/BHA system where, under similar conditions, simple kinetics have been observed. The metal concentration dependence of the faster effect is parabolic (Figure 4.14B), revealing a second-order dependence of the corresponding binding step with respect to the metal ion. On the other hand, the rate constant of the slow kinetic effect displays a linear dependence on [FeOH2+] (Figure 4.14C).
The kinetic features of the Fe(III)/SHA system can be rationalized on the basis of the reaction Scheme 4.4 where H3L denotes the uncharged triprotonated SHA molecule.
Figure 4.14 Dependence of the relaxation time on [FeOH2+
]for the Fe(III)/SHA system under different acidity conditions at I = 1 M (HClO4/NaClO4) and T = 298 K; (A) [H
+
] = 1.0 M; (B) [H+] = 0.1 M (fast effect); (C) [H+] = 0.1 M (slow effect).
Scheme 4.4 Reaction scheme for Fe(III) complexation with SHA.
(4.17)
(4.19) (4.18)
Since the two kinetic effects are widely separated in the time scale, the fast step has been analyzed separately from the slow one, while, in the analysis of the slow effect, reactions (4.17) and (4.18) are taken into account as pre-equilibrium steps. The expressions of the relaxation times for the two kinetic effects (equation (4.20) and (4.21)) have been derived as described in Appendix VII. The values of the parameters obtained by this analysis are reported in Table 4.4.
1/τfast = k1[FeOH2+] + KDk2[FeOH2+]2 + (k−1 +KCk−2[FeOH
2+])/(1 + K
C[FeOH2+]) (4.20)
where KC = [Fe2OHH2L 4+
]/[FeH2L 2+
][FeOH2+ ];
1/τslow = KDK2k3[FeOH2+]2/(1+K1[FeOH2+]+K2KD[FeOH2+]2) + k-3KCH[H+]/(1+KCH[H
+ ]) (4.21) where KCH = [Fe2 HL 4+]/[Fe 2L 3+][H+].
The fast effect has been analyzed according to equation (20). Since the intercept of the parabolic function expressing 1/τfast vs [FeOH2+
] is close to zero (Figure 4.14B), the third term of equation (4.20) has been neglected. Concerning the slow effect, the linear dependence of 1/τslow on [FeOH2+
] (Figure 4.14C) indicates that in the denominator of the second term of equation (4.21) the inequality K1[FeOH
2+
] >> 1 + K2KD[FeOH 2+
]2
holds. The intercept value obtained from the plot of Figure 4.14C is very small, hence the contribution of the reverse step of reaction (4.19) cannot be evaluated using equation (4.21). For this reason, the slow reaction has been investigated in the reverse direction by mixing in the stopped flow apparatus the preformed 2:1 complex with known amounts of HClO4. Dependence of the time constant on the acid concentration is linear (Figure 4.15), in agreement with reaction (4.19), where just one proton is involved. Therefore, in equation (4.21) it must be KCH[H
+] << 1 and so the slope of the straight line of Figure 4.15 directly yields k-3KCH.
Figure 4.15 Dependence of the rate dissociation, 1/τdiss, on the hydrogen ion concentration
for the Fe(III)/SHA system at I = 1M (HClO4/NaClO4), T = 298 K.
4.5 FTIR Experiments
Infrared spectra of aqueous solutions of BHA and SHA have been recorded at pH = 1.66 ([H+] = 0.022 M) and I = 1 M. Moreover, the spectra of Fe(III)/ligand mixtures in the stoichiometric ratio CM/CL = 1 and 2 have been recorded also at pH = 1.66, where the extent of complex formation is maximum. Concerning the Fe(III)/BHA system, Figure 4.16A shows that the peaks corresponding to the vibrational frequency of N-H (3300 cm-1
) (Artemenko et al., 1980; Kaczor et al., 2005) do not display a remarkable change on going from free BHA solution to mixtures of BHA and Fe(ClO4)4. Therefore, comparison of the spectra shows clearly that Fe(III) is chelated by BHA through the O,O oxygen atoms, and that only the 1:1 complex is formed.
Concerning the Fe(III)/SHA system, comparison of the spectrum of free SHA with those of the CM/CL = 1 and CM/CL = 2 mixtures (Figure 4.16B) shows that, as in the case of the Fe(III)/BHA system, Fe(III) binds to SHA through the O,O oxygen atoms. Moreover, comparison of the spectral behavior of the CM/CL = 1 and CM/CL = 2 mixtures reveals that the bands corresponding to the phenol OP-H (3463 cm-1
) and N-H stretching (3300 cm-1
) (Artemenko et al., 1980; Kaczor et al., 2005) which, in the CM/CL = 1 mixture, are well evident (although overlapped) between 3000 and 3400 cm-1
, are reduced to a large extent in the CM/CL = 2 mixture. This result indicates that in the binuclear complex the second Fe(III) ion is bound to SHA through the OP,N site.
Figure 4.16 FTIR spectra of the investigated systems; [H+
] = 0.022 M, I = 1M (HClO4/NaClO4), T = 298 K. [BHA] or [SHA] = 5×10
-3
M. (A) The Fe(III)/BHA system: a) BHA, b) Fe(III):BHA = 1:1, c) Fe(III):BHA = 2:1. (B) The Fe(III)/SHA system: a) SHA, b) Fe(III):SHA = 1:1, c) Fe(III):SHA = 2:1.
4.6 Discussion
4.6.1 Fe(III) hydrolysis and self-aggregation
Fe(III) aggregation processes have been widely investigated since long time (Wendt, 1969; Sommer and Margerum, 1970; Baes and Mesmer, 1976), even though some controversies still remained, expecially concerning the trimer structure (Sommer and Margerum, 1970). Some results obtained in this thesis are in good agreement with those already present in literature; other ones represent a novelty feature, which better clarifies the aggregation reaction mechanism.
The value of the equilibrium constant for dimer formation obtained in this work from kinetics, as kD/k−D = 2.7×10
3
M, compare quite satisfactory with the value derived from the spectrophotometric titration (Table 4.1). Moreover, both values compare very well with the literature data (Baes and Mesmer, 1976). Actually, the equilibrium constant for dimerization, KD, obtained in this thesis can be converted to the value quoted by Baes and Mesmer, KDBM
(2.3×10⁻³ M at I = 1 M and 298 K), using the relationship KDBM =
[Fe2O4+ ][H+
]/[Fe3+ ]2
= KD×KH2
. On applying such an equation we obtain KDBM = 2.7×10⁻³ M.
The rate constant kD (Table 4.1) obtained in this work (I = 1.0 M) has been compared with that published by Sommer and Margerum (6.4×10²
M s−1, I = 4.0 M, T = 298 K) (Sommer
and Margerum, 1970). Their ratio, kD, I=4.0M/kD, I=1.0M gives a value of 0.46, according to (B)
product +4, the general rate constant ratio, kI=4.0M/kI=1.0M has to be equal to 0.5.
On the other hand, the same procedure shows that our rate constant kD is somewhat higher than the value of 8.1×10²
M−1 s−1 derived by conversion at I = 1 M of the Wendt datum
(4.5×10²
M−1 s−1, I = 0.6 M, T = 298 K (Wendt, 1969)) using the Güntelberg equation
(Guntelberg, 1926).
Concerning the reverse step, our value of k−D should be considered in agreement with the
value of 0.42 s-1
reported by Po and Sutin (Po and Sutin, 1971) who investigated the dimer dissociation, but somewhat higher than that obtained by Sommer and Margerum (Sommer and Margerum, 1970).
Concerning the process of formation/dissociation of the trimer, Table 4.1 shows that the agreement between the value of KT obtained from static experiments and that obtained from kinetics as kT/k–T is excellent. Two possible structures have been assumed for trimer (Sommer and Margerum, 1970) namely Fe3(OH)4
5+
and Fe3(OH)3 6+
(Scheme 4.3). Fe3(OH)3
6+ can form straightforward by addition of the FeOH2+ ion to the dimer, whereas formation of Fe3(OH)4
5+ would require the improbable encounter of Fe 2(OH)2
4+ with the doubly hydrolysed monomer Fe(OH)2+
present in extremely low amounts. Alternatively, Fe3(OH)45+
could be formed by the evolution of Fe3(OH)36+
. If this were the case equation (4.3) should be rewritten in more detailed form, corresponding to equation (4.22).
KB Fe2(OH)24+ + FeOH2+ + H2O ⇄ Fe3(OH)36+ + H2O ⇄ Fe3(OH)45+ + H+ (4.22)
According to reaction (4.22), the rate constant for the process of trimer dissociation, 1/τdiss, would be expressed by equation (4.23) where KB is the acid dissociation constant of the Fe3(OH)3
6+ ion.
1/τdiss = kT[H+
]/(KB + [H+
]) (4.23)
The linear dependence of 1/τdiss on [H+
] indicates that KB >> [H+
] and, therefore, that [Fe3(OH)45+
] >> [Fe3(OH)36+ ].
Finally, concerning the very slow step that has been observed, it has been ascribed to formation of more extended aggregates whose structure is difficult to predict. On the basis of this work results and previous literature data, it is only possible to guess that they could
form by addition of the FeOH2+
ion to an already formed aggregate since the union of two identical aggregates is disfavored by the electrostatics of the system. For instance, the union of two dimers to give a tetramer (charge product = +16) experiences a repulsion effect larger than that corresponding to the union of a trimer with FeOH2+
(charge product = +10). Actually, simple calculations based on the electrostatic theory of electrolytes (Prue, 1966) show that the increased repulsion results in a free energy penalty of 4.3 kcal mol-1
when the charge product rises from +10 to +16.
4.6.2 Complex formation of Fe(III) with BHA and SHA
It has been found that the value of KML reported in Table 4.3 for the Fe(III)/BHA 1:1 complex compares excellently with KML = Qf/KH = 1.0×10⁵
M-1
derived from Qf = [FeHL][H]/[Fe][H2L] = 1.7×10²
measured by Monzyk and Crumbliss at 25°C and
I = 1.1 M (HClO4/NaClO4) (Monzyk and Crumbliss, 1979). The kinetic study demonstrates that in the formation of the 1:1 complexes the reactive form of Fe(III) is FeOH2+
. Although a small contribution from Fe(H2O)6
3+ could be expected (Monzyk and Crumbliss, 1979) and experimentally found for instance in Fe(III)/Salicylate systems (Mentasti et al., 1982), this was found to be negligible in the explored range of concentrations of the present investigation. The value of k1 for Fe/BHA reported in Table 4.3 compares fairly well with the value of 4.3×10³
M−1s−1 by Monzyk and Crumbliss at I = 2 M (Monzyk and Crumbliss,
1979).
More important for the focus of the present work, are the results concerned with the binding of the second Fe(III) ion to SHA. According to the reaction Scheme 4.4 the species [Fe2OHH2L]4+
can form by direct attack of H3L to the dimer Fe2(OH)24+
or/and by reaction of the FeOH2+
monomer with the FeH2L monochelate. According to the Scheme 4.4 it turns out that KC = KDK2/K1 = 5.2 M
-1
. This finding indicates that the formation of Fe2OHH2L
4+
from FeH3L 3+
and FeOH2+
is largely disfavored with respect to the interaction of the dimer with H3L. It should be mentioned that direct attacks of Fe2(OH)2
4+ to ligands were observed in the case of Tiron (Chatlas and Jordan, 1994), tropolone (Secco et al., 1999), and 5-nitro tropolone (Secco and Venturini, 1999). However, the dimeric complexes observed in these systems, behave as unstable species (Chatlas and Jordan, 1994; Lente and Fabian, 2002), which loose a Fe3+
orFeOH2+
ion leaving the 1:1 complex as the final product of the complex formation reaction. On the contrary, in the case of the Fe(III)/SHA system, here investigated, the dinuclear complex is a stable species, as
atom within a single ligand molecule is undoubtedly provided by the OP,N site of SHA, as in the case of BHA, which is lacking in the phenol group, none of the used techniques revealed the presence of a dinuclear complex.
The study of the ability of SHA to form a dinuclear complex with Fe(III) is interesting in the perspective of its ability to form metallacrowns. Moreover, the dinuclear complex observed in this work is stabilized by the high charge density of Fe3+ ion, which facilitates the expulsion of protons from the OP,N site. The obtained results (the linear increase of the rate of decomposition of the dinuclear complex on rising [H+
], the FTIR spectra, the ability of the proposed mechanism to explain the experimental data) all conduct to the deduction that both Fe(III) ions are chelated by the two reaction sites of SHA while the ligand is fully deprotonated, in agreement with the structure shown in Scheme 4.1. This structure displays the sequence Fe(A)–N–O–Fe(B) which constitutes the network linking the metals contained in the ring of metallacrowns such as the 12-MC-4 and 15-MC-5 (Pecoraro et al., 1996; Mezei et al., 2007).
The study described in this chapter has been published in Inorganic Chemistry (Beccia et al., 2011).
![Figure 4.2A shows the spectrum of Fe(ClO 4 ) 3 at different concentrations, recorded at [H + ]](https://thumb-eu.123doks.com/thumbv2/123dokorg/7555780.109893/3.892.144.740.647.873/figure-shows-spectrum-fe-clo-different-concentrations-recorded.webp)
![Figure 4.3 Stopped-flow experiments showing the kinetic behavior of Fe(ClO 4 ) 3 solutions upon dilution jumps at I = 1 M (HClO 4 /NaClO 4 ) and T = 298 K: (A) C M = 0.11 M, [H + ] = 0.1 M; (B) C M = 0.036 M, [H + ] = 0.01 M](https://thumb-eu.123doks.com/thumbv2/123dokorg/7555780.109893/6.892.113.738.150.385/figure-stopped-experiments-showing-kinetic-behavior-solutions-dilution.webp)
![Figure 4.6 Kinetic trace recorded by spectrophotometric measurements for Fe(III). C M = 2×10 -4 M, λ = 532 nm, [H + ] = 0.1 M, I = 1 M (HClO 4 /NaClO 4 ) and T = 298 K](https://thumb-eu.123doks.com/thumbv2/123dokorg/7555780.109893/10.892.289.563.138.363/figure-kinetic-trace-recorded-spectrophotometric-measurements-hclo-naclo.webp)
![Figure 4.10 Dependence of the apparent binding constants, K 1app and K 2app , for the Fe(III)/SHA system on [H + ] at I = 1 M (HClO 4 /NaClO 4 ) and T = 298 K; (A) plot of K 1app vs [H + ], inset: dependence of K 1app on α FeOH](https://thumb-eu.123doks.com/thumbv2/123dokorg/7555780.109893/14.892.105.724.137.367/figure-dependence-apparent-binding-constants-naclo-dependence-feoh.webp)
