Chapter 1 - Introduction
1.1 Polyester
Polyesters are one of the most important classes of polymers in use today.
In their simplest form, polyesters are produced by polycondensation reaction of a glycol (or dialcohol) with a difunctional carboxylic acid (or diacid) so hundreds of polyesters exist due to the myriad of combinations of dialcohol and diacid, although only about a dozen are of commercial significance.
The synthesis of polyesters began in the 1930s by Carothers at DuPont in the USA and more significantly with the discovery of aromatic polyesters by Whinfield and Dickson at the Calico Printers Association in the UK (Figure 1.1).
Figure 1.1 – J.R. Whinfield (left) and J.T. Dickson (right) enact the discovery of fibre-forming poly(ethylene terephthalate (1942)
Polyesters are in widespread use in our modern life, ranging from bottles for drinks and water, to fibres for shirts and other apparel. Household tradenames, such as Dacron®, Fortrel, Terylene and Mylar, demonstrate the diffusion of polyesters.
The workhorse is poly(ethylene terephthalate) which is used for packaging, stretch blown bottles and for the production of fibre for textile products; other important polyesters are the poly(butylene terephthalate) well suited to injection moulding processes and highly resistant to temperature, poly(ethylene naphthalate) with higher glass transition temperature and improved mechanical properties.
Another class of polyester are the unsaturated polyester resin (UPR), which are mainly low molecular weight fumarate and maleate esters containing various chemical structure. Their commercial industry had its beginning in the late 1940s; after sixty years of commercial development, UPR applications continue to grow globally at robust rate because of its versatility and the use of additives, fillers and reinforcements that can modify the resin performance.
Table 1.1 provides a general guide to the effect that chemical constituent can have on unsaturated polyester resin end use performance.
1.2 Conventional design
Unsaturated polyesters are prepared through a classical esterification process. Tipically a dihydroxy compound, or a mixture of dihydroxy compounds, are treated with maleic anhydride and/or together with other dicaboxylic acids under elevated temperature to remove the water produced during the esterification process. Although various catalyst will catalyze the esterification reaction, there is enough carboxylic acid in the mixture so it is not necessary to add extra catalyst.
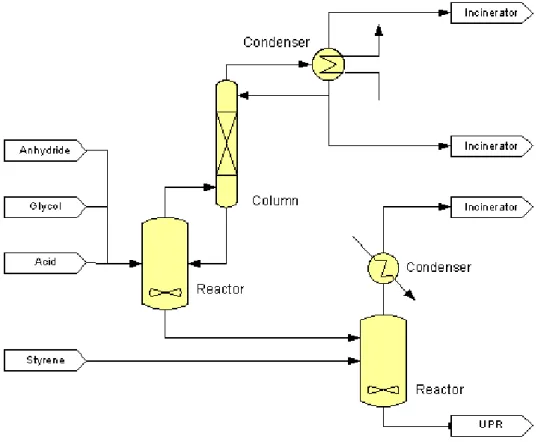
Unsaturated polyester resins are traditionally produced in a batch wise operating reaction vessel connected to a distillation unit, Figure 1.2 gives a general overview of the batch production process for Unsaturated Polyester Resins.
Figure 1.2 – Batch production process of UPR (DSM)
In the batch process, the reactants, anhydride and glycol are mixed and heated to temperatures higher than 60-80°C (up to a maximum of 210°C). A very fast exothermic
reaction (H ~ -40 kJ/mol) occurs between the acid and the alcohol end group to form the ester bridge and releasing water (Salmi et al., 1994).
― ― ― ― ―
The process is operated at low pressure (1 bar) and at the end of the process under vacuum to completely remove water from the polymeric mixture.
Other transformations occur in the reactive system: when the anhydride is used in place of the acid it undergoes a ring opening reaction by addition of water or of the hydroxyl group; at high temperature (higher than 180°C) the cis- acid isomerizes to the trans- form with a lower steric interference; last, the double bond may undergo a saturation by addition of the glycol.
The first reaction is strictly necessary for the polyester production and it also provides the advantage of removing (or not generating) water from the system; the second is not considered a loss because the trans- isomer reacts continuing the polymerization and it is nearly 20 times more reactive with the crosslinking agent than the cis- isomer, sometimes it also provide better mechanical properties; the third reaction represent a problem because it leads to the branching of the linear polyester.
Polyesterification reactions are usually equilibrium-controlled and continuous removal of water is necessary to obtain high conversions, thus the necessity of high temperature to evaporate this product; usually nitrogen or xylene are used as stripping agents.. A reflux condenser or a distillation column are usually directly coupled to the reactor vessel in order to avoid excessive loss of reactants and to control the temperature in the reactor.
The reaction rapidly increase the viscosity due to the growth of the chains. At a carefully chosen point, the reaction is halted by cooling down the mixture. The polyester is diluted with styrene (crosslinking agent) and additives (for controlling the curing process, color etc.) are added.
With this configuration the equilibrium conversion of the reactant is about 88-90%, the total production time is about 12 hours and batch to batch inconsistencies can be encountered.
1.3 Reactive distillation
A promising alternative for the intensification of this process is reactive distillation. Reactive distillation is a well known technology for reactive separation systems close to equilibrium. The integration of reaction and separation holds clear advantages for many systems in comparison with subsequent reaction and separation and the removal of reaction water in esterification systems is a good example and has already been extensively studied (e.g. methyl acetate production).
However the current scientific and industrial research is often limited to the optimization of reactive distillation columns for a single product type produced at a relatively large capacities. This makes the application of the outcome of these studies not useful for applying reactive distillation in a multiproduct environment with a relatively small capacities as encountered in the polyester industry.
In order to be able to apply reactive distillation technology in multiproduct environments new concepts need to be developed which allow the combination of a significant increase in volumetric productivity with sharp product transitions.
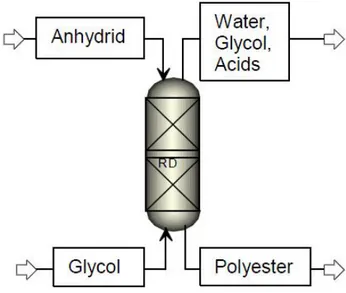
Figure 1.3 gives a schematic view of the reactive distillation column that should replace the polymerization reactor and the coupled distillation column in the batch process.
The column is operated as counter current vapour-liquid contactor: the anhydride is fed as a liquid at the top of the column and the glycol is fed at the bottom of the column as a vapour. The polyester product leaves from the bottom of the column and water (with traces of glycol and acids) leaves at the top.
A preliminary study of the maleic anhydride and propylene glycol system via Aspen Custom Modeler shows interesting possibilities for this solution (Shah, Zondervan, Oudshoorn, de Haan 2010).
The optimum reaction temperature of the polyester process in batch production is between 210°C and 220°C to avoid destruction of the unsaturated acid. Due to the short residence time requirement in the reactive distillation process, the reaction temperature is kept between 185°C and 300°C. The free acid (or anhydride) is present only in the 3 top stages of the reactive distillation column and the reaction temperature on these stages is between 185°C and 210°C. Thus, there is small possibility of destruction of unsaturated acid in the reactive distillation process.
The reactive distillation process model predicts acid value, hydroxyl value, maleate, fumarate, saturation compositions and polymer attributes of the polymer in the range of industrial unsaturated polyester production in batch reactor (Table 1.2).
Table 1.2 – Comparison of the product specification
The industrial unsaturated polyester production time is around 12 hours, however, the study shows that the total production time of unsaturated polyester in a continuous reactive distillation system is between 1.5 and 2 hours for the same product, so the reactive distillation will intensify the process by a factor of 6 to 8. The equilibrium conversion in a batch reactor process is around 88-90%, however, in the reactive distillation process it is significantly higher and can be up to 97%.
1.4 Objective
This master project is part of the PhD project "Reactive Distillation for Multi-Product Continuous Plants“. In this project, the modeling and conceptual design of reactive distillation operations for multiple polyester products have been carrying out.
The important aspect for the practical realization of such operations is the availability of column internals that allow sufficient liquid phase holdup in order to achieve residence times of 1-2 hours. At the same time these internals should enable product transitions within the shortest possible timeframe. A preliminary evaluation has demonstrated that packed columns are not suitable due to low liquid holdup and tray columns require to long times for product transition; bubble column, packed bubble column and tray bubble column can be promising internals.
In order to model a reactive distillation column liquid holdup, mass transfer coefficient and axial dispersion data for the internals are required: there are number of correlation of these variables in the literature for different internals, however, they are limited to non-viscous liquid or to unsuitable internals.
The objectives of the master thesis are therefore:
The selection of few column internals able to ensure sufficient liquid hold up and mass transfer with a low axial dispersion
The development of a proper experimental setup
The characterization of liquid holdup, mass transfer and axial dispersion properties for the selected internals
1.5 Literature background
1.5.1 Bubble column and packed bubble column
Several authors investigated the hydrodynamics and the mass transfer properties of bubble columns and packed bubble columns.
Today this kind of equipment are often used as heterogeneous reactors. Deckwer and Shumpe in 1993 pointed out the main characteristics of this system: the best advantage of this configuration is the simple construction and the absence of moving parts; other interesting properties are related to the high heat transfer, the capability of handling solid catalysts without serious erosion and plugging problems, a reasonable interphase mass transfer at a low energy input and a relatively large liquid hold-up. On the other hand, a considerable backmixing in both the liquid and the gas phase, high pressure drop and the problem of bubble coalescence limit the applicability of this solution.
Therefore, bubble columns and packed bubble columns are particularly well suited for gas-liquid slow reactions when the mass transport resistance is mainly located on the liquid side (such as oxidations, hydrogenations, chlorinations etc.); because of this, most of the data available for packed bubble columns refer to structured catalytic packings (Krishna et al. 2001, Kolozdiej et al. 2001, Gorak et al. 2004, Hoffmann et al. 2005).
The hydrodynamics and transport properties have often been correlated, usually in the standard system of water and air at atmospheric pressure.
About the hydrodynamic, it is possible to distinguish between two macroscopic flow regimes and a transition regime between them: at low gas flow rate the homogeneous (or bubbly) flow occurs while at higher gas flow rate the heterogeneous ( or churn-turbolent) flow occurs (Figure 1.4).
These two regimes can be easily distinguished visually and identified from the dependence of gas hold up on superficial gas velocity.
The homogeneous regime is characterized by the almost uniform size of bubbles and radially uniform gas hold up; the bubbles rise undisturbed virtually vertically or with a small-scale oscillation. The heterogeneous regime is characterized by a wide distribution of bubble size and by the existence of a radial gas hold up profile; a portion of gas,
which increases with gas velocity, is transported through the bed in the form of fast rising large bubbles (Zahradnik et al, 1997).
Figure 1.4 – Flow regimes in bubble column
In bubble columns, the gas holdup first increases with gas velocity and, in case of an efficient distributor (porous plate, multiple-orifice sparger, etc.), a maximum may be obtained in the transition between homogeneous and heterogeneous regimes (Zahradnik and Fialova, 1996). With a less efficient distributor (e.g. single-orifice sparger), no maximum is observed, as the heterogeneous regime prevails even at low gas velocities s (Deckwer 1985, Camarasa et al. 1999), see Figure 1.5.
Figure 1.5 – Gas holdup with gas velocity in bubble column: a) Zahradnik and Fialova, 1996, b)Vial et al. 2000
Most of the authors state that the superficial liquid velocity does not affect the gas holdup either because the normal range of liquid velocity is pretty small (Wild et al., 2001) or because the effect is totally negligible if compared with other factors (Shawaqfeh, 2002), see Figure 1.6. However, Chen in 1976 examined a quite wider range of liquid velocities and found a slightly increasing trend of gas hold up with the superficial liquid velocity beyond 23 cm/s.
Figure 1.6 – Gas hold up with liquid velocity in bubble column Shawaqfeh, 2002
The effect of the liquid viscosity on the gas hold up is not totally clear.
Many authors report a decreasing gas hold up with increasing viscosity, this is due to the increasing coalescence of the bubbles and thus to the much higher rising velocity of large bubbles (Deckwer and Shumpe 1982, Niranjan and Pangarkar 1984, Zahradnik et al. 1995, Li and Prakash 1997, Kantarci et al. 2005); on the other hand, there are studies reporting controversial effects of the viscosity (Deckwer 1992, Kastanek et al. 1993, Kuncova and Zahradnik 1995).
An increase was found at low viscosity (< 3mPa·s)and a decrease at higher viscosity (Figure 1.7); to reconcile this ambiguity, the viscosity was supposed to play a dual role: at a low viscosity, the larger drag forces reduce the bubble rise velocity and thus cause an increase in holdup; at a higher viscosity, the tendency to coalescence prevails over the
Figure 1.7 – Gas holdup e versus gas flow rate q in bubble column, Ruzicka et al., 2003: liquid viscosity: = 1 (dotted line), 1.6(■), 2.1(♦), 3.8(▲), 5.4(), 6(■), 8.5(●), 22mPa·s(●).
The mixing of the liquid phase is affected by many operating parameters, the experience shows a macroscale circulation of the liquid induced by the voidage profile with velocities of one or two orders of magnitude higher than the superficial liquid velocity. The mixing develops in circulation cells of the size of the column diameter, see Figure 1.8 (Krishna et al, 2001), and this kind of flow patterns produces a characteristic long tail in the residence time distribution curves (de Andrade Lima, 2005).
According to this observation, the liquid mixing is mainly given by the gas entrainment of liquid and therefore it clearly increase with the gas velocity (Ohki and Inoue 1969, Chen 1974, Zahradnik et al. 1997, Illiuta et al. 1998, Krishna et al. 2001, Therning and Rasmusson 2001, Wild 2003, Shawaqfeh et al. 2002) see Figure 1.9.
Figure 1.9 – Axial dispersion coefficient versus gas velocity in bubble column packed with Sulzer SVM 16 (Lakota et al., 2001)
The effect of the liquid velocity is not well defined but certainly it is much less relevant than the one due to the gas velocity. The same authors mentioned above report different trends: according to Chen 1974, Illiuta et al. 1998, Shawaqfeh et al. 2002 the dispersion coefficient increases with the liquid velocity, according to Khang and Kothari
Figure 1.10 – Axial dispersion coefficient versus liquid velocity in bubble column : a) Chen 1974, b) Khang et al. 1980
1980, Zahradnik et al. 1997, Cassanello et al. 2001 it decreases and according to Lakota et al. 2001, Wild 2003 the liquid velocity has no significant effect on the dispersion coefficient (Figure 1.10).
About the mass transfer, the overall transfer rate per unit volume in a bubble column and packed bubble columns is governed by the liquid-side mass transfer coefficient and its variation is primarily due to variations in the interfacial area, so the gas velocity affects the mass transfer coefficients most while the effect of the liquid velocity is negligible (Lakota et al. 2002).
Very few data are found dealing separately with mass transfer coefficient (kL) and
interfacial area (a), most investigations performed are limited to the determination of the volumetric mass transfer coefficient, kLa (Kantarci et al., 2005).
In agreement with above, Krishna and Van Baten in 2003 reported an increasing mass transfer with increasing gas velocity in the same trend as the gas holdup increased with superficial gas velocity and Bathia et al. in 2004 found an increasing mass transfer in the same trend as the interfacial area (Figure 1.11), similar trends are reported by different authors (Sahay and Sharma 1973, Abraham and Sawant 1990, Khamadieva and Bohm 2006).
Figure 1.11 – Volumetric mass transfer coefficient and interfacial area versus gas velocity in bubble column packed with corrugated grids (Bathia et al. 2004)
Experiments performed with viscous media showed that the volumetric mass transfer coefficient, kLa, decrease with increasing liquid viscosity: higher viscosity lead to an
increase of the volume fraction of the large bubbles and thus to a much lower gas–liquid interfacial area (Kantarci et al., 2005); it also affects the gas–liquid mass transfer coefficient by decreasing the liquid diffusion coefficient (Shouten et al. 2008).
Figure 1.12 – Mass transfer coefficient versus viscosity in bubble column packed with Sulzer Mellapak (Khamadieva and Bohm 2006).
The packed bubble columns show the same behaviour of the bubble columns, the main differences are an higher gas hold-up (Khamadieva and Bohm 1996 with Mellapak, Krishna et al. 2001 with Katapak, Bathia et al. 2004 with corrugated grids, Birrer and Bohm 2004 with SVM), an higher mass transfer coefficient (Khamadieva and Bohm 1996 with Mellapak, Lakota et al. 2002 with SVM, Bathia et al. 2004 with corrugated grids) and a lower axial dispersion (Therning and Rasmusson 2001 with Pall rings, Krishna et al. 2001 with Katapak, Lakota et al. 2001 with SVM).
1.5.2 Hold up
The gas hold up measurements can be performed in several ways, the most important are by means of pressure difference between two different height of the packing and the measurement of the height of dispersion.
Today, the first method is the most common (Zahradnik and Fiaolova 1996, Krishna et al. 2001, Shawaqfeh 2003, Bhatia et al. 2004, Birrer and Bohm 2004, Kantarci et al., 2005) but also the second is still in use (Ohki and Inoue 1969, Chen 1976, Niranjan and Pangarkar 1984, Abraham and Sawant 1990, Khamadieva and Bohm, 1996, Therning and Rasmusson 2001, Lakota et al. 2001).
1.5.3 Dispersion
The liquid dispersion is generally determined from residence time measurements (RTD) after injection and detection of a tracer at two axial positions.
The tracers used in this kind of experiment can be various: usually a ionic compound (usually NaCl or KCl) is dissolved to produce a saturated solution and its detection occurs by mean of conductivity sensors (Campos and Guedes de Carvalho 1992, Iliuta et al. 1998, Krishna 1999, Bathia et al. 2004,); other tracers can be acid detected by a pH-meter (Therning and Rasmusson in 2001 used sulphuric acid, Hoffmann et al. in 2002 used HCl), organic detected by a UV analyzer (Zahradnik and Fiaolova in 1996 used sodium benzoate, Meng-Shyang and Chung-Sung in the same year used diethylbenzene).
Several models have been proposed to predict and describe the extent of the mixing in the liquid phase, anyhow the phenomenon is usually described via empirical correlations of a dispersion coefficient or adimensional numbers like Bodestein or Peclet.
The most common models used in this field are the Axial Dispersion Model (ADM) and the Plug flow Dispersion Exchange model (PDE).
The first one (ADM) considers the column as a plug flow tubular reactor and adds a term of dispersion to the normal equation. The model was firstly and extensively described by Danckwerts in 1952, he also provided the boundary conditions to the model that, up to now are known, as Danckverts’ conditions. Later several authors (Cauwenberghe 1966, Kreft and Zuber 1978, Michelsen 1994, Iliuta 1998) described the
same model giving extensive explanations to the physical meaning of these boundary conditions. The main advantage of this model is its simplicity and the fact it has only one parameter, the dispersion coefficient (see Chapter 4 for further detail on the model).
The PDE model was first developed for trickle beds (van Swaaij 1969) but it found a large application in bubble column also. It divides the liquid in two different phases: one is called dynamic and flow through the column, the second is called stagnant and it is stationary. The same equation of the ADM (plug flow plus dispersion) is applied to the dynamic phase but a new term is added to take into account the mass transfer between the dynamic and stagnant phases. The equation for the second phase considers only this mass transfer. This model is more complex than the previous first because it consists of two differential equations, then because it involves three parameters (dispersion coefficient, fraction of stagnant liquid and mass transfer coefficient between the two phases).
Same authors state that the PDE model fits better the characteristic tailing of bubble and packed bubble column (de Andrade Lima, 2006), anyhow most part of the studies in this field consider the ADM. Even if the use of an axial dispersion coefficient can only be a rough simplification, the description of the liquid phase mixing in bubble column given by this model is usually adequate (Wild, 2003).
The dispersion coefficient is greatly affected by the liquid circulation in the column therefore; while the bubble column is pretty well stirred by the gas flow, in the packed bubble column the mixing is strongly anisotropic and two different coefficients should be separately calculated for the radial and axial dispersion.
In 2001 Krishna et al. defined a procedure to evaluate the two coefficients using a 2D column and measuring the profiles on different point of the outlet, in the same year they also adopted another solution that other authors preferred.
In 1992, Campos and Guedes de Carvalho proposed to inject the tracer in a small liquid pool on the top of the packed bed: this pool behaves almost like a CSTR and provides a good radial dispersion of the liquid then the liquid with the dispersed tracer gradually penetrates in the packed bed so it is possible to use a one dimensional model to evaluate only the axial dispersion coefficient (Therning and Rasmusson, 2001).
1.5.4 Mass transfer
The liquid side mass transfer coefficient can be evaluated in several different absorption/desorption or distillation systems.
The most common systems in the first group are the absorption (or desorption) of oxygen in (or from) water (Linek et al. 2001, Perrin et al. 2002, Lakota et al. 2002, Bathia et al. 2004, Shouten et al. 2007) and carbon dioxide (Shahy and Sharma 1973, Billet and Shulte 1999, Gorak et al. 2001, Kolodzeij et al. 2004). This second method can also include the chemical reaction of carbon dioxide with an alkaline compound, usually sodium hydroxide or bicarbonate (Shahy and Sharma 1973, Abraham and Sawant 1990, Rochelle et al. 2009).
The distillation systems can be various, usually the authors choose to a organic system like chlorobenzene/ethylbenzene or cyclohexane/n-heptane (Götze et al. 200l, Schultes and Chambers 2007, Fractional Research Inc.).
Contrary to distillation, where standardized methods and systems to determine the separation efficiency of column internals are established (Onken and Arlt, 1990), numerous systems and methods are used to evaluate the mass transfer phenomena in absorption processes. So, Hoffmann et al. in 2007 proposed the development of a set of standardized procedures for the measurement of mass transfer absorption characteristics.
Since the predominant mass transfer resistance might lie in either phase, suitable correlations have to be utilized to describe the mass transfer coefficients in the gas and liquid phase as well as the effective interfacial area, so the systems Hoffmann et al. proposed are the following: the absorption of SO2 in an aqueous NaOH solution for the
determination of the volumetric mass-transfer coefficient in the gas phase; the absorption of CO2 in an aqueous NaOH solution for the measurement of the effective
interfacial area; and physical absorption systems (i.e. the absorption of NH3 in water or the stripping of CO2 from water) for the determination of the volumetric mass-transfer coefficient in the liquid phase.
Later in 2009, Linek et al. analyzed the systems Hoffmann proposed because, although the absorption/desorption of sparingly soluble gases, typically oxygen or carbon dioxide in/from water, is generally used to measure kLa, Hoffmann
Various researchers, including Hoffmann, measured kLa values in different
absorption systems: Sahay and Sharma 1973 CO2–H2O, Onda et al. 1968 CO2–H2O,
Billet and Schulte 1999 CO2–H2O, Hoffmann et al. 2007 NH3–H2O, Linek et al. 1984,
1995, 2001 O2–H2O. The data are in good agreement, except in the case of Hoffmann,
whose data deviates from the others by up to almost 100%.
As about 50% of mass-transfer resistance is concentrated in the gas phase in the absorption system used by Hoffmann et al. (2007), the authors have evaluated kLa by
subtracting the gas-phase resistance measured by the absorption of SO2 in lye from the
total mass-transfer resistance measured by the absorption of NH3 in water.
This calculation procedure assumes that the effective mass-transfer areas in both absorption systems, namely NH3–water and SO2–lye, are the same. So Linek supposes
this is the main reason why their kLa data differs from those of other authors.
These facts lead Linek to suggest not to use the absorption of NH3 in water for the
measurement of kLa, and to prefer system of oxygen desorption from air-saturated water
into gaseous nitrogen (desorption experiments are preferred to absorption ones because they are the simple of the two to carry out).