1
ALMA MATER STUDIORUM A.D. 1088
UNIVERSITÀ DI BOLOGNA
SCUOLA DI SCIENZE
Corso di Laurea Magistrale in Geologia e Territorio
Dipartimento di Scienze Biologiche, Geologiche ed Ambientali
Tesi di Laurea Magistrale
Reservoir characterization of the Cardium
Formation in the Ferrier Oilfield, west-central
Alberta, Canada
Candidato: Relatore:
Marco Venieri Prof.ssa Rossella Capozzi
Correlatore:
Prof. Per Kent Pedersen
Sessione Marzo 2016
Anno Accademico 2014-2015
2
ABSTRACT
This thesis has the main aim of defining the lithostratigraphy, depositional architecture, post-depositional modifications and reservoir characteristics of the Cardium Formation in the Ferrier Oilfield, and how these characteristics can have great impact over production rates, GOR and produced fluid discrimination.
In the Ferrier area, the Cardium Formation is composed by a NE prograding clastic sequence made up of offshore to shoreface deposits sealed by marine shales.
The main reservoir is composed by sandstones and conglomerates interpreted to have deposited in a shoreface depositional environment.
Lithofacies and net reservoir thickness mapping led to more detailed understanding of the 3D reservoir architecture, and cross-sections shed light on the Cardium depositional architecture and post-deposition sediment erosion in the Ferrier area.
Detailed core logging, thin section, SEM and CL analyses were used to study the mineralogy, texture and pore characterization of the Cardium reservoir, and three main compartments have been identified based on production data and reservoir characteristics.
Finally, two situations showing odd production behaviour of the Cardium were resolved. This shed light on the effect of structural features and reservoir quality and thickness over hydrocarbon migration pathways.
The Ferrier example offers a unique case of fluid discrimination in clastic reservoirs due both to depositional and post-depositional factors, and could be used as analogue for similar situations in the Western Canadian Sedimentary Basin (WCSB).
3
ACKNOWLEDGMENTS
First of all, I would like to say I am indebted to my advisor, professor Per Pedersen. Per gave me a chance to join his research team during my student exchange period, and that made my Canadian experience simply amazing. His knowledge and guidance throughout the project were greatly appreciated.
Funding for this project was kindly provided by the Tight Oil Consortium (TOC) at the University of Calgary.
My gratitude also goes to Mikhail Yakunin, Ryan Taylor and Trisha Ilagan, with whom I had the chance to start working on the Cardium Formation during prof. Pedersen’s class.
I’d also like to thank Holly Nicholas from AGAT labs for providing support during sample analyses and Chris Debuhr for the great help in the SEM and CL characterization of the samples.
I wish to express deepest gratitude to Lorie Stewart from CNRL for many insightful discussions.
Finally, I’d like to say thank you to my family for all their support, as well as Vivek, Stefan, Kent and Ryan for having been part of my family during this amazing year.
4
Table of Contents
CHAPTER 1 - INTRODUCTION
1.1: Study focus and objectives ... 8
1.2: Aim of the project ... 13
1.3: Role of the student ... 13
1.4: Study Area ... 14
1.4.1: DLS coordinate system ... 14
1.4.2: Geographic location and play information ... 16
1.5: Materials and methods ... 18
1.5.1: Chapter 2 ... 18
1.5.2: Chapter 3 ... 19
CHAPTER 2 - GEOLOGY AND RESERVOIR ARCHITECTURE OF THE CARDIUM
FORMATION IN THE FERRIER OILFIELD
2.1: Geological framework of the Cardium Formation ... 202.1.1: Upper Cretaceous hydrocarbon generation and migration ... 23
2.2: Introduction to the Ferrier Oilfield... 24
2.3: Materials and methods ... 25
2.3.1: Core logging... 25
5
2.3.3: Optical microscopy ... 26
2.3.4: SEM and Cathodoluminescence ... 26
2.3.5: Petrophysical characterization ... 28
2.3.6: Geological Mapping ... 28
2.4: Results ... 30
2.4.1: Lithological characterization ... 30
2.4.1.1: Facies 1 – dark grey mudstone with thin silt laminae and few sand-sized grains ... 30
2.4.1.2: Facies 2 – bioturbated mudstones with silty and sandy horizons ... 31
2.4.1.3: Facies 3 – clean HCS sandstones ... 33
2.4.1.4: Facies 4 - conglomerates ... 35
2.4.1.5: Facies 5 – laminated, bioturbated dark grey mudstones... 38
2.4.1.6: Cardium type log ... 39
2.4.2: Petrological characterization ... 42
2.4.2.1: Facies 2 ... 42
2.4.2.2: Facies 3 ... 46
2.4.3: Facies mapping and reservoir architecture ... 56
2.4.3.1: E5 surface structure map ... 56
2.4.3.2: 60 API net sand map ... 58
2.4.3.2: Facies 3 thickness map ... 59
2.4.3.3: Facies 4 thickness map ... 63
2.4.3.4: Reservoir architecture ... 67
6
CHAPTER 3 - RESERVOIR CHARACTERIZATION OF THE CARDIUM FORMATION
IN THE FERRIER OILFIELD
3.1: Introduction ... 75
3.2: Reservoir mapping ... 78
3.2.2: Gross reservoir map ... 79
3.2.3: 6% net reservoir map ... 80
3.2.4: 12% net reservoir map ... 81
3.2.5: Discussion ... 82
3.3: Discrete reservoir bodies characterization ... 84
3.3.1: Conventionally developed, main oil and gas body ... 85
3.3.1.1: Cross-plots ... 90
3.3.1.2: Pore characterization ... 94
3.3.1.3: Facies influence over production ... 97
3.3.1.4: Conclusions ... 100
3.3.2: Unconventionally developed, oil and gas body ... 101
3.3.2.1: Introduction ... 103
3.3.2.2: Southern sub-body ... 104
3.3.2.3: Northern sub-body ... 117
3.3.2.4: Central sub-body ... 122
3.3.3: Conventionally developed, gas charged body ... 129
7
CHAPTER 4 - GEOLOGY AND HYDROCARBON DISTRIBUTION OF THE CARDIUM
FORMATION IN THE FERRIER OILFIELD
4.1: Introduction ... 144
4.2: Geological introduction to the areas showing odd production behaviour ... 144
4.2.1: Case 1 – conventionally developed, gas producing body ... 146
4.2.2: Case 2 – unconventionally developed body ... 155
CHAPTER 5 - CONCLUSIONS
5.1: Summary ... 1718
CHAPTER 1: INTRODUCTION
1.1: Study focus and objectives
The Cardium Formation has been a prolific oil producer since the first oil discovery in 1953 (Krause et al., 1994), when Socony Vacuum Oil Company and Mobil Oil first found hydrocarbons in the Pembina Oilfield drilling the well Socony Seaboard Pembina n° 1 (UWI: 100/04-16-048-08W5/00). (Parsons and Nielsen, 1954; Warke, 1955; Nielsen and Porter, 1984).
In the 1950s, in Alberta most of the hydrocarbons were produced from Devonian limestone reefs, and most of the plays were therefore identified looking at topographic bulges in seismic, that represented the reef buildup. in the reflection seismic sections of that time, the Cardium Formation wasn’t that visible, due to the low quality of the data, the relative thinness of the sandstones and the absence of structural features.
Drilling the Devonian reefs of the Leduc Formation, geologists were aware of the Cretaceous Cardium Formation, but it was disregarded by most of the Geologists. As Arne Nielsen, the geologist of Mobil Oil who discovered the Cardium potential and the Pembina oilfield, said: “ Cardium was good sandstone for hydrocarbon reservoirs, but it was always tight – lacking the porosity to produce oil or gas commercially. The wisdom at the time was that if it has previously produced oil in Alberta, as some old hands claimed it had, it was only in negligible amounts.” (Nielsen and Newman, 2012).
Looking at well logs and seismic in a broad area, Nielsen was able to detect that the Cardium sandstones pinched out into shales going eastward, i.e. stratigraphically upwards. That means it could represent a regional stratigraphic trap for hydrocarbons.
At that time, an exploration geologist couldn’t get a well drilled without the well being placed in a defined seismic location. Devonian reefs were quite easily identified in seismic, and each well could be placed in a precise position in seismic. Being the Cardium a blurred, almost flat, continuous line in seismic, gaining the approval of the bosses was very difficult, that’s why exploration was focused on reefs for still a while.
After a few time, Mobil Oil approved the new and ambitious Cardium prospect, and the first well was drilled. DST tests detected the presence of economically exploitable light oil in the Cardium cuttings, and that marked the beginning of the geologic exploration of the Cardium and the other stratigraphic traps of the Western Canadian Sedimentary Basin (WCSB).
Since the oil discovery in 1953, the Cardium sands and conglomerates began to be targeted first in the Pembina, and then in other regions nearby.
First, the oil and gas exploitation was carried out through vertical wells, with no other EOR technique. Because of the initial high production decline rates, several enhancing oil recovery techniques were applied starting from a few years after the Cardium discovery.
9 Petroleum geologists and engineers soon began to test the impact of water flooding on production. Water flooding was applied first in the Cardium Pembina Oilfield in the 1960s with great success (Purvis and Bober, 1979), and the technique was therefore applied to the other oilfields a few years later as well. Water flooding led to higher peak production and much lower decline rates, and this method is still being used in the main Ferrier oil and gas reservoir.
As an example of the advantages brought by water-flooding, we can analyse the production curve of well 100/10-27-040-08W5/00. It was spudded in December 1967, and therefore it underwent both the non- and the water-flooding stages of production.
Fig.1: production analyses of 100/10-27-040-08W5/00. Water flooding has been applied from 1970, and that’s exactly where an increase in hydrocarbon production and a decrease in production decline is observed.
As we can see looking at the graph, the production decline between 1968 and 1970-71 shows a deeply steep trend. However, from 1970-71 to the present day, the decline is linear and much slower than the first 2-3 years of production. The cause for this enhancement of production is the application of water-flooding that, as EOR method, can turn resources into reserves.
10 The picture below shows the daily average injected water by 4 water injectors (shown in orange circles) close to 100/10-27-040-08W5/00 (shown in red). As we can see, water injection starts exactly at the time when production decline abruptly decreases in the graph above. This testifies the excellent efficiency of the water-flooding techniques, that at the present day are still used in the main oil and gas reservoir as EOR techniques in many oil and gas fields around the world.
11
Fig.2a and 2b: injection analysis of the daily injected water by 4 injector wells near 10-27-40-8W5 (2a); injecting wells location (2b). Each well symbol corresponds to a current well status.
Injecting water
Suspended oil Abandoned oil
12 Around 2010, the first multi-stage horizontal wells targeted the low permeability facies of the Cardium formation. These technique turned out to be an excellent way to target the halo oil plays of the Cardium.
According to Clarkson and Pedersen (2011) “halo oil plays are defined as portions of conventional light oil accumulations that did not meet traditional pay criteria cut-offs for vertical well development”.
Fig.3: play types classification based on permeability, type of rock and coincidence or not between source rock and reservoir. (from the University of Calgary Tight Oil Consortium website:
http://www.tightoilconsortium.com/)
As shown in the picture above, halo oil is held into the most permeable unconventional reservoirs. In this case, the reservoir is often not exploitable with the traditional methods because of its poor petrophysical characteristics, conversely with a conventional reservoir. Therefore, halo oil plays can be classified as “poor reservoir quality, bypassed pay zones”. The exploitation of these portions of the reservoirs requires high performance EOR techniques, such as horizontal drilling and multi-stage hydraulic fracturing. Starting from around 2008, a lot of multi-stage horizontal wells have been drilled in the Cardium Formation with variable success.
13 The factors that control the success of these multi-stage fracking horizontals are currently still not clearly understood, as the “halo” portions of the reservoir are thinner and commonly show poorer petrophysical characteristics than the conventionally developed areas of the Cardium Formation.
Dealing with thin-, poor quality reservoirs means that subtle variations in reservoir characteristics such as depositional architecture, porosity, permeability, diagenesis and fluid saturation can have a major impact on the success of EOR techniques.
All of the above testifies that an accurate reservoir characterization must be performed for every oilfield targeted unconventionally, in order to focus on the best reservoir spots. In this study, we will focus on the reservoir characterization of the Cardium Formation in the Ferrier Oilfield, that is one of Alberta major Cardium oilfields, together with the Pembina and Willesden Green.
The lack of studies specifically focused on this topic in this oilfield makes this research one of the most accurate and updated projects about the geology of the Cardium in the Ferrier.
1.2: Aim of the project
This project was developed in collaboration with the Tight Oil Consortium at the University of Calgary (AB, Canada). The aim of this research is to perform detailed reservoir characterization of the Cardium Formation in the Ferrier Oilfield. This includes both the conventionally- and the unconventionally developed portion of the Cardium.
This study has been carried out using core logging, petrophysics, sedimentology and production data, and will uncover different facies and flow units within the Cardium Formation in the study area.
At the end of this project, new information about the depositional architecture of the Cardium Formation, the geologic controls over fluid production and the nature of produced fluid (gas vs oil, GOR) in the Ferrier oilfield will be revealed. This research has been developed in order to be a useful tool for the Oil industry to find new potentially economically profitable drilling locations for horizontal Cardium wells in the Ferrier area.
1.3: Role of the student
This thesis represents the final product of more than one year of work at the University of Calgary and the University of Bologna. Every analysis used and described in this thesis was undertaken by the master’s candidate, or with direct observation of the methodology by the student himself.
14
1.4: Study Area
The Ferrier oilfield is located in Alberta, Canada. More specifically, it’s found in the west-central portion of Alberta, 80 km west from the city of Red Deer and close to the town of Rocky Mountain House.
Fig.4: geographic location of the Ferrier Oilfield (picture taken from google maps)
The coordinates of each well location are expressed as Dominion Land Survey (DLS) coordinates, that is the most used in Western Canada. DLS coordinate system will be explained below, as it will be used throughout all this written report.
1.4.1: DLS coordinate system
DLS coordinate system was well described in the notes of the GLGY 575 class at the University of Calgary. These notes, written by dr. Stephen Hubbard, Paul Durkin and
50 km
N
15 Benjamin Daniels (GLGY 575 – lab 1), will be in part used to provide the reader with a first introduction to the DLS.
The main characteristics of the DLS are summarized below:
• The basic unit of land is the Section, that is a square having the side 1 mile (640 acres) long; • Thirty-six Sections are grouped into a Township, that is a square having the side 6 miles long;
• Rows of Townships are numbered from the International Boundary northward (S to N) in Western Canada;
• Columns of Townships (Ranges) are numbered west or east of arbitrary reference Meridians of longitude.
The location of any given point on the surface (or well penetration location) is known as Unique Well Identifier (UWI). Locations are given in the order:
1. Legal sub-division 2. Section
3. Township (T) 4. Range (R) 5. Meridian
In the picture provided below, the UWI of the black dot is 15-13-05-06W2. That means is 6 ranges west of the second meridian (06W2), in township 5 (T 05), section 13 and legal sub-division 15. The picture below shows the thinking process graphically.
16
1.4.2: Geographic location and play information
The study area is located in Townships 37-42 and Ranges 07-10W5. As of February 2016, the study area counts 957 wells that have/have had the Cardium Formation as production/injection formation.
810 wells over the total 957 are vertical or deviated, that means the horizontal penetrations producing from the Cardium in the Ferrier are 147.
The horizontal wells are mainly located at the edge of the main oil body and in the western portion of the oilfield, where they have been drilled to exploit a poor-quality reservoir portion. This is visible in the map below, where the HZ Cardium wells are shown in red, in contrast with the black dots (Cardium vertical wells).
1 mile 6 miles
17
Fig.6: present-day status of the Ferrier Oilfield. The black wells represent the former or current vertical and deviated Cardium producing wells in the play. Red wells represent the Cardium horizontal producing wells. Each vertical penetration targeting deeper plays than the Cardium was not shown in the picture, although having been taken into account for reservoir mapping. The smaller picture offers an overview of the main Cardium oilfields in Alberta.
18 In the conventionally developed portion of the Ferrier, the well density is approximately 4-5 producers and 2 water injectors per section. In that portion of the studied oilfield, 163 vertical wells are currently injecting water in the Cardium, whereas 289 vertical or deviated wells are currently producing oil and gas from the Cardium, and 148 verticals are producing gas only. The latter are mainly located in the gas cap of the pool (E side, structurally up-dip) and in the northwestern side of the play, where another good quality gas-bearing reservoir is present and has been exploited since the late 1980s.
Finally, 162 wells have been suspended or abandoned due to low fluid rates or uneconomic well conditions.
The study area was selected based on several criteria including unique geology, available well logs and core data and unresolved geologic issues (e.g. abrupt differences in GOR in closely spaced wells).
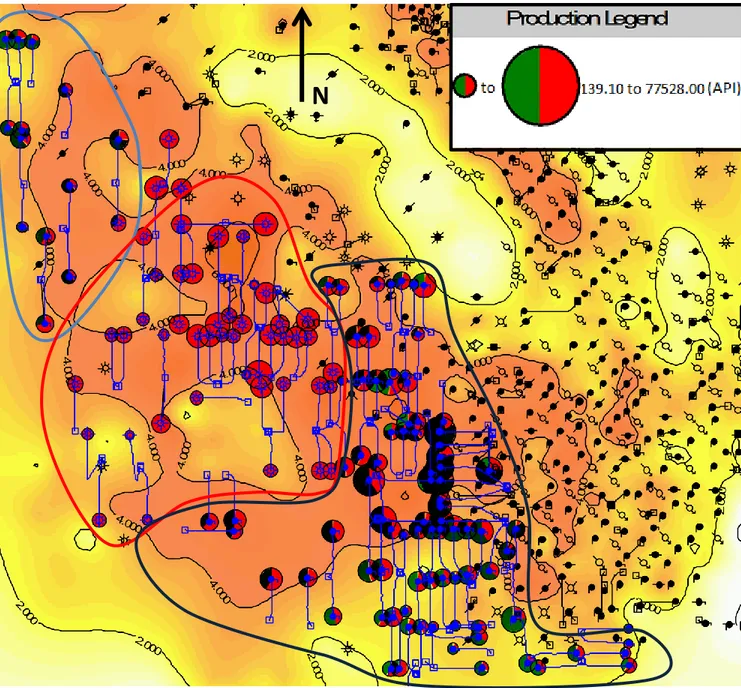
More specifically, in the unconventionally developed portion of the reservoir, there is an abrupt change from oil and gas production to gas only, and researchers, as well as companies are interested in understanding what controls this shift in production for scientific and economic reasons. This is the first paper dealing with this production issue in the Cardium in the Ferrier area.
1.5: Materials and methods
1.5.1: Chapter 2
In chapter 2 a general geological framework of the Cardium Formation with particular focus on the Ferrier Oilfield is shown. The framework was shown using a total of 1337 vertical penetrations with available well logs in the Cardium (Gamma ray, Neutron/Density, Resistivity). To describe the lithofacies and calibrate the well log responses 13 cores have been directly described at the Alberta Energy Regulator – core facility, and the pictures of other 20 cores were taken into account for lithofacies description and distribution.
Optical microscopy, SEM and cathodoluminescence helped in identifying different lithofacies based on micro-scale features like texture, cementation, grain size, porosity and 2-D pore connectivity .
Together with core description work, cross-sections were used as a tool to unravel the stratigraphic framework of the Cardium Formation in the Ferrier Oilfield. Stratigraphic correlations shed light on the reservoir architecture and trapping mechanisms, as well as post-depositional modifications.
Core descriptions, facies analysis and core analysis data were used together with production data to determine net sand and net pay cut-offs for the productive intervals. The final product of chapter 2 will be lithofacies description and mapping and the depositional architecture of the clastic body in the Ferrier area.
19
1.5.2: Chapter 3
Chapter 3 focuses on the reservoir characterization of the Cardium Formation in the Ferrier Oilfield.
The reservoir characterization of the Cardium Formation has been made through the same analyses used in chapter 2, but run with different aims.
First of all, the 13 logged cores were considered as flow units. This involves a first lithostratigraphic differentiation, but there may be more than one flow unit in the same facies too. Looking at flow units in core is a tool to understand how and how fast hydrocarbons can flow within the Cardium.
Optical microscopy, SEM and cathodoluminescence were used to identify and characterize flow units at small scale of observation. More specifically, these analyses were aimed at detailed pore characterization of the Cardium, including the estimation of the degree of cementation, as well as the type of cement.
Well logs have been used as well to build a more detailed reservoir framework in the Ferrier area. 6% and 12% net reservoir maps have been built from well logs and routine core analyses.
This has been useful to propose a new model that may relate hydrocarbon migration and migration pathways to the current fluid distribution in the Ferrier.
The final product of chapter 3 will net reservoir mapping and detailed description and characterization of each producing body in the Ferrier. Every compartment has been described as a discrete unit, and then a model considering how each body is linked to each other and why and in what it is different from the adjacent ones has been developed and proposed. Chapter 2 and 3 contribute to understand hydrocarbon distribution compared to the geology and petrophysics of the Ferrier. This will be discussed in chapter 4.
20
Chapter 2: Geology and reservoir
architecture of the Cardium Formation in
the Ferrier Oilfield
2.1: Geological framework of the Cardium Formation
The Upper Cretaceous Cardium Formation is a northeastward prograding clastic succession visible in outcrops and cores in the Western Canadian Sedimentary Basin (WCSB). It is made of fluvial deposits to shoreface sands to offshore muds and silts, and it pinches out into shales going eastward.
Being part of the Alberta Group, the Turonian-Coniacian Cardium Formation underlies the Campanian Wapiabi Formation and overlies the Cenomanian-Turonian Blackstone Formation (Hall et al., 1994; Krause et al., 1994).
The Cardium Formation is the fossil trace of an ancient fluvial to offshore depositional system active in the Upper Cretaceous and having as base level the western shoreline of the Western Interior Seaway. That was a broad inland sea stretching from the Arctic to the present-day Gulf of Mexico, that developed in the Cretaceous (Nielsen, 1957; Stott, 1963; Williams, 1975; Krause et al., 1994).
100 Ma
85 Ma
Fig.7: Interpreted Late Cretaceous paleogeography (modified after Blackey, http://cpgeosystems.com/nam.html). The red stars represent the interpreted location of the deposition of the Cardium Formation in the study area.
N
N
21 In the Upper Cretaceous the Canadian Cordillera, located in Western Canada, was still rising through tectonic impulses. Authors claim that the Seaway developed when the Pacific and North American tectonic plates collided, causing the uplifting of the Rocky Mountains. The tectonic load of the uplifting wedge, joined to the back-arc extension of the subducting plate, caused the formation of a depression parallel to the mountain thrust front trend. This NW-SE oriented hollow became bigger and bigger after every tectonic impulse, and led to the formation of the Cretaceous Western Interior Seaway (Nielsen, 1957; Stott, 1963; Williams, 1975; Krause et al., 1994; DeCelles, 2004; Varban and Plint, 2008; Blakey, 2014).
The rising mountains were the primary sediment source of Western Canada, with the sediment being eroded from the orogeny. Few to no sediment came from the eastern side of the in-forming sea, that’s why most of the observed paleocurrents were consequently towards the eastward-northeastward.
The deposition of the Cardium Formation was the consequence of one of the strongest tectonic impulses that contributed to the Cordillera raising process.
The Cardium stratigraphy has been studied by different authors, both with traditional and modern methods.
Ralph Rutherford was the first author to write about the Cardium Formation. In 1927, he identified as “Cardium Formation” three thin sandstone layers divided by three packages of shale outcropping along the Bow river (Rutherford, 1927).
After the success of the Socony - Seaboard Pembina n.1 well, interest in the Cardium Formation grew exponentially. In the 1950s, several works proposed stratigraphy and depositional models of Canada’s new most perspective oil and gas play.
The depositional models proposed vary in depositional environment, paleoclimate, genesis and age of the formation. This is due to the high heterogeneity of the Cardium that, joined to the absence of sequence stratigraphy and other modern techniques, made the study of the Cardium Formation harder.
The most accepted theory until the 1970s was that Cardium was deposited as an offshore bar (e.g. Nielsen, 1957). Other papers identified the formation being deposited as a turbidity current (Beach, 1955), or a tidally-influenced delta (DeWeil, 1956; Michaelis, 1957).
A strong contribution to the study on Cardium architecture was given by allostratigraphy. This technique uses discontinuities as bounding surfaces for depositional sequences, in contrast with the traditional sequence stratigraphy that uses fixed bounding surfaces (Sequence Boundary, Trangressive Surface and Maximum Flooding Surface).
In complex geological settings, where is not easy to identify these conventional-, Exxon-type bounding surfaces, a good assistance can come from the detection of regional-scale unconformities. This is a new view of stratigraphy, and it has been extensively applied to the Cardium Formation since 1986, when Plint et al. developed a new depositional model for the Cardium Formation mainly based on allostratigraphy.
The authors showed that the sand bodies were stretched parallel to the Wester Interior Seaway sides, and therefore could represent a shoreline. They also detected the presence of pebble dominated mudstone portions just on top of the unconformities, and interpreted these layers as lowstand shorelines.
22 Plint was able to find 7 regional-scale discontinuities within the Cardium Formation: those unconformities could be transgressional (T), erosional (E, subaerial erosion) or composite T-E (Plint et al, 1986; Shank and Plint, 2013).
The E5 surface represents the top of the main Cardium reservoir, and therefore it was extensively studied after Plint’s work. Walker and Eyles (1991), in their paper about the genesis and characteristics of the E5 surface, identified it as composite surface. They interpreted E5 as being initially subaerial and then modified by the subsequent transgression. The picture below shows Plint’s depositional model for the Cardium formation, and it’s widely used in bibliography. The author was able to sub-divide the Cardium into 6 main members bounded by regional discontinuities. Going stratigraphically upwards, the whole Cardium Formation is formed by the Nosehill, Bickerdike, Hornbeck, Raven River, Dismal Rat and Karr Member. These members are bounded by E / T / E-T combined surfaces visible in the picture provided below.
Fig.8: Shank and Plint’s depositional model for the Cardium Formation (Shank & Plint, 2013). Each significant allostratigraphic surface is marked with a E and or a T (erosional – transgressional).Dotted area represent sandstones, whereas bigger dots represent pebble-rich areas, claimed to be lowstand shorefaces.
23 As we can see from the picture, the E5 surface marks the top of the lower raven River member of the Cardium Formation, that is the main hydrocarbon reservoir in the Ferrier area and in the most of Cardium fields.
Looking at the conglomeratic facies, many authors (e.g., Krause and Nelson, 1984; Plint et al, 1986; Shank and Plint, 2013) classified them as lowstand shorefaces built with coarse-grained scour material. Today, this model of conglomerate genesis is widely accepted in the scientific community.
2.1.1: Upper Cretaceous hydrocarbon generation and migration
The Cardium Formation is widely known as light (40 API) oil reservoir, and has as hydrocarbon source the shales of the Second White Specks Formation (2WS). These Late Cretaceous marine shales contain type 2 organic matter having a total organic content (TOC) up to 10% (Creaney & Allan, 1990; Furmann et al., 2015).
According to previous studies (Creaney et al., 1994), the Second white speckled shale reaches the onset of maturity at the depth of roughly 2.5 km, and peak oil generation occurs at 3.5 km.
Hydrocarbons generated start the migration process towards the surface, and the structurally upward pinching-out of the Cardium reservoir facies prevents the hydrocarbon from escaping further, making it an ideal stratigraphic trap for oil and gas.
The sourcing rock of the Cardium is claimed to be responsible for the oil accumulation in the Belly River Formation as well. The hydrocarbon stored within the two formations shows the same chemical characteristics. According to Creaney et al. (1994), “the oil present within the Belly River could be the result of the overspill oil from the 2WS, that failed to reach the Cardium reservoir”.
Also, hydrocarbon migration gets more tricky if biogenic gas is generated in the early burial phase. According to Fuex (1977), if biogenic gas starts filling a trap, then oil, that is generated afterwards, can fail to enter the trap. This facilitates the long-distance migration of oil and makes the understanding of hydrocarbon distribution within the same body much more complicated.
24
2.2: Introduction to the Ferrier Oilfield
Fig.9: Ferrier location with respect to other Cardium fields and pools. Black wells represent Cardium producing wells outside the Ferrier edges. In the NE area there is the Willesden Green field, whereas the Cardium U Pool can be observed in the SE region. The latter is identifiable thanks to its odd triangular shape (Venieri et al., 2015).
25 The Ferrier oilfield is around 55 km long and 20 km wide, and oil and gas have been exploited from the Cardium Formation since the 1960s. Other productive horizons are present in other formation in the Ferrier area (e.g. Viking Fm, Spirit River Fm, Belly River Fm), but the Cardium is by far the greatest reservoir for hydrocarbon volume and number of drilled wells.
The wells in black represent each Cardium producing well adjacent to the Ferrier area. In the NE portion of the map part of the Willesden Green field is shown; in the SE we can find the Cardium U Pool, identifiable because of its odd triangular shape.
The wells in blue represent the Cardium vertical and deviated wells formerly or currently producing hydrocarbons in the Ferrier oilfield. These wells have mainly been drilled from the ‘60s to the late 90’s, even if some deviated wells are still being drilled to target by-passed pay zones.
With the beginning of horizontal drilling and multi-stage fracking a lot of fields were rejuvenated, including the Ferrier. Since the 2010 more than 150 horizontal wells have been drilled to target the halo portions of the Cardium. Horizontals are still being drilled in the Ferrier, and their number is quickly increasing. These wells are marked in red in the map.
2.3: Materials and methods
Examination of more than 1200 well logs and 13 cores taken within the pool boundaries led to the identification of 5 main facies, named 1 to 5 from the stratigraphically deepest to the shallowest. These 5 facies are always present in every core, but in different proportion and thickness. Isopach maps of each sedimentary facies will be computed and provided in this paper after the facies description.
2.3.1: Core logging
To describe the lithofacies and calibrate the well log responses 13 cores have been directly described at the Alberta Energy Regulator – Core Research Centre.
Cores have been selected based on several criteria including: good-quality GR, DPhi/NPhi and Resistivity well logs (other log types were an advantage), fluid production, type of produced fluid, availability of good-quality core sample data (phi, k, fluid saturation), core recovery close to 100%, well location close to zones of geologic interest (e.g. heterogeneity in geologic maps based on well log responses) and other.
Particular focus has been observed in logging the most representative sedimentological features of the Cardium Formation in core including: lithology, thickness, bedding, colour, grain size, mineralogy, estimated sand volume (or mud volume), nature of contacts with the units above and below, degree of cementation, presence of fossils or ichnofacies, sedimentary features, degree of bioturbation, depth of interpreted E/T surfaces, presence of fractures, presence of possible flow barriers and other.
26 A stratigraphic log has been drawn for each described core, also a detailed written logging report has been associated to the graphic log.
In addition to the cores described, the pictures of other 20 cores have been taken into account for lithofacies description and distribution.
2.3.2: Core sampling
Core sampling allows to study a small portion of a core in high detail. The AER research centre allows to take core plugs and other part of a core for thin section purposes.
This research already had lots of porosity and permeability data, that’s why we didn’t require any additional core plug data. Conversely, we thought it could be very useful to look at particular portions of some cores in thin section and SEM. This had the aim to understand smaller-scale geological features such as packing, mineralogy, porosity and cementation degree through point analysis and SEM scanning.
6 cores out of the 13 logged were sampled. 18 samples from those 6 cores were submitted to AGAT labs, that cut the thin sections.
Besides the petrographic description, thin sections were also used to run SEM and cathodoluminescence analyses.
2.3.3: Optical microscopy
Mineralogy, fabric and grain size distribution have been observed using planar- and cross-polarized light in optical microscope. Thin sections were prepared by AGAT labs (Calgary, AB) with polishing and staining techniques depending on the purpose of the study. For customary petrographic description aluminium was used to polish the sample, whereas diamond was used to polish samples for cathodoluminescence studies.
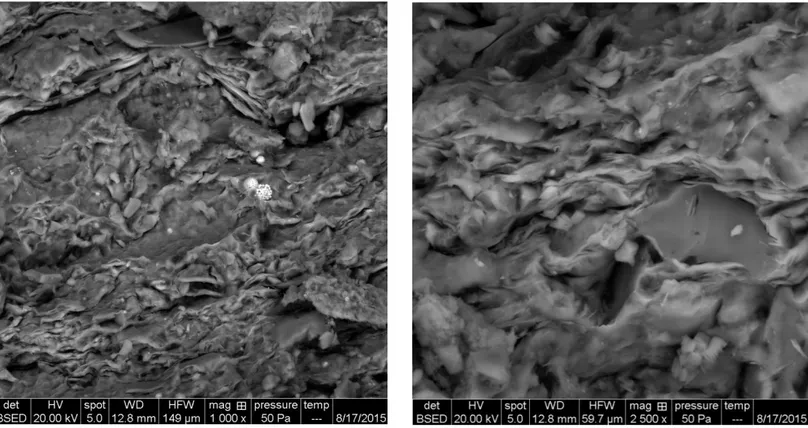
2.3.4: SEM and Cathodoluminescence
To describe in detail the grain shape and packing, 12 samples coming from 6 out of 13 cores were analysed under the electronic microscope. Out of these 6 sampled cores, 3 came from the main oil body and the other 3 from the unconventionally developed area of the Cardium. The main aim of this high detailed analysis was to compare the conventional and unconventional area of the Cardium in the Ferrier. This was necessary once it was found out that these two areas didn’t just differ in large-scale features like sand content or net reservoir thickness. Moreover, the difference in the type of produced fluid (oil vs gas) in the unconventionally developed area could be attributed just to reservoir petrophysical characteristics. SEM and cathodoluminescence analyses were mainly performed to have more data on mineralogy (chemical element maps of the thin section or sample surfaces) and
27 pore characterization (influence of clay type and volume on pore size, presence of quartz or calcite cement, 2-D pore connectivity, number of cementation phases).
The secondary electron microscope (SEM) is a tool that generates an image of a sample by shooting it with an electron beam and analysing the electron response. This analysis can be performed in low- or high-vacuum.
BSE (high-energy electrons) microscopy is characterized by low vacuum of the pressure chamber (typically 50 Pa) and high voltage (e.g. 10,000 V). Conversely, ETD (low-energy electrons) microscopy is performed with high vacuum (pressure down to 10-4 Pa) and lower voltage (e.g. 2,000 V).
As final product several BSE and ETD pictures were acquired. BSE (back-scatter electrons) images have lower quality, but at the same time a lot of advantages such as the possibility to discriminate different minerals based on shades of grey and to run EDX maps (chemical element mapping).
Conversely, using the ETD (secondary electrons, Everhart-Thornley Detector) tool, the colour just represents topographic relief, so it’s not possible to detect different minerals in the sample. However, ETD provides very high quality in the images taken, and can therefore be helpful to characterize very-small scale features such as grains and clays morphology, clay distribution and other up to a magnification of approximately 30,000 – 50,000x.
Finally, cathodoluminescence (CL) analysis registers the emission of light that occurs when the atoms of the surficial grains of the sample, after having been excited by high-energy electrons, switch from a temporary state of high-energy to their ground state (McLemore and Barker, 1987).
Cathodoluminescence analysis had the main aim to get information about the type and volume of cement and
As strongly dependant and the atomic number Z, BSE can’t discriminate between different growing phases of the same mineral, as the grain is composed by the same element (e.g. quartz) with the same atomic number.
distinguish each cementation phase.
Conversely, the discrimination between different growing phases of the same mineral is possible using CL due to different amounts of trace elements, as sourced in different time and/or from different areas.
This differentiation can’t be made using BSE imaging, as grains of the same mineral have the same Z, or EDX mapping, as trace elements are below detection limits, therefore they would appear as background noise.
Because of its high sensitivity to trace elements, CL can easily discriminate between different growing phases of a crystal or cement, as trace elements depend on the sediment sourcing area and the age of crystallization (the same area can have different trace elements in different times due to geologic reasons).
Finally, CL analysis has been used to detect the presence of chert grains, visible because of the absence of quartz overgrowth.
28
2.3.5: Petrophysical characterization
In the Ferrier area, a total of 196 wells cored the Cardium sandstone reservoir unit. Out of these, 189 had available core plug and full diameter data on GeoScout. These include depth, porosity, permeability, density and fluid saturation.
Porosity and permeability data have been used to petrophysically characterize the reservoir both in the conventionally- and in the unconventionally developed area of the Cardium. In chapter 2, Phi and k values have been adopted to find net reservoir and net pay cut-offs for reservoir mapping based on average reservoir values.
This topic will be deeply dealt with in chapter 3, that focuses on reservoir mapping and characterization.
2.3.6: Geological Mapping
Once well log cut-offs were established, a detailed reservoir mapping was performed.
The provided maps have been first contoured on GeoScout using the Surfer software, in order to understand the gross trend of the contour lines in the study area. After that, hand-contoured maps were drawn to shed light on smaller bodies and other smaller scale geological features.
In this study several maps will be provided for high-detail reservoir characterization. Among these, lithofacies mapping is shown in chapter 2 and gross reservoir and net reservoir/net pay maps are presented in chapter 3.
The net sand map (facies 3 map) represents the thickness of the reservoir interval whose GR signature was lower than 60 API. This cut-off has been picked looking at cores and well logs. The observed cores showed the presence of clean sandstones (low GR reading), and also looking at well logs we can detect the presence of a package of sediment with 30-60 API just below the E5 surface. A GR cut-off of 60 API was therefore set to discriminate between sandstones and shales in the reservoir interval.
Facies 4 mapping has been carried out looking at what was on top of facies 3. Conglomerates are identifiable because of their extremely low density porosity (usually 0 to -15% if mud supported and sideritized) and the GR reading between 60 and 75 API.
The net reservoir map shows the thickness of the good-quality (high porosity) reservoir portion of the Cardium Formation.
In this case, net reservoir maps represent net pay maps as well, because the Cardium Formation is completely hydrocarbon saturated in the Ferrier area, therefore it doesn’t contain a water leg.
In this study we will provide with two net reservoir maps with different cut-offs. The reason is that two different cut-offs are required to reflect the difference between the conventionally- and unconventionally developed portion of the Cardium in the Ferrier.
We can define net pay as the aggregate vertical thickness of reservoir quality rock that contains hydrocarbons.
29 Due to the difference between the verticals and HZs recovery factors, horizontal wells are able to produce hydrocarbons even in lower porosity conditions, that is not possible using vertical producers.
According to this, a Density Porosity (DPhi) cut-off was set at 12% for the conventionally-developed reservoir and a 6% for the unconventionally-conventionally-developed one.
These cut-offs were established based on estimated permeability thresholds for production. A value of around 0.3mD has been set as permeability cut-off for vertical production. 0.1mD is the customary reservoir permeability dividing a conventional and unconventional play, but a permeability threshold of 0.3mD has been set after looking at the production conditions of most of the vertical wells of several companies in the Cardium.
Looking at the main oil body cross-plot provided in picture 45, 0.3mD of permeability roughly matches to a core porosity of 12%. Approximating the real porosity to the density porosity, a DPhi cut-off of 12% has been accordingly proposed.
For what concerns the unconventionally-developed area of the Ferrier, the density porosity cut-off was just used to find the most perspective areas with porosity lower than 12%. Horizontal wells can produce hydrocarbons even in ultra-tight conditions (e.g. Bakken Formation, Saskatchewan), therefore a porosity cut-off for HZ wells is not used to discriminate net pay from the other portion of the reservoir. We used the 6% DPhi cut-off to discriminate between the medium-quality reservoir and the extremely tight reservoir portions.
Both these areas could be exploitable with HZ wells, but the higher the net pay and porosity*metres value and the more profitable the well will be.
It’s important to point out that, as specified above, conglomerates in well logs have usually density porosity lower than 0%. However, when the conglomerate is clast-supported and does not contain mud matrix, it has great density and core porosity. This happens in the northern gas cap area and in a small portion of the western Ferrier. Net reservoir mapping was performed using density porosity cut-offs of 6% and 12%, so in most of cases conglomerates are not included in reservoir mapping. This has been done because, if mud supported, conglomerates can be much less permeable than sands. This means a conglomerate evaluation has to be made case by case, also because it doesn’t show a linear porosity vs permeability trend like the sandstones.
Another tool we used to describe the reservoir architecture is cross-sections. Several sections were made using the highest quality well logs to unravel the geology of the Cardium in the study area.
We built cross-sections both for a general study of the pool and to solve geologic issues, such as the erosion marked by the E5 surface, quantified through parasequences correlation. The Datum for the cross sections was changed from section to section, in order to find the most suitable one.
Usually the Cardium E6 surface works pretty well in the Cardium and it has been widely used in literature (e.g. Shank and Plint, 2013, Venieri et al, 2015). In case E6 wasn’t a good datum because of erosional steps or other features that would have distorted the Cardium geometry, another surface was picked in the section. To find the most suitable horizon to set as datum, several parasequences were correlated and tested as potential datum; then, the
30 best one was selected. This is well described in the “reservoir architecture” chapter (chapter 2.4.3.4).
2.4: Results
2.4.1: Lithological characterization
Detailed core logging led to the identification of five main facies in the Cardium Formation based on mineralogy, grain size, sedimentary structures, degree of bioturbation and estimated shale volume. In case of variability within the same facies, sub-facies were identified and described as a single geologic unit.
Each facies is described below from the stratigraphically deepest to the shallowest.
2.4.1.1: Facies 1 – dark grey mudstone with thin silt laminae and few sand-sized grains
Facies 1 is composed of dark-grey, slightly to medium bioturbated mudstones with few siltstones, associated with rare discontinuous sandy horizons. The sandstone volume is approximately 5-10%, and the sandstone is concentrated in discontinuous horizons and bioturbated spots.
Sand percentage increases going stratigraphically upwards along the core, and grain size also slightly increases from shale to fine-grained siltstone.
Facies 1 shows some peculiar characteristics. First of all, it often shows pyrite-rich interval, detectable because of their colour and shininess. Iron is present also in form of siderite concretions, noticeable because of their colour and high density. Siderite concretions can be present at the top of facies 1 and 2 and are always present at the top of facies 3, also they are commonly associated to flooding surfaces. Common trace fossils are planolites sp. and
chondrites sp., other ichnofossils are rare.
Chondrites sp. are a marker of open marine influence, therefore facies 1 has been
interpreted to have deposited in a distal offshore depositional environment. The sand present in the mudstones and siltstones most likely comes from the reworking of tempestites.
31
Fig 10: facies 1 seen in core. The few sand is present as bioturbated spots (10a); a siderite concretion in facies 1 (10b).
2.4.1.2: Facies 2 – bioturbated mudstones with silty and sandy horizons
Facies 2 is made of highly bioturbated mudstones and very fine to fine sandstones, with the mud volume decreasing stratigraphically upwards. At a certain depth of the core, the sand volume increases from 20-25% to 35-45%, that’s why facies 2 has accordingly been sub-divided into facies 2a (less sandy) and 2b (more sandy).
In facies 2a, sand usually occurs in bioturbated spots and burrows fill, whereas in facies 2b is pretty common to find 5-10cm thick sand beds, usually showing starved ripples or Hummocky Cross Stratification (HCS).
Bioturbation degree is medium to high, and common trace fossils are zoophycos sp.,
chondrites sp., skolithos sp., rosalia sp. and burrowing.
Conversely with facies 2 of other Cardium fields and pools nearby (Venieri et al., 2015), Cardium facies 2 in the Ferrier looks too tight to be considered a potential halo play. Also, burrows don’t look 3D connected in core, that’s why the reservoir potential of facies 2 is almost negligible in the Ferrier area.
However, in the Western portion of the oilfield (unconventionally developed), a facies similar to facies 2 is observed between the top of the sandstones of facies 3 and the pebble lag deposit of facies 4. This facies, that we will call 2c, shows high bioturbation degree, large and connected burrows and a sand volume up to 60-70%. This facies, when present, is around 1-1.5 metres thick, and could be a potential target for horizontal wells.
Facies 2 is interpreted to have been deposited in a proximal offshore environment (offshore-transition). Water depth is interpreted to have been slightly below the fair weather wave
32 base level. The sandy horizons most likely represent tempestites, i.e. storm deposits, whereas the main deposited sediment is silt- and mud-dominated.
Facies 2a Facies 2b Facies 2c
Fig.11: facies 2 seen in core. Facies 2a is the sub-facies with the least sand content, but higher than facies 1 (11a). 2b contains around 35-40% sand volume, but bioturbation doesn’t include large burrows, so 3-D connectivity is medium-low (11b). Facies 2c has slightly more sand volume than 2b, but is characterized by the presence of large vertical and horizontal burrows, that ensure great 3-D connectivity (11c).
33
2.4.1.3: Facies 3 – clean HCS sandstones
Facies 3 is composed of clean, very fine- to medium-grained sandstones. They show visible presence of hummocky cross-stratification, which led to the interpretation of wave reworking processes in a lower shoreface depositional environment.
HCS is constant in each facies 3 interval, however other geological features can be common. Among those, the most important are ripple evidence, presence of imbricated mud clasts, fracturing, compaction faults and other.
The bioturbation degree is very low, however sometimes sands show ichnofacies like
thalassinoides sp. and ophiomorpha sp.
Most of cores analyzed have an interval in facies 3 where the customary clean sands are interbedded with laminated and undulated mudstones, with presence of bioturbation (e.g.
thalassinoides sp.). We call this facies 3a.
The shaly portions may possibly act as flow barriers, but cores are too spatially limited to prove this assumption. Anyway, the degree of bioturbation in this sub-facies of facies 3 is medium, and the big burrows and thalassinoides sp. present in this interval could help in gaining additional permeability.
34 Fig .12: f acie s 3 is ch ar act eriz e d b y h igh san d v o lu me a n d H u mmocky cro ss -stra tifi cat ion (1 2a). Biotu rb at io n d egre e i s u su ally v e ry lo w d u e t o t h e h igh en ergy o f d ep o sitio n , b u t so me ti me s ich n o facie s lik e o p h io m o rp h a sp . ar e p re se n t (12b ). Su b facie s 3a o ccurs wh en wa vy mu d in terb ed s a re p re se n t with in t h e H CS san d sto n es . Faci e s 3a th ic kn e ss u su ally d oe sn ’t ex ce ed 50 c m .
35
2.4.1.4: Facies 4 - conglomerates
Facies 4 is composed of conglomerates with a mudstone/siltstone (occasionally sandstone) matrix. The contact with facies 3 is usually sharp with scouring evidence, which has led to an interpretation of an erosional surface. According to Plint et al. (1986), the conglomerates most likely represent a transgressive pebble lag deposit, i.e. a residual deposit left in place by the rising relative sea level.
Conglomerates of facies 4 are well-rounded, poorly sorted and usually matrix supported, but clast supported horizons are present. Where present, the clast supported conglomerates may account for a significant local contribution to the permeability of the reservoir, but just if fractured or encased into sandy matrix.
Concerning grain mineralogy, multi-colour chert seems to be the most common among coarse-sized particles.
A lot of debate is still present among different scientists about the pebble deposition and the source area.
First of all, to erode and transport gravel-sized particles, the sourcing area of the pebbles must be close to the basin, and also the stream competence must be high enough to transport coarse-sized grains.
Pebbles of facies 4 don’t represent a random, one-in-a-while flooding event, as the lag is visible in each Cardium field and always on the top of facies 3 sandstones.
Because of the mountains proximity, a first interpretation is that the raising cordillera was the source area of the gravel. As an in-forming orogeny, the Rocky Mountains grew through several tectonic pulses. This is probably the reason for the erosion and transport of the coarse-sized grains, as any raising body becomes more and more affected by isostasy due to different potential energy between topographic highs and lows.
Gravel sourcing area must have been close to the basin, so that the gravel could reach the deposition site.
This has probably been made possible because of an increase in impulse strength. The thrust front consequently migrated basinwards, and the distance between the sourcing area and the basin decreased.
This is also supported by the fact that conglomerates are mainly made of chert. Several studies documented exposures of Paleozoic limestones with abundant chert beds and nodules in the cordilleran thrust belt at the time of deposition of the Cardium clastic wedge (e.g. Bergman & Walker, 1987; Bergman and Walker, 1988; Walker & Eyles, 1988).
Once deposited, the pebbles have been re-organized by wave energy and/or oceanic currents in gravel bars, as described in facies 4 mapping (chapter 2.4.3.3). Reworking processes also scientifically explain the well-roundness of the chert grains.
Re-organization od pebbles into bars is also well documented in previous studies (e.g. Bergman and Walker, 1987; Plint, 1988; Walker and Eyles, 1988; Pattison and Walker, 1992; Shank and Plint, 2013; Wiseman, 2014).
Talking about sequence stratigraphy, the pebbles are interpreted to have deposited during a relative sea level drop caused by the huge amount of sediment eroded from the raising
36 mountains. After the pebbles depositional event, relative sea level rose when the tectonic impulse ceased, or when it decreased in strength and sediment supply could no longer keep up with sea level transgression. Pebbles have afterwards been reworked by wave action in the shoreface.
If this theory is reliable, then tectonic impulses of the growing Cordillera could have played a huge role in the Cardium architecture and facies.
According to this interpretation, some of the Cardium oilfields could have been generated in the following way:
- step 1: mountains raising rate is constant, sediment is eroded, transported and deposited as sand-sized particles (longer transportation and greater distance from the gravel front, that is more landwards)
- step 2: a tectonic impulse occurs and the growing rate of the mountains becomes very high. To contrast the raising Cordillera, a lot of sediment is eroded.
Tectonic impulses obviously match with a faster migration of the thrust front towards the basin. This makes the gravel front and the sourcing area get closer to the basin. Gravel sized-particles are then transported and deposited beyond the shoreline. - Step 3: the impulse decreases in strength, that means the sediment is not enough to
prevent relative sea level from rising. Facies 5 is deposited and mud deposition begins.
37
Fig.13: facies 4 seen in core. Conglomerates are poorly sorted and can occur as thick (>1m) horizons or centimetric spots interbedded with mudstones. Facies 4 can be either clast- or mud-supported. The first situation is the most favourable for production, but conglomerates can be a prolific producer also if mud-supported thanks to fracturing and other geologic features.
38
2.4.1.5: Facies 5 – laminated, bioturbated dark grey mudstones
Facies 5 is composed of dark-grey, laminated mudstones and siltstones, interpreted to have been deposited in a low energy offshore depositional environment. Facies 5 is discernible from facies 1 due to its very low bioturbation degree, with respect to the slightly more bioturbated fine grained deposits classified as facies 1.
Fig.14: facies 5 seen in core. Although similar to facies 1, facies 5 stands out for the almost total absence of bioturbation. In these facies sometimes the E6 surface is visible in core. It is placed either when sands stops to be visible or in presence of a pebbly horizon, marking a minor flooding surface.
39
2.4.1.6: Cardium type log
In the Ferrier oilfield, the type log for the Cardium Formation is shown in well 100/02-30-039-7W5/00. This well has a core in the Cardium producing interval. The core has been logged, and in this well we can see all the log responses of the different lithofacies described in the previous chapter.
Facies 1 has high GR reading (>90 API), low density porosity (<3%) and low resistivity.
Facies 2a is very similar to facies 1, and therefore difficult to quantify in well logs, due to its low sand content and the gradational contact with facies 1.
Facies 2b can be identified in well logs because of the slight decrease in GR (increasing sand content), and the increasing density porosity.
Facies 3 is easily detectable in petrophysical logging because of the generally sharp contact with facies 2, the low GR and high density porosity and resistivity (if hydrocarbon saturated like in the Ferrier area).
In case this facies shows small and thin bumps towards higher GR, that is index of facies 3a. Facies 4 is visible in well logs due to the GR signature usually ranging from 60 to 75 API, i.e. slightly higher than facies 3 and lower than facies 1-2a and 5. Moreover, density porosity is lower down to -15 %. This because the pebbles are encased in mud, and there are cement concretions that tighten the rock and increase its density. However it’s important to remember that secondary porosity and permeability make the conglomerate the most permeable reservoir in the Ferrier area.
The resistivity log is not shown in the picture as its importance is secondary for the purpose of the picture itself, as Gamma Ray, Density and Neutron logs are much more efficient to distinguish facies based on petrophysical values. Also, the Cardium Formation is all hydrocarbon saturated in the Ferrier area, therefore resistivity logs are not primary sources of information except eventually identifying eventual zones with higher gas saturation (higher resistivity value).
40
Fig.15: Gamma ray and density/neutron logs of the Cardium Formation in the type well of the Ferrier. Each facies in identified from the variation of one or more log readings.The black box represents top and bottom depth of the core taken in the Cardium reservoir, whereas the blue comb and the adjacent blue line represent the completed interval of the well, as well as the Enhanced Oil Recovery (EOR) technique, that in this case consists in fracturing of vertical wells.
The principal E-T surfaces are marked, as well as the top and bottom limits of the sedimentary facies.
The well log also shows the depth range of the cored interval (black box), that is roughly from 2117m to the top of the picture. As this core has been logged, a detailed core logging sheet is posted below to show the match between well logs thicknesses and core ones.
2a
1
2b
3
4
5
2120 m 2115 m100/02-30-039-7W5/00
0 GR 150 60 DPhi 0 60 NPhi 0E6
4
E5
4
3a41
Fig.16: core logging sheet and core plot of well 100/02-30-039-07W5/00. Facies 3 thickness is around 5 meters, and the main pebble-rich horizon is around 2.5 meters thick. There is great match between well logs, core plot and physical core logging thicknesses.
clay silt vf f m c vc gravel
100/02-30-039-07W5/00
E5 E6
42
2.4.2: Petrological characterization
Petrological characterization has been applied to the fine-grained facies of petroleum interest, i.e. facies 3.
Facies 2 has been observed as well to have a first idea of its petroleum potential, as routine core analyses had never been taken in this tight facies before in the Ferrier area.
In the following sections, porosity appears as blue spots due to the presence of the epoxy resin.
2.4.2.1: Facies 2
Facies 2a wasn’t considered because of its negligible petroleum potential. Facies 2b and 2c have been analyzed in thin section in several contests using multiple magnifications. Facies 2b was sampled both in sand filled burrows and in interbedded storm beds.
The first shown picture shows the geological micro-features of facies 2 as sand filled burrow. Burrowing can account for a significant amount of permeability, but not in this case, as burrows are thin and not enough long and laterally extended to be a decent reservoir.
This thin section has been taken in a strongly burrowed portion of facies 2b in the cored well 100/06-17-038-07W5/00. When large burrows are present, the sandstone often has much better reservoir properties than undisturbed facies 2.
As visible from the thin section, most of the mineralogy is composed by quartz grains (around 75% of the minerals), then there is presence of lithic grains (20-25%) and 0 to 2% of mica. Usually this facies is very tight, but in some spots, like the one shown below, a few porosity can be present. However, the low lateral extent of the burrows and their non-interconnection make the porosity much less effective.
Porosity and permeability is medium in sand filled burrows due to biotic reworking. When facies 2b occurs as bioturbation of thin (max 10-15 cm thick) sand storm deposits, reworking is noticed to be less efficient, that mean porosity and permeability are extremely low.
This can be observed in well 100/02-30-039-07W5/00, where one of these bioturbated sandy horizons has been sampled.
In this case, as we can see from the thin section, the sample is much tighter and cemented, and has much lower reservoir characteristics even having the same grain size.
43
Fig.17: sand filled burrow (facies 2b) in well 100/06-17-38-07W5/00 seen in planar- and cross-polarized light (10x). Quartz and rock fragments accounts for the majority of the clasts, and a few microporosity is present in localized spots.
44
Fig.18: sand storm bed (facies 2b) in well 100/02-30-039-07W5/00 under planar- and cross-polarized light. Very few micro-porosity evidence and mineralogy analogous to the previous picture. Magnification is 10x.
45 Facies 2c has been observed in thin section as well to assess its petroleum potential. The sample has a medium quantity of porosity. This is most likely 3D connected, because of the interconnection between large burrows.
The mineralogy of this strongly burrowed interval is very similar to facies 2b, with quartz and lithics being the most common grains.
Fig.19: facies 2c under planar- and cross-polarized microscope in well 100/16-15-038-08W5/00. Effective intergranular porosity is present. Being this facies characterized by large inter-connected burrows, it could be a next target for halo play in the Cardium Formation in the near future. Magnification is 10x.
46
2.4.2.2: Facies 3
Most of the optical microscopy and all of the SEM work has been applied to facies 3. First of all because it’s the main oil and gas producer together with facies 4, and also to understand the difference between the conventionally- and unconventionally developed Cardium reservoir.
Particular attention has been payed to sub-facies 3a (HCS sandstones interbedded with laminated and undulated mudstones) to characterize potential flow barriers among the clays. The next picture shows how facies 3 looks like in its top portion, just deeper than the customary cemented sandstones that we always observe in core.
The mineralogy is very similar to the sandstones of facies 2b and 2c, with a major percentage of quartz grains, a few lithics and rare mica and plagioclase. In the provided pictures, micas and plagioclases are visible in cross-polarized light. With both the polarizers inserted, micas show bright colours and plagioclases show visible geminates .
The thin sections shown can give an idea of the reservoir characteristics of facies 3. The sandstones in the main oil body have great porosity and permeability. The sand shown below has a porosity around 18% and a permeability of 2 to 3mD.
47
Fig.20: top portion of facies 3 under planar- and cross-polarized light in well 100/02-30-039-07W5/00. Mineralogy doesn’t change from the one observed in facies 2b and 2c. The main mineralogical and petrophysical features are marked in the pictures (MP: micro-porosity; IP: intergranular porosity; RF: rock fragment; QTZ: quartz; PLAG: plagioclase; MICA: mica). In evidence the great porosity of the sample, that is around 20%.
The following pictures show how the sand looks like in the middle-lower portion of the reservoir. The petrophysical properties are worse than the top part, but the mineralogy doesn’t change.
The thin sections, shown in both planar- and cross polarized light, still show massive presence of quartz, few lithics and very few plagioclases and small mica flakes.
Porosity, marked by the blue epoxy-filled spots, is lower than the top portion of the sandstones, but the sample still shows profitable reservoir characteristics.
IP RF
MP
PLAG
MICA QTZ
48
Fig.21: middle portion of facies 3 observed under planar- and cross-polarized light in well 100/02-30-039-07W5/00. Mineralogy is analogous to the one observed in the previous picture. The sample shows lower petrophysical characteristics than the top portion of the reservoir. The main mineralogical and petrophysical features are marked in the pictures ( MP: micro-porosity; IP: intergranular porosity; RF: rock fragment; QTZ: quartz; PLAG: plagioclase).
Concerning small-scale features of facies 3, detailed SEM and EDX (chemical element) analysis have been performed. The following picture shows the general grain shape and packing. Quartz grains, detectable from conchoidal fracturing and proper shape and aspect, don’t appear weathered. The other grains, conversely, appear fractured and altered by
RF
MP IP
PLAG QTZ
49 physical and chemical weathering. The latter most likely represent other minerals less stable than quartz, or simply grain coating due to authigenic clays growth.
Fig.22: an example of how facies 3 looks like under the SEM. This picture has been used as base map for EDX (chemical element) mapping shown in the next pictures.