Induction of death receptor 5 expression in tumor vasculature by perifosine restores the vascular disruption activity of TRAIL-expressing CD34+ cells
Journal: Angiogenesis
Arianna Giacomini,1,2 Marco Righi,2,3 Loredana Cleris,4 Silvia L. Locatelli,1,2 Stefania Mitola,5 Maria Grazia Daidone,4 Alessandro M. Gianni,6,7 Carmelo Carlo-Stella 1,2
1
Department of Oncology and Hematology, Humanitas Cancer Center, Humanitas Clinical and Research Center, Rozzano - Milano, Italy; 2
Department of Medical Biotechnology and Translational Medicine, University of Milano, Milano, Italy; 3
National Research Council, Institute of Neuroscience, Milano, Italy; 4
Experimental Oncology, Fondazione IRCCS Istituto Nazionale Tumori, Milano, Italy; 5 Department of Molecular and Translational Medicine, University of Brescia, Brescia, Italy; 6
Medical Oncology, Fondazione IRCCS Istituto Nazionale Tumori, Milano, Italy; 7
Department of Medical Physiopathology and Transplants, University of Milano, Milano, Italy
Corresponding authors:
Carmelo Carlo-Stella, M.D. - Department of Onco/Hematology, Humanitas Cancer Center - Humanitas Clinical and Research Center - Via Manzoni, 56 - 20089 Rozzano (Milano), Italy
Phone: +39 02 8224 4577 - Fax: +39 02 8224 4590 - e-mail: [email protected]
Alessandro M. Gianni, M.D. – Medical Oncology – Fondazione IRCCS Istituto Nazionale Tumori - Via Venezian 1 - 20133 Milano, Italy
0 1 2 3 4 5 6 7 8 9 10 11 12 13 14 15 16 17 18 60
80 100 120
Days from start of treatment
% o f in it ia l b o d y w e ig h t (± S E M ) Ctrls Perifosine 10 mg/Kg 0 1 2 3 4 5 6 7 8 9 10 11 12 13 14 15 16 17 18 60 80 100 120
Days from start of treatment
% o f in it ia l b o d y w e ig h t (± S E M ) Ctrls Perifosine 15 mg/Kg 0 1 2 3 4 5 6 7 8 9 10 11 12 13 14 15 60 80 100 120
Days from start of treatment
% o f in it ia l b o d y w e ig h t (± S E M ) Ctrls Perifosine 25mg/Kg/d ! 0 1 2 3 4 5 6 7 8 9 10 11 12 13 14 60 80 100 120
Days from start of treatment
% o f in it ia l b o d y w e ig h t (± S E M ) Ctrls Perifosine 35 mg/Kg/d ! ! a b c d
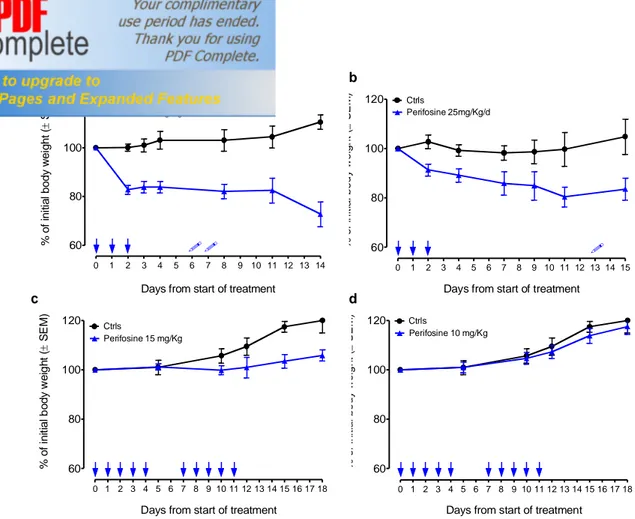
Fig. S1 In vivo dose finding of perifosine
As an index of systemic toxicity, changes in body weight after oral perifosine administration were assessed. (a) One 3-days course of oral (PO) perifosine at 35 mg/Kg/day caused a significant loss of body weight and was lethal for 2/5 of treated animals. (b) One 3-days course of oral (PO) perifosine at 25 mg/Kg/day caused a significant loss of body weight and was lethal for 1/6 of treated animals. (c) Two 5-days courses of oral (PO) perifosine at 15 mg/Kg/day and (d) two 5-days courses of oral (PO) perifosine at 10 mg/Kg/day were well tolerated and did not cause any significant loss of body weight. Skulls indicate dead animals. Autopsy of dead animals revealed swollen stomach and intestines and yellowish-white brittle liver, suggesting gastrointestinal toxicity as cause of death
Va sc ul at ur e p-A kt S er 47 3 M er ge Ctrl Perifosine Lung Ctrl Perifosine Liver Ctrl Perifosine Spleen
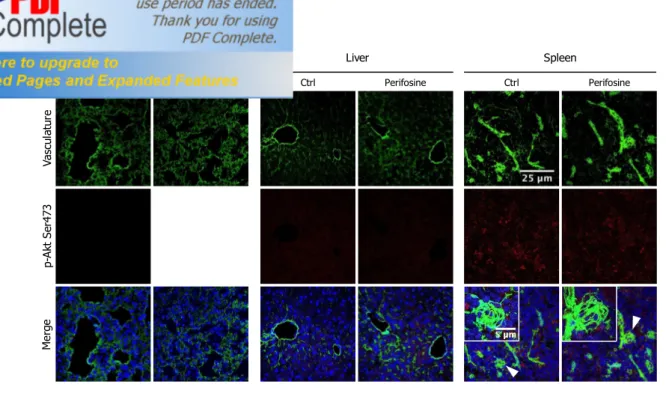
Fig. S2 Perifosine does not affect phospho-Akt expression in healthy organs
NOD/SCID mice bearing subcutaneous tumor nodules were treated with perifosine at 15 mg/kg (once daily for 5 days, PO), or the vehicle control. Immediately prior to sacrifice, mice were IV injected with 0.2 ml of sulfo-NHS-LC-biotin (5 mg/ml) to biotinylate functional vasculature. Healthy organs (including lungs, livers and spleens) were then harvested, freshly snap-frozen in isopentane and analyzed for phospho-Akt expression. Representative confocal images of lungs, livers and spleens from perifosine-untreated and treated mice processed by triple immunofluorescence staining are shown. Biotinylated endothelial cells were detected by green staining with Alexa 488-conjugated streptavidin; phosphorylated Akt was detected by red coloration incubating sections with an anti-mouse phospho-Akt antibody followed by the appropriate Alexa Fluor 568-conjugated secondary antibody; cell nuclei were detected in blue with TO-PRO-3 nuclear dye. Arrowheads indicate the field magnified in inserted images. Objective lens, original magnification: 1.0 NA oil objective, 40x; scale bar 25 µm. Inserted images objective lens, original magnification: 1.4 NA oil objective, 60x; scale bar 5µm
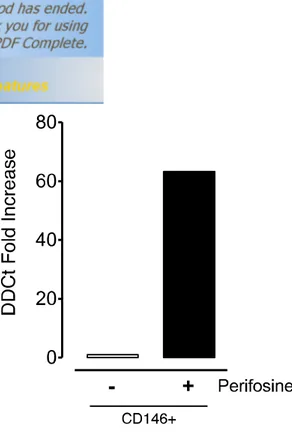
Fig. S3 DR5 expression in TECs is modulated by perifosine at mRNA level
CD146+ subpopulations obtained from SU-DHL-4V tumor nodules from mice receiving the vehicle control or perifosine at 15 mg/kg (once daily for 5 days, PO) were processed for RT-PCR analysis to evaluate relative fold increase in DR5 expression. Data in the graph are the results obtained by the analysis of TECs derived from a pool of three tumors per group
Fig. S4 Tumor cells differentially affect TECs phenotype
2H-11 cells were co-cultured for 72 hours with either SU-DHL-4V or KMS-11 cells (2H-11: tumor cells ratio 1:4) in presence (black bars) or absence (white bars) of perifosine 5 µM and analyzed for DR5 expression by flow cytometric analysis. Represented are the mean ± SD percentage of positive cells. The percentages of positive cells were measured according to gates set on the basis of isotype control
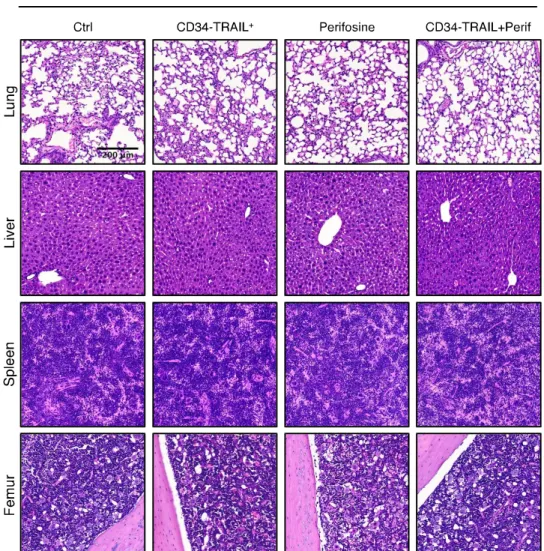
Fig. S5 Perifosine-induced enhancement of the vascular disruption activity of CD34-TRAIL+ cells is tumor restricted
NOD/SCID mice bearing subcutaneous tumor nodules were randomly assigned to the different treatment groups consisting of the administration of one injection of CD34-TRAIL+
cells (3 x 10⁶ cells/mouse, IV); perifosine at 15 mg/kg (once daily for 5 days, PO); CD34-TRAIL+
cells in combination with perifosine; or the vehicle control. Seventy-two hours after CD34-TRAIL+
cell treatment and three hours after the last perifosine administration, healthy organs (including lungs, livers, spleens and femurs) were harvested, fixed in formalin, embedded in paraffin and analyzed for the presence of hemorrhages and necrosis. Representative histological images of healthy organs from untreated and treated animals are shown. Hematoxylin and eosin staining demonstrates the absence of tissue or vascular damage. Objective lens, original magnification: 0.40 NA dry objective, 10x; scale bar: 200µm b a KMS-11 C tr l P e ri fo s in e SU-DHL-4V C tr l P e ri fo s in e c 0 10 20 30 S U -D H L -4 V a p o p to s is ( % ) *** − + Perifosine 0 10 20 30 K M S -1 1 a p o p to s is ( % ) *** − + Perifosine 0 0.625 1.25 2.5 5 10 0 20 40 60 80 100 Perifosine (! M) V ia b le C e ll C o u n ts ( % C tr l) 48 hrs 24 hrs 72 hrs 0 0.625 1.25 2.5 5 10 0 20 40 60 80 100 Perifosine (! M) V ia b le C e ll C o u n ts ( % C tr l) SU-DHL-4V KMS-11
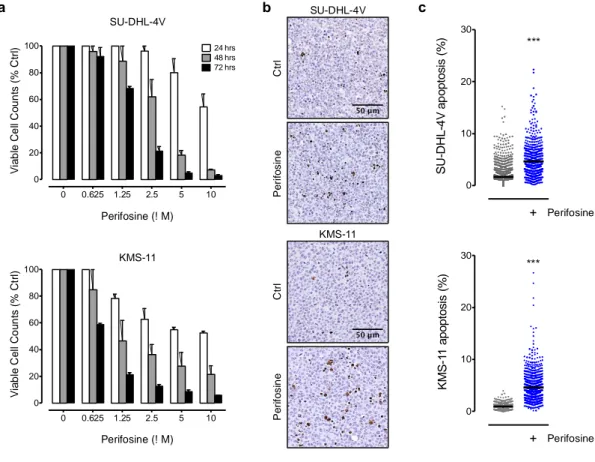
Fig. S6 In vitro and in vivo effects of perifosine on tumor cells
(a) SU-DHL-4V and KMS-11 cells were exposed for 24, 48 and 72 hours to increasing doses of perifosine and analyzed by Annexin-V–fluorescein isothiocyanate/propidium iodide (PI) double
staining to detect Annexin-V−/PI− viable cells by flow cytometry. The mean ± SD percentages are shown. (b) NOD/SCID mice bearing subcutaneous tumor nodules were randomly assigned to the different treatment groups consisting of the administration of perifosine at 15 mg/kg (once daily for 5 days, PO) or the vehicle control. Three hours after the last perifosine administration, tumor nodules were harvested, fixed in formalin, embedded in paraffin and analyzed for the presence of apoptotic cells by TUNEL staining. Representative histological images of TUNEL-stained tumors sections from untreated and perifosine-treated animals are shown. Objective lens, original magnification: 0.40 NA dry objective, 20x; scale bar: 50µm. (c) TUNEL stained SU-DHL-4V and KMS-11 whole tumor sections were digitally acquired and images analyzed using ImageJ for quantification of the percentage of apoptotic cells. At least three tumor sections from different animals were analyzed per treatment group. Each dot represents the value obtained from the analysis of a single tissue field, and the lines indicate the mean values. *** P < 0.001 compared with controls