UNIVERSITY OF CASSINO
AND SOUTHERN LAZIO
Ph.D. in Methods, models and technologies for engineering
Curriculum: Mechanical EngineeringXXXII Cycle
Experimental Assessment of a Prototype Hollow Cone
Spray Diesel Injector by Means of Spray and Engine
Characterization
SSD: ING-IND/08
Coordinator
Chiar.mo Prof. Wilma Polini Roberto IannielloPh.D. Candidate
Supervisor
Chiar.mo Prof. Gustavo Fontana Co-supervisor
Dr. Ing. Carlo Beatrice Dr. Ing. Gabriele Di Blasio Dr. Luigi Allocca
ABSTRACT
2
ACKNOWLEDGMENTS
I want to express my gratitude to several people that have provided me with immense support throughout this project. I would like to thank my supervisors Dr. Carlo Beatrice, and Dr. Luigi Allocca, they gave me the opportunity to conduct my research at Istituto Motori under his guidance and supervision, I am thankful for the opportunity to work on very interesting research projects in the field of advanced combustion engines. I am particularly thankful for their guidance and help for the past three years to Dr. Gabriele Di Blasio and Dr. Maurizio Lazzaro, especially for his discussions and support during the experiment activities and for all hours spent with me during all Ph.D. studies. Also, I would like to thank Professor Gustavo Fontana and Professor Enzo Galloni at Cassino University for the help and useful discussions related to the thermodynamic and combustion engines.
I would also like to thank all fellow colleagues at Istituto Motori, in particular, Alessandro Montanaro and Daniele Piazzullo.
A debt of gratitude is owed by the Istituto Motori technicians: A. Schiavone, R. Maniscalco, and A. Piccolo that supported the research activities with the installation of the mechanical and electronic systems.
Most importantly, I wish to extend thanks to my parents and my sister, for their love and continued the support throughout all my life and for encouraging me to follow my dream. Special thanks to Albino for all his support and comprehension. I thank Federica for her love, patience, understanding, and for putting up with me during this research.
The activities reported in the present thesis were performed in the framework of the MIUR project PON01_2238
I
ABSTRACT
The application of more efficient combustion concepts requires the advancement of fuel injection technologies. The injector nozzle is the most critical component of the whole injection system for its impact on the combustion process. It is characterized by the number of holes, diameter, internal shape, and opening angle. The reduction of the nozzle hole diameter seems the simplest way to promote the atomization process, but consequently, the number of holes should increase to keep constant the injected fuel mass. This logic has been applied to the development of a new generation injector. First, the tendency to increase the nozzle number and to reduce the diameter has led to the replacement of the nozzle with a circular plate. The vertical movement of the needle generates an annulus area for the fuel delivery on 360 degrees, so controlling the atomization as a function of the vertical plate position, capable of generating a hollow cone spray. Second, on the base of the obtained results, different configurations were introduced. These new configurations are characterized by a hybrid fuel injection concept, composed of preferential fuel jets, generated via a specific design of the internal nozzle geometry, and additional circle-shaped fuel injection, to use the air between the jets. An additional hollow cone nozzle injector was designed, characterized by a higher spray cone angle with respect to the first prototype.
The experimental investigation of all new configurations has been performed on a combustion vessel, to characterize the spray evolution in a quiescent ambient in engine-like conditions by means of optical diagnostic techniques, and on a single-cylinder engine to assess the injectors performances by varying the main control parameters (electrical command, nozzle tip protrusion, test point, and calibration parameters). A more in-depth investigation of the injector characteristics in different conditions has also been performed thanks to the hydraulic characterization on the hollow cone nozzle prototype. On the base of optical and fluid dynamic diagnostics, a CFD code was also validated in evaporative and non-evaporative conditions.
The optical analysis showed a high spray evaporation rate, and the aspect also emerged in the engine results. The hydraulic characterization by Bosch tube meter highlighted a high flow rate with small needle lift and reduced hydraulic delay, compared to conventional multi-hole. The numerical simulation allowed pointing out
ABSTRACT
II
a rapid breakup process immediately for the HCN injector. In general, the latest versions of hybrid injectors have achieved quite similar performances, in terms of spray penetration, compared to the conventional multi-hole nozzle, while guaranteeing a different fuel distribution.
Based on the engine results, the HCN multi-jets versions guarantee better performance in comparison to the HCN old version, but it has not yet reached a level as to be considered a valid alternative to MHN. The hybrid version of HCN, thanks to the increase of the number of jets, has the potential to improve the overall spray-combustion chamber interaction further and then the engine performance.
III
TABLE OF CONTENTS
ABSTRACT ... I List of Publications ... VI List of Figures ... VIII List of Tables ... XV Abbreviations ... XVI
INTRODUCTION ... 1
References ... 6
CHAPTER 1 Compression-Ignition Engine ... 7
Combustion-Engine Challenges ... 7
Conventional Diesel Combustion (CDC) ... 9
Low-Temperature Combustion (LTC) ... 11
Homogeneous Charge Compression Ignition (HCCI) ... 12
Reactivity Controlled Compression Ignition (RCCI) ... 12
Partially Premixed Combustion (PPC)... 13
Emissions after-treatment vs. combustion concept ... 13
Injection System ... 14
Common-Rail Injection System ... 14
Injectors ... 16
Fuel Injector Technology ... 16
References ... 22
CHAPTER 2 Spray characteristics ... 25
Background ... 25
Spray Structure ... 26
Atomization Process ... 26
Cavitation ... 27
Measurement Parameters ... 28
Structure of Engine Spray ... 29
2.5.1 Full-Cone Spray ... 30
2.5.2 Hollow-Cone Spray ... 31
IV
2.6.1 Direct imaging method ... 32
2.6.2 Laser Absorption Scattering (LAS) Technique ... 33
2.6.3 Schlieren technique ... 36
References ... 40
CHAPTER 3 Experimental Setup ... 42
3.1 The prototype injectors ... 43
3.2 Spray characterization ... 45
3.3 Hydraulic Characterization ... 49
3.4 Single Cylinder Research Engine ... 51
3.4.1 Heat Release Analysis, efficiency, and energy balance. ... 53
3.4.2 Emissions Measurement System ... 55
3.5 Fuels ... 56
References ... 57
CHAPTER 4 Digital image processing ... 59
4.1 Software for digital image processing ... 60
4.2 State of the art ... 60
4.3 Segmentation model ... 62
4.3.1 Curvature and Total Variation Filters ... 62
4.3.2 Image Processing ... 63
References ... 86
CHAPTER 5 Hollow-Cone Nozzles Characterization ... 89
5.1 Introduction ... 89
5.2 Hydraulic characterization HCN ... 90
5.2.1 Supply Voltage Effect ... 91
5.2.2 Injection Rate Measurements ... 92
5.3 Spray Characterization ... 95
5.3.1 Voltage command effect ... 97
5.3.2 Nozzle Deterioration Effect ... 104
5.3.3 Injection Parameters Effect ... 106
5.4 Experimental and Numerical Comparison ... 115
5.4.1 The code ... 115
5.4.2 Numerical Results ... 117
5.5 HCN vs. MHN ... 122
References ... 125
CHAPTER 6 Engine Results ... 128
V
6.2 Test methodology ... 131
6.3 Injection parameters analysis ... 136
6.4 HCN-J vs. MHN ... 139
6.5 Start of Injection ... 144
6.6 Rail pressure ... 147
6.7 Medium load analysis ... 152
References ... 155
VI
L
IST OF
P
UBLICATIONS
− “Balancing Hydraulic Flow and Fuel Injection Parameters for Low Emission
and High-Efficiency Automotive Diesel Engines”
Author(s): G. Di Blasio, C. Beatrice, R. Ianniello, F. C. Pesce, A. Vassallo, G.
Belgiorno, G. Avolio
Affiliated: Istituto Motori CNR, General Motors, Continental Event: 14th International Conference on Engines & Vehicles
− “Key Fuel Injection System Features for Efficiency Improvement in Future Diesel Passenger Cars”
Author(s): G. Di Blasio, C. Beatrice, R. Ianniello, F. C. Pesce, A. Vassallo, G.
Avolio
Affiliated: Istituto Motori CNR, General Motors GPS - Torino, GM Global
Propulsion Systems, Continental Corp
Event: WCX SAE World Congress Experience 2019
− “Combustion and Emission Characteristics of a Compression Ignition Engine
Fuelled with Diesel-LPG Blends”
Author(s): R. Marialto, L. Sequino, G. Di Blasio, R. Ianniello, M. Cardone Affiliated: Istituto Motori CNR, Universita di Napoli
− “Image Processing of Vaporizing GDI Sprays:a New Curvature-Based
Approach”
Author(s): M. Lazzaro, R. Ianniello
Affiliated: Istituto Motori CNR, Università di Cassino e del Lazio Meridionale Journal: Measurement Science and Technology, MST-105979.
− “Numerical Analyses of Spray Development and Combustion Process with
Diesel-Gasoline-Ethanol Mixtures in Compression-Ignition Engines”
Author(s): G. Fontana, E. Galloni, R. Ianniello, D. Lanni, C. Beatrice, G. Di
Biasio
Affiliated: Istituto Motori CNR, Università di Cassino e del Lazio Meridionale Event: AIP Conference Proceedings December 2019 2191.
VII
− “Outward-Opening Hollow-Cone Spray Characterization by Experimental
and Numerical Approach in Evaporative and Non-Evaporative Conditions”
Author(s): A. Montanaro, M. Migliaccio, L. Allocca, C. Beatrice, V. Fraioli,
R. Ianniello
Affiliated: Istituto Motori CNR, Università di Cassino e del Lazio Meridionale Event: 13th International Conference on Engines & Vehicles, ICE17,
2017-24-0108.
− “Outwardly Opening Hollow-Cone Diesel Spray Characterization under
Different Ambient Conditions”
Author(s): A. Montanaro, L. Allocca, C. Beatrice, R. Ianniello
Affiliated: Istituto Motori CNR, Università di Cassino e del Lazio Meridionale Event: International Powertrains, Fuels & Lubricants Meeting 2018
− “Combined Experimental and Numerical Investigation of the ECN Spray G
under Different Engine-Like Conditions”
Author(s): D. Paredi, T. Lucchini, G. D'Errico, A. Onorati, A. Montanaro, L.
Allocca, R. Ianniello
Affiliated: Istituto Motori CNR, POLIMI,
Event: WCX SAE World Congress Experience 2018
− “Fuel distribution of a GDI spray impacting on a heated wall: liquid and vapour phases”
Author(s): A. Montanaro, L. Allocca, R. Ianniello, G. Meccariello
Affiliated: Istituto Motori CNR, Università di Cassino e del Lazio Meridionale Event: ICLASS 2018, 14th Triennial International Conference on Liquid
Atomization and Spray Systems, Chicago, IL, USA.
− “Acoustic and imaging correlations of a GDI single-hole spray”
Author(s): A. Montanaro, L. Allocca, R. Ianniello, D. Siano, M. Panza Affiliated: Istituto Motori CNR, Università di Cassino e del Lazio Meridionale Event: ICLASS 2018, 14th Triennial International Conference on Liquid
VIII
L
IST OF
F
IGURES
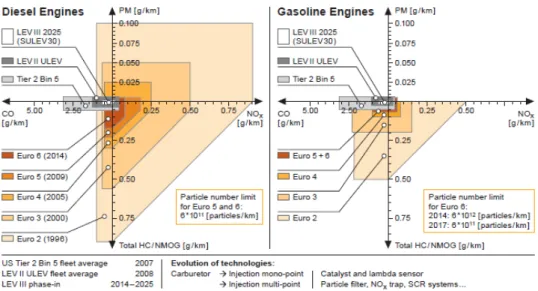
Figure 1.1 - Historical evolution of European emission limits for Diesel and Gasoline engines and some US references. ... 7 Figure 1.2 - Main UN agreements driving the EU CO2 emission policy. ... 8
Figure 1.3 - Typical heat release rate identifying different conventional diesel combustion phases [2]. ... 10 Figure 1.4 - Schematic of a diesel flame with temperatures and chemistry[11]. ... 11 Figure 1.5 - Emission formation as a function of Φ and T. Combustion paths for HCCI,
PPC, and conventional diesel combustion are indicated by the blue, green, and orange lines. The increased dilution of fuel with air in HCCI and PPC gives a higher combustion-zone heat capacity. This reduces T and Φ, and the emission-formation zones can be avoided [13]. ... 11 Figure 1.6 - Engine combustion research concepts compared to conventional SI and
DICI. Blue indicates a reactive fuel like diesel, while orange indicates a none-reactive fuel like gasoline[14]. ... 13 Figure 1.7 - Simplistic overview of emissions after-treatment systems versus
combustion concepts. ... 14 Figure 1.8 – Scheme of the common rail system [16]. ... 15 Figure 1.9 - Solenoid injector [15]. ... 18 Figure 1.10 - Piezoelectric injector. (a) Main and pilot-valve stages. (b) Pilot valve at
opening of the needle. (c) Pilot valve at needle closure. (d) Nozzle enlargement [35]. ... 20 Figure 2.1 - Illustration of the spray formation process and the different spray regions. ... 27 Figure 2.2 - The influence of the internal nozzle design and pressure (increasing from
left to right). Adapted from [4]. ... 28 Figure 2.3 - Break-up of a full-cone diesel spray. [9] ... 30 Figure 2.4 - Spray development during injection (Stegemann J, Seebode J, Baltes J,
Baumgarten C, Merker GP, 2002 [26]), Prail = 70 MPa, Pback = 5 Mpa, Tair = 890
K . [9]. ... 31 Figure 2.5 - Mechanism of a primary breakup for a full-cone diesel spray. [9]. ... 31
IX
Figure 2.6 - Hollow-cone diesel spray. Example: outward opening nozzle. [9]. ... 32
Figure 2.7 - Optical set-up for direct imaging of spray [10]. ... 32
Figure 2.8 - Principle of LAS Technique. ... 33
Figure 2.9 - Extinction Images of p-Xylene Non-Evaporating Spray at Two Wavelengths 𝜆𝑇: =532nm and 𝜆𝐴=266nm. (Z is the axial distance from the nozzle tip) [12] ... 34
Figure 2.10 - Bouguer-Lambert-Beer’s Law. ... 35
Figure 2.11 - Schlieren system, [14] ... 37
Figure 2.12 - Basic dimensions of Schlieren system, [14] ... 38
Figure 2.13 - Deflection of light beams through an area of circular symmetrically distributed variation of refraction index, [14] ... 39
Figure 3.1 – Spray pattern structure comparison. ... 43
Figure 3.2 - Spray delivering section. ... 44
Figure 3.3 – Needle-lift vs. supply voltage. ... 45
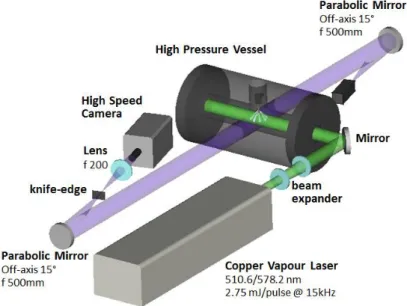
Figure 3.4 - Optical high-pressure test chamber. ... 46
Figure 3.5 - Schematic of the nozzle and fuel temperature governor. ... 46
Figure 3.6 - Sketch of the optical set-up at the high-temperature condition. ... 47
Figure 3.7 - Optical layout for the Mie scattering measurements in two different configurations a) radial, b) axial, and the corresponding acquired image. ... 48
Figure 3.8 - AVL Injection Gauge Rate System. ... 50
Figure 3.9 - Single cylinder test cell layout. ... 52
Figure 3.10 - Sankey diagram of mean effective pressures [12]. ... 54
Figure 4.1 - Top: Schlieren (a) and Mie-scattering (b) images, acquired 720µs after SOI, iso-octane (Pinj=20MPa, Tfuel=363K) injected in nitrogen (ρamb=1.12kg/m3, Tamb=573K). Bottom: Schlieren (c) and Mie-Scattering (d) background images. ... 64
Figure 4.2 - Scattering images processing algorithm. ... 64
Figure 4.3 - Image processing of Mie-scattering spray images. The background-corrected image Ic is shown in the first row. The second row displays the regularized image according to the MC filter. The third and fourth raw illustrates the iterative thresholding procedure. The final step of image binarization is shown in the last row. ... 66
Figure 4.4 - (Top) Threshold values and mean values of the foreground classes obtained throughout the iterative thresholding process of image Ic,MC, in Figure 4.3. (Bottom) Intensity histograms of Ic,MC (red bars), and I6 (grey bars). The black dotted line indicates the final threshold value. ... 67
X
Figure 4.5 - Contours of the liquid phase of the spray obtained from its Mie-Scattering image. For comparison, in picture c, the contours have been superimposed to the corresponding Schlieren image. ... 68 Figure 4.6 - Schlieren images processing algorithm. ... 69 Figure 4.7 - Image processing of Schlieren spray images. The background-corrected
image Ic is shown in the first row. The second row displays the regularized image
according to the MC filter. The curvature enhanced image is shown in the third row, while the last row shows its sum with the regularized image. ... 72 Figure 4.8 - Image processing of Schlieren spray images. The first two pictures
illustrate the iterative thresholding of the curvature enhanced image. The final step of image binarization is shown in the last row. ... 73 Figure 4.9 - Threshold values and mean values of the foreground classes obtained
throughout the iterative thresholding process of image 𝐼𝑐, 𝑀𝐶 + 𝐼𝑐, 𝜅𝑖𝑀𝐶in Figure 4.7 and Figure 4.8. (Bottom) Intensity histograms of 𝐼𝑐, 𝑀𝐶 + 𝐼𝑐, 𝜅𝑖𝑀𝐶 (red bars) and I36 (grey bars). The black dotted line indicates the final threshold
value. ... 74 Figure 4.10 - Boundaries of the vapor phase of the spray obtained from its Schlieren
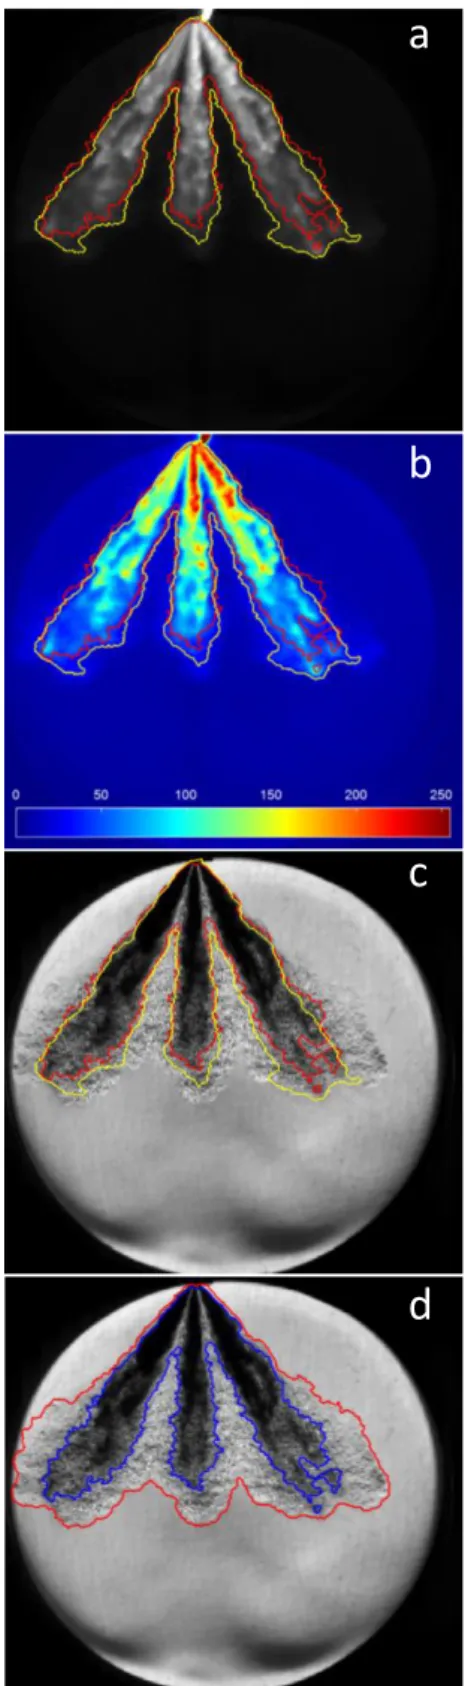
image. ... 75 Figure 4.11 - Contours of the liquid phase obtained from Mie-scattering (yellow lines)
and Schlieren (red lines) imaging superimposed to their raw images. Picture d: Comparison between the contours of liquid (blue line) and vapor (red line) phase obtained by Schlieren image. ... 76 Figure 4.12 - Time evolution of Schlieren and Mie-scattering spray images and the
corresponding vapor and liquid contours, under the ambient conditions. The first and second column shows the contours of the vapor phase (red lines) and the liquid phase (yellow lines) superimposed to the respective Schlieren and Mie-scattering raw images. The third column shows the Mie-scattering images in false colors with the corresponding liquid phase contours. In the last column, the latter is compared with the liquid phase contours (red lines) obtained from Schlieren images. ... 78 Figure 4.13 - Time evolution of Schlieren and Mie-scattering spray images and the
corresponding vapor and liquid contours, under the conditions ρamb=1.12 kg/m3
and Tamb=573 K The first and second column shows the contours of the vapor
phase (red lines) and the liquid phase (yellow lines) superimposed to the respective Schlieren and Mie-scattering raw images. The third column shows the Mie-scattering images in false colors with the corresponding liquid phase
XI
contours. The latter are compared in the last column with the liquid phase contours (red lines) obtained from Schlieren images. ... 79 Figure 4.14 - Time evolution of Schlieren and Mie-scattering spray images and the
corresponding vapor and liquid contours, at high-density conditions. The first and second column shows the contours of the vapor phase (red lines) and the liquid phase (yellow lines) superimposed to the respective Schlieren and Mie-scattering raw images. The third column shows the Mie-scattering images in false colors with the corresponding liquid phase contours. In the last column, the latter is compared with the liquid phase contours (red lines) obtained from Schlieren images. ... 80 Figure 4.15 - Vapour phase boundaries of the spray, at the high-density condition and
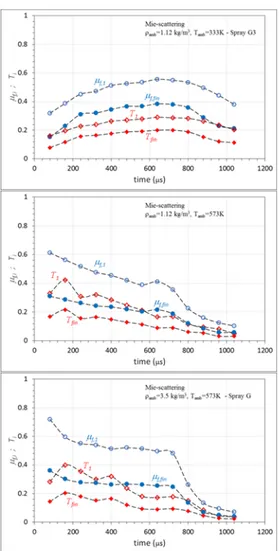
720µs ASOI, obtained with (bottom) and without (top) applying the additional background correction. ... 81 Figure 4.16 - Thresholds T1 and Tfin and mean values of the foreground classes µf,1 and
µf,fin versus the time ASOI for Mie-scattering images. ... 82
Figure 4.17 - Maximum axial penetration (top), spray angle (middle), and spray area (bottom) of the liquid and vapor phases of the spray. ... 84 Figure 5.1 - Voltage command (black) and corresponding fuel injection rate (red) at
the same pinj (80MPa), ET (1.5ms), and pback (5MPa), at different supply voltage
150V (a) and 110V (b). ... 92 Figure 5.2 - Rate of injection profiles at injection pressures of 30, 80, 120, and 160
MPa; energizing time of 1.25 ms, voltage command 150 V, and back-pressure 5 MPa. ... 93 Figure 5.3 - Total amount of injected fuel vs. time for different injection pressures and
voltage command. ... 94 Figure 5.4 - Example background image schlieren modified. ... 96 Figure 5.5 - Image processing with outlines of liquid (Mie scattering on the left) and
vapor (schlieren on the right) phases. Definition of axial (a) and radial (r) penetration. ... 96 Figure 5.6 - Image processing with outlines of liquid phase(Mie scattering) for both
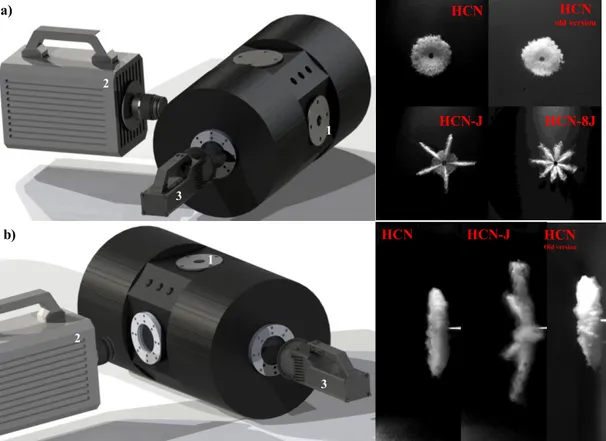
injectors HCN (left), HCN-J (center), and HCN-8J (right). Definition of axial (a) and radial (r) penetration. ... 97 Figure 5.7 - Liquid spray evolution for both configurations frontal (left) and lateral
(right), pinj: 80 MPa, Tamb: 298 K, at different voltage command. HCN (a),
XII
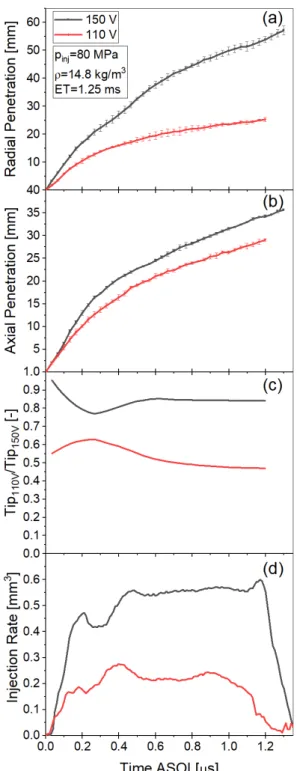
Figure 5.8 - Comparison of spray radial penetration (a), axial penetration (b), the penetration ratio (c), and fuel injection rate (d) at different voltage commands for HCN. Pinj 80 MPa; ρ 14.8 kg/m3; Tamb 298 K. ... 101
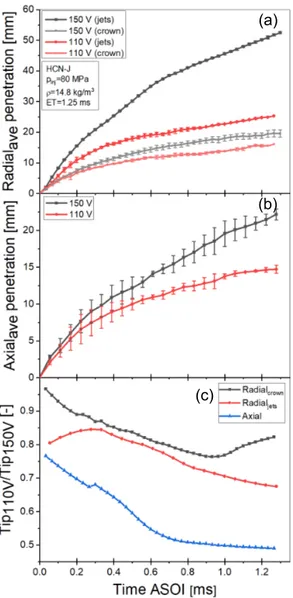
Figure 5.9 – Comparison of spray radial penetration (a), axial penetration (b), the penetration ratio (c) at different voltage commands for HCN-J. Pinj 80 MPa; ρ 14.8
kg/m3; Tamb 298 K. ... 102
Figure 5.10 – Progressive numbering spray plumes. ... 103 Figure 5.11 - Individual jet penetration profiles comparison at different voltage
commands for HCN-J. Pinj 80 MPa; ρ 14.8 kg/m3; Tamb 298 K. ... 103
Figure 5.12 – Comparison of spray radial penetration at different voltage commands for HCN-8J. Pinj 80 MPa; ρ 14.8 kg/m3; Tamb 298 K. ... 104
Figure 5.13 - Spray comparison in different operating conditions clean(left) and dirty (right), at pinj: 80 MPa, Tamb: 298 K, 150 V for HCN-8J. ... 105
Figure 5.14 - Comparison of spray radial penetration at operating conditions for HCN-8J. Pinj 80 MPa; ρ 14.8 kg/m3; Tamb 298 K, and 150 V. ... 106
Figure 5.15 - Experimental Setup. ... 107 Figure 5.16 - Liquid spray evolution, pinj: 80 MPa, Tamb: 298 K, 150 V. ... 108
Figure 5.17 - Effect of injection duration on axial (top) and radial (bottom) liquid penetration at an injection pressure of 80 MPa. ... 109 Figure 5.18 - Liquid spray sequences for two injection pressures: 80.0 (left) and 120.0
MPa (right). ... 110 Figure 5.19 - Liquid axial and radial penetration for different injection pressures. 111 Figure 5.20 - Spray sequence under evaporative conditions, liquid, and vapor
detection. ... 111 Figure 5.21 - Effect of ambient temperature on liquid axial (top) and radial (bottom)
penetration at an injection pressure of 80.0 MPa. ... 113 Figure 5.22 - Evaporative (left) and non-evaporative (right) liquid spray morphology. ... 113 Figure 5.23 - Axial (top) and radial (bottom) penetration profiles under evaporative
conditions; liquid (blue curves) and vapor (red curves). ... 114 Figure 5.24 - Sensitivity analysis of the effect of initial drop diameter on drop diameter
reduction and liquid TP. ... 117 Figure 5.25 - Frontal spray evolution acquired with schlieren images (left) compared
with numerical spray images (right) under non-evaporative conditions. ... 118 Figure 5.26 - Comparison between experimental and numerical liquid TP for both the
XIII
Figure 5.27 - Evolution of air and droplets velocity distribution in a symmetry plane
under non-evaporative conditions. ... 119
Figure 5.28 - Frontal liquid mass fraction evolution acquired with Mie images (left) compared with numerical spray images (right) under evaporative conditions. 120 Figure 5.29 - Comparison between experimental and numerical liquid TP for both the axial and radial components under evaporative conditions. ... 121
Figure 5.30 - Frontal vapor mass fraction evolution acquired with schlieren images (left) compared with numerical spray images (right) under evaporative conditions. ... 122
Figure 5.31 - Comparison between experimental and numerical vapor TP for both the axial and radial components under evaporative conditions. ... 122
Figure 5.32 - Computed vapor mass fraction relative to residual liquid mass fraction for the HCN and MHN during the injection event. ... 123
Figure 5.33 – Comparison of the radial tip between prototypes and MHN. ... 124
Figure 6.1 - Comparison of In-cylinder pressure and injection energizing pattern (left), Heat Release, and Heat Release Rate (right) at 1500 rpm at 4.2 bar of IMEP and HV 122V, for both injectors [1]. ... 129
Figure 6.2 - Specific emissions, COV, PRR, and MBF10-90% at 1500 rpm and 4.2 bar of IMEP for MHN and HCN (old version) [1]. ... 129
Figure 6.3 - Images of combustion processes in the optical engine at 1500 rpm and 3.3 bar of IMEP for HCN (old version) [1]. ... 131
Figure 6.4 - Engine map, selected part-load test points, and operating points of a vehicle with 1490 kg of inertial mass, equipped with the multi-cylinder engine over the NEDC. ... 132
Figure 6.5 - Comparison of tip protrusion without washer between HCN-J and MHN. ... 133
Figure 6.6 - Description of the Washer Thickness (WT) and Nozzle Tip Protrusion (NTP) concepts. ... 134
Figure 6.7 - Soot and isfc trends varying the injection washer thickness. ... 136
Figure 6.8 - Charging voltage profile function of the injection current. ... 137
Figure 6.9 - HRR traces for two different injections’ current profile. ... 138
Figure 6.10 - Soot and isfc trends varying the charging voltage. ... 138
Figure 6.11 - Charging voltage profile varying the high voltage (HV). ... 139
Figure 6.12 - Comparison of in-cylinder pressure, injection energizing pattern, HRR at 1500 rpm, and 2 bar BMEP, for HCN-J and MHN. ... 140
XIV
Figure 6.13 - Specific emissions, efficiencies, COV, PRR, and MBF10-90% at 1500 rpm and 2 bar of BMEP for HCN-J and MHN. ... 141 Figure 6.14 - Images of the liquid spray evolution in the optical engine for HCN-J.(1500x2, #1 Table 6.2) [5]. ... 142 Figure 6.15 - Images of the evolution of the luminous flame in the optical engine for
MHN and HCN-J. (1500x2, #1 Table 6.2) [5]. ... 142 Figure 6.16 – Emissions and efficiencies trace for all the test points. ... 143 Figure 6.17 - SoI variation effect on in-cylinder pressure, current injection profile and
HRR versus crank angle at 1500 rpm and 2 (left),5 (right) bar of BMEP, No EGR. ... 145 Figure 6.18 - SoI variation effect on CA90-10 at 1500 rpm, and 2 (left), 5 (right) bar
of BMEP, comparing to MHN reference calibration point. ... 146 Figure 6.19 - SoI variation effect on specific emissions at 1500 rpm, and 2 (left), 5
(right) bar of BMEP, comparing to MHN reference calibration point. ... 146 Figure 6.20 - Effect of the rail pressure variation on the specific emission for the test
point 1500x2, without EGR, HC 110V. ... 147 Figure 6.21 - Effect of the rail pressure variation on the specific emission for the test
point 1500x5, without EGR, HC 110V. ... 149 Figure 6.22 - Effect of the rail pressure variation on the in-cylinder pressure and heat
release rate at 1500x5 for both injectors (HCN-J and HCN-8J). ... 149 Figure 6.23 - Effect of the rail pressure variation on the specific emission for the test
point 2000x2, without EGR, HC 110V. ... 150 Figure 6.24 - Effect of the rail pressure variation on the specific emission for the test
point 2000x5, without EGR, HC 110V. ... 151 Figure 6.25 - Effect of the rail pressure variation on the in-cylinder pressure and heat
release rate at 2.0 and 5.0 of BMEP and 2000 rpm. ... 152 Figure 6.26 - Particulate emissions [FSN] for the three injectors compared. ... 152 Figure 6.27 – In-cylinder pressure and energizing current comparison at 2500x8 for
both injectors (HCN-J and HCN-8J). ... 153 Figure 6.28 - Emissions comparison at 2500x8. ... 154
XV
L
IST OF
T
ABLES
Table 3.1 – Experimental activities for different injector prototypes. ... 43
Table 3.2 - Optical setup for the Mie scattering measurements in two different configurations ... 48
Table 3.3 - Single Cylinder engine geometrical characteristics. ... 52
Table 3.4 - Fuel properties [11, 14, 15]. ... 56
Table 5.1 – Experimental conditions. ... 91
Table 5.2 - Injected fuel mass [mm3/stroke] for different injection pressures, timing, and voltage command, 150 V (a), and 110 V (b). ... 94
Table 5.3 -Experimental conditions HCN. ... 95
Table 5.4 – Experimental condition. ... 115
Table 5.5 - Setup of spray sub-models for spray simulation. ... 116
Table 6.1 -Washer thickness vs. fuel outlet area protrusion. ... 133
Table 6.2 - Test point and main operating parameters. ... 134
Table 6.3 - Selected steady-state test points and engine calibration parameters of interest (Euro 5 diesel base calibration). ... 135
Table 6.4 - Parameters variation ranges for all parameters investigated mode at four key points at Partial Load. ... 135
Table 6.5 - Constraint values on the engine operating conditions adopted during the test campaign. ... 136
XVI
A
BBREVIATIONS
Instantaneous Volume Fuel Rate
a Sound Speed in the Fluid
A/F Air-Fuel Ratio
ALMR Adaptive Local Mesh Refinement
Aps Cross-Section Piezo-Stack Actuator
Apv Cross-Section Pilot-Valve Stem
ASOI After Start of Injection
Atube Area of the Tube Inner Section
bmep Brake Mean Effective Pressure
CA50 Combustion Phasing
CAD Crank Angle
CDC Conventional Diesel Combustion
CFD Computational Fluid Dynamics
CI Compress Ignition
CO Carbon monoxide
CO2 Carbon Dioxide
COVimep Coefficient of Variation of Imep
CR Common Rail
CRF Centro Ricerche Fiat
DDM Discrete Droplet Model
DIP Digital Image Processing
DISI Direct Injection Spark Ignition
ECU Electrical Control Unit
EGR Exaust Gas Recirculation
ET Energizing Time
FBP Flash-Boiling Point
FIS Fuel Injection System
GC Gaussian Curvature
ABBREVIATIONS
XVII
HCN Hollow-Cone Nozzle
HCN-J Hollow-Cone Nozzle Jets
HR Heat Release
HRR Heat Release Rate
HW Hardware
IAP Injector Indirect-Acting Piezo Injector
ID Ignition Delay
IM Istituto Motori
IMEP Indicated Mean Effective Pressure
ISFC Indicated Specific Fuel Consumption
KH-RT Kelvin-Helmholtz and Rayleigh-Taylor
Labs Absorption of Liquid Droplet
LAS Laser Absorption Scattering Techinique
LRT Likelihood Ratio Test Method
Lsca Scattering of Liquid Droplet
MC Mean Curvature
MCE Multi-Cylinder Engine
mep Mean Effective Pressure
MHC Methane unburned hydrocarbon
MHN Multi-Hole Nozzle
NOx Nitrogen Oxides
pback Backpressure
Pbrake Brake Power
pcc Pressure Control Chamber
pdc Pressure Delivery Chamber
pfp Peak Firing Pressure
Pfrict-loss Friction Power Losses
Pind Indicated Power
pinj Injection Pressure
PM Particulate Matter
Ppump-loss Pumping Power Losses
ppv,up Upstream Pressure Chamber of the Pilot-Valve
PRRmax Peak Pressure Rise Rate
psac Pressure Chamber of the Sac
ABBREVIATIONS
XVIII
Qcomb-loss Combustion Loss
QEGR EGR Heat Cooling Loss
QExh Exhaust Heat Loss
QHT Radiation and convection heat transfer loss
qinj Total amount of injected fuel
RoI Rate of Injection
SCE Single Cylinder Engine
SI Spark Ignition
SMD Sauter Mean Diameter
SoC Start of Combustion
SoI Start of Ignition
Tamb Ambient Temperature
TDC Top Dead Centre
Tfuel Fuel Temperature
THC Total Unburned Hydrocarbon
tinj Injection Duration
Tinj Injector Temperature
TP Tip Penetration
TV Total Variation
V Total Injected Amount
Vabs Absorption of Vapor
VGT Variable Geometry Turbine
Δpgauge Pressure Change
ηbrake Brake Efficiency
ηcomb Combustion efficiency
ηgross Gross efficiency
ηnet Net Indicated Efficiency
ηthermal Thermal Conversion Efficiency
λ Relative Air-fuel ratio
ρ Fluid Density
ρamb Ambient Density
ρgas Chamber Density
Φ Equivalence Ratio
𝐼0 Intensity Incident Light
ABBREVIATIONS
XIX
𝑄𝑒𝑥𝑡 Extinction Efficiency
𝜆𝐴 Wavelength of Absorption
1
INTRODUCTION
Background
The most important factor affecting the development of powertrains used in road vehicles is currently the emission of harmful exhaust compounds and how these emissions can be reduced.
The second most important factor is in reducing greenhouse gas emissions, particularly CO2 emitted by motor vehicles, which is also a political priority due to
CO2’s impact on global warming.
New European emission regulations, such as Euro 6d and new test methods (RDE and WLTP), are the main challenges for the automotive industry caused by political, socioeconomic, and technical factors. Air quality is very high on the political agenda, and pressure remains to limit and reduce greenhouse gas emissions from the road transport sector. In addition to limits becoming increasingly stringent, the list of parameters subject to legal limits is slowly expanding and, most importantly, these limits must be met under a wide range of conditions. In particular, the emission limits of particulate matter and nitrogen oxides have tightened and are being treated as a form of pollution with a significant negative impact on the environment [1].
The issues of harmful emissions, especially:
a) Nitrogen oxides (NOx) from vehicles powered by compression ignition engines (CI), which for vehicles meeting Euro 3, Euro 4, Euro 5 and Euro 6b standards, proved to be significantly greater in actual conditions of road use than in homologation laboratory measurements;
b) Particulate matter (whether quantified by mass PM, or number PN) in exhaust gases, not only from vehicles with CI engines, where the introduction of DPF filters has practically resolved this problem but also from vehicles with spark-ignition engines (SI), especially ones equipped with direct gasoline injection into the combustion chamber (GDI) that produce large amounts of particles of very small diameters, so-called nanoparticles, which are very harmful to living organisms;
INTRODUCTION
2
c) Non-exhaust particulate emissions, originating from other components such as brakes and tires, as well as volatile compounds emitted from the materials in new vehicles (Vehicle Internal Air Quality);
d) Carbon dioxide (CO2) and fuel consumption (which is also related to the
global demand for fuel, energy security and plans for a decarbonized economy [2]) occurring in real-world driving conditions,
are becoming a priority for the automotive sector, especially within the largest markets of the European Union, Japan, China, India, and other Asian countries, South Korea, Brazil and the USA [3].
The new legislation on IC engines imposes even more stringent limits on emissions and CO2 levels. In particular, the European emissions standard Euro 6 imposes a NOx
reduction of about 50% with respect to the Euro 5 standard. While, the CO2 limit in
Europe for passenger cars will be cut from the present value of 130 g/km, for the average fleet, to 95 g/km by 2021 [4] and to 70g/km by 2025 [2].
In order to respect the legislation in terms of CO2 and emissions, the OEM
companies are hard-working on the development of new powertrain concept comparison aimed at the introduction of dedicated-advanced IC engine technologies capable of improving both the efficiency and emissions performance. The key technologies are listed below and divided according to the legislative and temporal objectives:
SHORT TERM DEVELOPMENT → to meet Euro 6d limits/requirements, WLTP, and RDE rules:
➢ “Rightsizing” of CI and SI engines;
➢ Diesel engines → adding SCR to ATS to all Light Duty-Vehicles (LDV); ➢ Gasoline DI → adding GPF to ATS to all LDV.
LONG-TERM DEVELOPMENT → beyond Euro 6d & to meet CO2 requirements:
➢ Further “rightsizing” of SI DI engines;
➢ Alternative fuels development (HVO, DME, Ethanol, CNG/LPG); ➢ CNG fuelled SI engines;
➢ Hybridization (MHEV, PHEV); ➢ HCCI engines;
➢ Electric powertrain (BEV); ➢ Fuel cells (FCEV).
A new trend in engine design is “rightsizing”, as well as an ongoing convergence of spark ignition and compression ignition engine technology, with differences now much smaller than in the past (turbocharging, direct injection, compression ratio).
INTRODUCTION
3
In this regard, this study presents the development of a novel concept for advanced piezoelectric driven fuel injectors. The development belongs to a wider collaboration project between Istituto Motori and Centro Ricerche Fiat (FCA Research Centre).
The commercial piezoelectric fuel injectors, in general, thanks to the potential offered by piezoelectric actuators such as the rate of fuel injection and the response time of the injector, contribute to the efficiency of the system as well as the improvement of the combustion. Using the piezoelectric actuator, the Electronic Control Unit can manage a high number of multiple injections within a combustion cycle, allowing very efficient combustion to occur thanks also to the reduced delay time between the electric and the hydraulic command, with respect to conventional solenoid injector. An increase in combustion efficiency leads to cleaner exhaust, lower noise levels, and higher power output, which are all critical demands for the automotive industry [5].
Motivation
Within the last decade, the high-speed direct injection (HSDI) diesel engine has become a realistic alternative to the gasoline engine for modern passenger car applications. Excellent drivability and durability, together with the high economy, have led to its increasing popularity in the market place.
European legislation is set to impose a further restriction on the level of emissions that are permitted from diesel engines together with targets for fuel-efficiency. Therefore, the stringent emission legislation placed upon the modern diesel engine poses a challenge to engine designers. To satisfy these targets, the researchers have to develop new techniques and processes that can be integrated with existing engine systems to reduce pollutant output. The fuel injection equipment is one such sub-system that has been found to lend itself to developments leading to improvement in engine performance and emission-quality and will continue to play a vital role in the development of improved diesel engines for the foreseeable future.
These benefits have been achieved by more sophisticated control of the fuel injection process and the use of higher injection pressures. Ultimately the nature of the combustion process is determined by the quality of the fuel spray and its distribution and mixing within the combustion chamber. Breakup and distribution of the spray are determined mainly by the in-cylinder conditions (air motion, density, and temperature), the injection pressure, nozzle design, and geometry. A need is therefore identified to study the temporal and spatial development of diesel sprays under realistic injection and in-cylinder conditions firstly, and secondly, the effects of different
INTRODUCTION
4
injection regimes on the combustion process. Data obtained can be used to establish a link between injection and combustion processes, and indirectly be used in the development of models to be incorporated in CFD codes.
Objectives
The objective of this project, as previously discussed, is to assess the real potentialities of the injector that uses a piezoelectric actuator to directly control the process of fuel injection in a diesel engine. The tested injectors are outwardly opening nozzle injectors able to generate a hollow cone spray, which justifies the acronym HCN. For this reason, a complete characterization of the injectors was carried out in terms of spray evolution in a vessel combustion chamber, hydraulic characterization and tests with Single-Cylinder Engine (metal and if necessary optical) in order to be able to identify the optimal configuration (shape) and evaluate the potentialities with respect to the conventional solenoid injectors.
In the following thesis, a panoramic scenario of the results for the prototypes will be presented, and subsequently, the experimental activities carried out for the new prototypes will be illustrated. These results will be compared to those of a conventional multi-hole nozzle injector, which will be considered as a reference.
Detailed analysis of the experimental results will be provided to fully characterize the performance of the injectors in order to highlight the real potentialities of the new architecture.
The thesis can be broadly divided into two main groups: spray characterization and combustion studies. Studying non-combusting sprays allows the assessment of the location of diesel liquid and vapor. This information, which is crucial for correct combustion analysis, was obtained by several optical techniques: Schlieren and Mie- Scattering. Combustion studies were focused on the investigation of the engine performance and emissions formation.
Thesis Outline
A summary of the chapters that make up the thesis is provided in this section. The first part contains background information focused on diesel engine principals and the role of fuel injectors in establishing the efficiency and performance of the engine. The dynamics/physics of the spray is described in general in Chapter 2.
Chapter 3 provides a description of the test methodology and the facilities employed to characterize the new prototypes. Section 4 describes in detail the image processing, developed during the Ph.D. program. Chapter 5 and 6 elaborate on the experiments
INTRODUCTION
5
conducted, provides the results, as well as an analysis of the overall characteristics of the injector prototypes. Several recommendations regarding future development and activities are also offered.
6
R
EFERENCES
[1] P. Bielaczyc and J. Woodburn, ‘Trends in Automotive Emission Legislation: Impact on LD Engine Development, Fuels, Lubricants and Test Methods: a Global View, with a Focus on WLTP and RDE Regulations’, Emission Control
Science and Technology, vol. 5, no. 1, pp. 86–98, 2019.
[2] S. Neugebauer, ‘Technological scenarios for the decarbonization of road transport’, Proceedings “Connectivity–key to future emission and consumption
reduction, 2018.
[3] T. Kobayashi, ‘Outline and issues of RDE test in Japan’, in 2nd Sino-EU
Workshop on New Emissions Standards for Motor Vehicles, 2018.
[4] E. Parliament and the C. of the E. Union, ‘Regulation (EU) No 333/2014 of the European Parliament and of the Council of 11 March 2014 amending Regulation (EC) No 443/2009 to define the modalities for reaching the 2020 target to reduce CO2 emissions from new passenger cars’, Off J Eur Union, vol. 103, no. 333, pp. 15–21, 2014.
7
CHAPTER 1
C
OMPRESSION
-I
GNITION
E
NGINE
Combustion-Engine Challenges
The internal combustion engine has revolutionized transportation since the 19th century. Today, the world’s vehicle population consists of more than one billion cars, with a yearly production of 95 million, of which the vast majority is propulsed by a combustion engine [1]. The reason for its persistent popularity is a combination of simplicity, durability, low power-to-weight ratio, high power controllability, and reasonable efficiency [2]. Engine research and development are mainly focused on legislation-enforced emission reduction and the aim to reduce fuel consumption. This is due to toxic local emissions [3, 4], and the fact that the transportation sector contributes to 23 % of global greenhouse gas emissions [5]. The historical evolution for European limits for Diesel and Gasoline engines are presented in Figure 1.1
Figure 1.1 - Historical evolution of European emission limits for Diesel and Gasoline engines and some US references.
Emissions of CO, unburned hydrocarbons (HC), and particle number count are also regulated. The European Union maintains its focus on achieving the Greenhouse Gas
CHAPTER 1 CI ENGINE
8
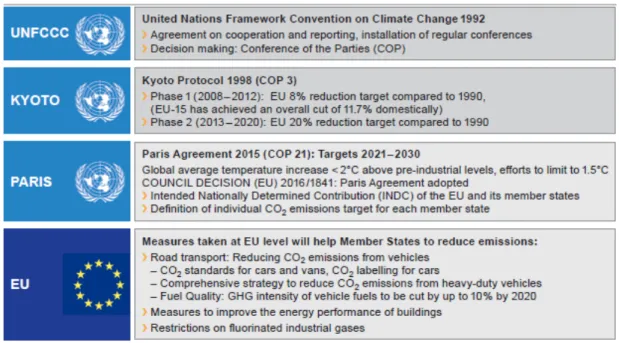
(GHG) emission reductions planned for the second commitment period of the Kyoto protocol for 2013 to 2020 with the target to achieve in 2020 20% of GHG reduction compared to the base year 1990. For the following years, the European Union committed within the Paris agreement (COP21) to a GHG reduction target for the period from 2021 to 2030. The commitment for 2030 is a reduction of 40% of GHG emissions compared to 1990, Figure 1.2. Finally, for 2050 the European Union set itself a target of net-zero greenhouse gas emissions.
Figure 1.2 - Main UN agreements driving the EU CO2 emission policy.
Battery-electric and fuel-cell vehicles are possible zero-emission alternatives to the internal combustion engine [6]. However, considering a large number of combustion engines on our roads today, mass production will probably continue for several years, especially in the heavy-duty sector [7]. In this scenario, technological combustion-engine advances in combination with hybridization, and the usage of biofuels could constitute a cost-effective path towards reduced local and global emissions [8, 9].
Engine-technology advances for cleaner combustion include high-pressure fuel-injection, exhaust-gas recirculation (EGR), and compression and cooling of inducted air [10]. Exhaust filters and catalysts are also necessary for the fulfillment of current legislation. The resulting engine complexity has led to an increase in the number of sensors and actuators, which has promoted the development of more advanced engine-control systems. Focus has also been directed towards the development of new, clean and efficient combustion concepts. In the current scenario, this thesis presents work
CHAPTER 1 CI ENGINE
9
on the assessment of a new concept of injector, based on piezo-electric pintle type actuation.
This thesis investigates how the fuel injection could be used to optimize the combustion for efficient fulfillment of constraints on cylinder pressure, NOx emissions, and exhaust temperature. Such methods could also be used to improve the performance of conventional combustion concepts.
The following sections give a brief overview of fundamental engine principles and compare conventional diesel combustion with low-temperature combustion.
Conventional Diesel Combustion (CDC)
The following description of conventional diesel combustion (CDC) is based on the conceptual model presented by Dec [11]. Conventional diesel combustion is initiated by high-pressure fuel injection into a compressed, hot (∼1000 K) air charge, close to TDC. The injected fuel propagates into the combustion chamber and forms a conical jet of fuel droplets.
The fuel jet becomes increasingly diluted with hot air and vaporizes as it expands. After a certain traveling distance along the jet axis (∼20-25 mm), called the lift-off length, the fuel has vaporized completely. Chemical reactions are initiated all over the jet cross-section after further air entrainment. Initial reactions are followed by rapid, rich, premixed combustion, and the resulting temperature increase leads to the formation of soot due to an excess of fuel. Air entrainment continues as the reacting fuel travels along the spray axis, and a quasi-steady diffusion flame is formed along the jet periphery when stoichiometric conditions are reached. At this stage, the combustion rate is controlled by how fast the injected fuel is vaporized, mixed with air, and supplied to the diffusion flame. This type of combustion is therefore referred to as mixing control. The temperature reaches its maximum in the vicinity of the flame which causes nitrogen to oxidize and form harmful NOx emissions. The high temperature, in combination with the availability of oxygen, also results in soot oxidation, which gives the characteristic diesel-flame luminosity. Furthermore, these conditions lead to almost complete oxidation of CO and HC during the expansion stroke. Figure 1.3 shows the typical heat release rate (HRR) trace from conventional diesel combustion. The first phase, called ignition delay (ID), represents the period between the start of injection (SoI) and the start of combustion (SoC). After the ID period, a spontaneous auto-ignition process starts due to the high temperature and pressure of air-fuel mixture; this phase is called premixed combustion characterized
CHAPTER 1 CI ENGINE
10
by very high heat release gradients [12]. After the premixed combustion phase, and during the injection process, the heat release rate is controlled by the rate at which the mixture becomes available for burning (mixing-controlled combustion phase). Finally, the heat release continues at a lower rate well into the expansion stroke (late combustion phase) [2].
Figure 1.3 - Typical heat release rate identifying different conventional diesel combustion phases [2].
Another schematic representation of the diesel combustion was proposed by Dec [11]. The conceptual model, presented in Figure 1.4, describes the quasi-steady diesel spray; the single diesel fuel jet can be divided into several zones. On the left side, a liquid fuel penetrates in the combustion chamber from the nozzle, it mixes with the hot ambient air, and then the fuels start to vaporize, and a fuel-rich mixture zone establishes. The spray reaches its maximum liquid length. Auto-ignition occurs in the subsequent fuel-rich mixture zone, where it undergoes premixed combustion. It is pre-sources of soot formation inside the spray. Further downstream in the jet, the soot particles grow in size and concentration inside the diffusion flame due to a lack of oxygen. On the outer reaction zone of the diffusion flame, NOX production occurs due
CHAPTER 1 CI ENGINE
11
Figure 1.4 - Schematic of a diesel flame with temperatures and chemistry[11].
Low-Temperature Combustion (LTC)
Combustion concepts with improved paths have been under intense study during the past decades. Low-temperature combustion (LTC) concepts utilize enhanced fuel-air mixing to increase the combustion-zone heat capacity. The increased heat capacity lowers combustion temperatures and makes it possible to avoid the emission-formation regions in Fig. 1.6.
Figure 1.5 - Emission formation as a function of Φ and T. Combustion paths for HCCI, PPC, and conventional diesel combustion are indicated by the blue, green, and orange lines. The increased dilution of fuel with air in HCCI and PPC gives a higher combustion-zone heat capacity. This reduces T and Φ, and the emission-formation zones can be avoided [13].
HCCI, or ATAC as it originally was coined, was the first low-temperature combustion strategy for engines. Although HCCI has not been commercialized, it
CHAPTER 1 CI ENGINE
12
provided extensive new insights to engine combustion that has led to the development of many other concepts. These include RCCI and PPC that are described below, but also PCCI, PPCI, GDCI, and many others that in common have low-temperature combustion and high dilution levels and, due to their similarities, are not described further. A characteristic feature of the new combustion principles is that they offer new opportunities for both existing and new alternative fuels. HCCI can be run on essentially any fuel by tailoring compression ratio and inlet temperature, RCCI uses two fuels with varying proportions while PPC runs efficiently on any liquid fuel by adjusting fuel injection and other parameters (Figure 2). PPC has also demonstrated excellent efficiency and very low emissions for naphtha, which has an octane rating of around 70, substantially a fuel with ignition properties in-between diesel and gasoline.
Homogeneous Charge Compression Ignition (HCCI)
The homogenous charge compression ignition (HCCI) principle is a comparatively new concept that has yet to find commercial success. The working principle is similar to that of the SI engine, in that the fuel and air are mixed before being inducted into the cylinder. The HCCI engine does not use any specific device to ignite the in-cylinder charge. Combustion starts simultaneously throughout the in-cylinder through auto-ignition by compressing the charge to sufficiently high pressures and temperatures. In regular operation, the HCCI engine needs dilution of the intake charge to limit the pressure rise rate during combustion. This leads to a low combustion temperature that is beneficial for efficiency and low soot and NOx emissions. The premixing and low combustion temperature do, however, lead to remarkably high emissions of CO and HC. By carefully adjusting the compression ratio and inlet temperature, almost any fuel can be used with HCCI. The challenges with controllability and low load have limited the use of HCCI to an ideal combustion research tool.
Reactivity Controlled Compression Ignition (RCCI)
RCCI uses two fuels with different reactivity (auto-ignition resistance) in different proportions to optimize the combustion behavior at different operating conditions. It is similar to the dual-fuel concept by using one fuel with high auto-ignition resistance premixed with air and one fuel with low auto-ignition resistance direct-injected. Unlike the dual fuel concept, RCCI uses dilution and low-temperature combustion, in a similar way to HCCI. Very high efficiencies have been reported, combined with emissions characteristics similar to HCCI.
CHAPTER 1 CI ENGINE
13
Partially Premixed Combustion (PPC)
PPC can be seen as a concept combining principles from both DICI and HCCI. Typically, PPC is associated with a separation of the direct injection event and the auto-ignition combustion. By injecting the fuel at some point during the compression, combined with air dilution and high amounts of residual gases and fuel with some resistance to auto-ignition, fully premixed or fully heterogeneous conditions can be avoided. This leads to low emissions of soot, NOx, HC, and CO, together with very high efficiency. PPC exhibits substantial fuel flexibility with liquid fuels by tailoring the injection strategy towards the auto-ignition properties of the fuel. However, with low auto-ignition resistance of the fuel, sufficient premixing is challenging to achieve leading to increased emissions of soot. Gaseous fuels have not been investigated with PPC due to the anticipated difficulties associated with suitable direct injection of gas.
Figure 1.6 - Engine combustion research concepts compared to conventional SI and DICI. Blue indicates a reactive fuel like diesel, while orange indicates a none-reactive fuel like gasoline[14].
Emissions after-treatment vs. combustion concept
Nitrous oxides (NOx), hydrocarbons (HC), carbon monoxide (CO), and soot or particulate matter (PM) are known as regulated emissions. The emissions legislation is increasingly becoming stricter. Most markets in the world require vehicles with emissions after-treatment systems (EATS), while in the US, Europe, Japan, and some other places, the demands require advanced EATS to meet the regulations.
DICI engines emit less HC and CO but high amounts of NOx and soot. To meet the latest and strict regulations, US 10 and EURO VI for heavy-duty vehicles, such as buses and trucks, advanced and expensive EATS are required (Figure 1.7). EURO 6 for cars is not as strict and more straightforward NOx reduction and particulate filters used.
CHAPTER 1 CI ENGINE
14
Lean burn engines may get away with only an oxidizing catalytic converter (OC or DOC) to reduce CO and HC, but in some markets, selective catalytic reduction (SCR) is needed to reduce NOx. Emerging combustion concepts, as RCCI and PPC, are designed to operate without the need for expensive EATS. RCCI may get away with only DOC, while PPC shows the overall best emissions performance. Low load CO and HC emissions are, however, still too high from PPC to be EURO VI compliant. A DOC might be needed.
Figure 1.7 - Simplistic overview of emissions after-treatment systems versus combustion concepts.
Future regulations may prove challenging to meet for DICI engines and may require adaption of RCCI and PPC strategies.
Injection System
The injection system, as a critical component of the diesel engine, has been developed into many techniques. In particular, in the following section, it will be illustrated the standard injection system adopted in the modern CI engine. As a more advanced injecting technique, the common rail injection system can work out of the limitation of the camshaft, unlike the mechanical injection system, which involves numerous problems such as it can only make injection at certain cam angles and precise control over the injection is difficult as well. A separate electrical pump drives the common rail injection system, the pump continually works and supplies fuel at constant pressure to the common rail, an intermediate fuel reservoir. Electrical valves control injectors in the CR injection system. Such a design makes the CR injection system possible to achieve flexible injections.
Common-Rail Injection System
The Common Rail (CR) injection system is a state of art technology for the CI engine, and it is one of the most advanced solutions in order to optimize the combustion processes. It can provide a very flexible way of injection due to the
CHAPTER 1 CI ENGINE
15
application of an electrical injector, as the electrical actuation valve (solenoid or piezoelectric) can activate faster and more precise than the mechanical injectors. On the other hand, the unique design of the CR system makes its fuel supply and injection sections utterly independent of each other.
Also, with various electronic sensors, the system can monitor the engine’s real-time performance parameters in all loading conditions. The parameters, including RPM, cylinder pressure, temperature, fuel flow rate, etc. By sending those parameters into a microprocessor, the common rail system can adjust the injection timing, injection rate, and fuel pressure, ensuring the engine always working in the optimal condition [15].
Figure 1.8 – Scheme of the common rail system [16].
A typical common rail system works as follows: a fuel supply pump firstly supplies fuel at low pressure to the high-pressure pump, from which the fuel is pressurized. Both of the fuel supply pump and the pressurized pump are electrically driven; they continuously work to transport fuel at the designed pressure to the common rail.
The common rail is an intermediate reservoir that can collect the fuel from pumps and maintain it at a high-pressure level.
Electrical-controlled Injectors in the CR system derive fuel from the rail, injecting fuel spray when they receive a command signal from the Electronic Control Unit (ECU). 1. ECU 2. Low-pressure pump 3. Fuel filter 4. Temperature Sensor 5. High-pressure pump
6. Fuel amount regulator
7. Pressure regulator 8. Common-rail 9. Pressure sensor 10. Check valve 11. Pulsation dumper 12. Injectors
CHAPTER 1 CI ENGINE
16
The common rail injection system can control the fuel injection rate and realize flexible injection precisely. Two components are playing a crucial role in enabling this feature, which is the common rail and the solenoid injector.
Injectors
The injector is a complex and critical component in the injection system. It receives the high-pressure fuel from the common rail and injects the fuel through its injection holes (nozzle) into the combustion chamber. The injection holes are made very tiny to atomize the fuel into fine droplets when the fuel is penetrating the cylinder chamber.
Many variables affect the performance of fuel injectors: the start of injection, injection duration, and pressure, direction, and the number of injection jets (nozzle type). The start of injection is the point at which the injection of fuel into the combustion chamber starts. Proper timing of this point is essential and is done in degrees of crankshaft rotation relative to the crankshaft Top Dead Center (TDC). This point directly affects the emission generation. For instance, the NOx and hydrocarbon emissions are lowest when the start of injection is closest to the Top Dead Center [17].
The start-of-delivery parameter indicates the delivery of fuel from the fuel injection pump to the fuel injector. Injection lag is defined as the time from the start of fuel delivery to start of injection, and ignition lag is the time from the start of injection to start of ignition. The injection lag and ignition lag are delays that the fuel injection system has to compensate for by adjusting the start of delivery and injection in response to engine speed, load, and temperature [17].
Fuel Injector Technology
First and second-generation Common Rail (CR) systems have been based on solenoid-equipped injectors [18–21]. Most CR electro-injectors on the market still have a needle that is driven by solenoid coil energy. The first disadvantage of this technology is the relatively high electric power that is necessary [22], although the energy that is spent on the electric actuation of the injectors generally has a trivial impact on vehicle fuel consumption. CR systems equipped with solenoid-driven injectors also suffer from critical drawbacks concerning high-pressure capacity [23], due to the remarkable leakage of fuel that occurs through the pilot-valve. Solenoid driven injectors are above all affected by a relatively weak dynamic response [24]. The solenoid force arises at a distance, and its intensity is minimum when the air gap between the magnet and the pilot-valve armature is maximum, that is, at the start of the energizing time. Furthermore, the force on the pilot-valve increases with the square
CHAPTER 1 CI ENGINE
17
of the current to the solenoid, and the exponential increase in the current needs about 80–100 µs before it can move the pilot-valve [22–25].
Several studies have been carried out in order to find a way of overcoming these solenoid-injector drawbacks. These studies can be subdivided into the two following main technical approaches. The first is related to the development of advanced solenoid injectors. It is possible to realize high-speed solenoids, which feature a faster dynamic response than conventional ones, by optimizing some of the magnetic and electric circuit parameters [26]. Furthermore, voltages of up to 80 V can be applied to drive the solenoid in order to obtain a sharp current rise, which in turn minimizes the needle valve opening delay [27].
The second main approach in the design of advanced CR injectors is related to the application of piezo-actuators as prime movers. The converse piezoelectric effect is used [28]. An applied electric field produces an extension of the piezoelectric material that actuates either the pilot-valve (indirect-acting piezo injectors – IAP injectors) or the needle valve directly (direct-acting piezo injectors). The main advantage of the piezo-driven injector is the enhanced dynamic response [29, 30]: a piezo-stack can generate forces of 800 N [27], while conventional solenoid systems usually show lower values than 100 N [31]. This makes it possible for the direct-acting injector concept to be also used in diesel engines [32] and, for indirect-acting injectors, makes it possible for the injected flow-rate to increase rapidly at the initial injection stage. The reduction in the Nozzle Opening Delay (NOD) of piezo driver injectors, with respect to solenoid ones, can range from 100 to 150 µs. The time required by the needle to reach the highest position from the closed state is significantly reduced (by up to 50%) compared to solenoid injectors [30, 33]. The time required to close the nozzle, that is, the Nozzle Closure Delay (NCD), is also less than that of piezo-injectors [33]: the average velocity of the needle during the down-stroke is about 0.7 m/s, whereas it reduces to 0.5 m/s in solenoid injectors.
In short, piezo-injectors seem to offer more interesting opportunities for optimizing current diesel combustion [34], and this is why they have gained so much attention in the scientific community. However, the current acting piezo and solenoid injectors do not only differ as far as the driving system of the pilot valve is concerned; they often show remarkable differences in the hydraulic layout and mechanical setup.
To better understand the real potentialities of the piezo-driver injector, in the following paragraph will describe the operating principle for both actuating systems.
CHAPTER 1 CI ENGINE
18
1.1.1.1 Solenoid Injector
In this section, the operating principles of a typical solenoid fuel injector with a hydraulic servo-circuit that works with the common-rail system are described. Figure 1.9 shows the operation stages of the injector. The working principle of electrical injectors is depicted as follows:
Figure 1.9 - Solenoid injector [15].
Before the solenoid is activated, the control valve is closed, fuel enters the injector through the inlet orifice, as shown in Figure 1.9a. From which the fuel flow is divided into two paths, one part of fuel stays at the pressure control chamber located at the upper end of the servo piston, another part of fuel goes down to the accumulation chamber, located in the middle of the needle valve. In this condition, the control chamber and the accumulator chamber were connected through orifices to the common rail. Because there was no pressure difference between the pressure control chamber and the accumulator chamber, while the area of servo piston is larger than the area of needle valve, the resultant hydraulic force is acting downward, closing the needle valve.
The injection process is depicted in Figure 1.9b. Feeding a command voltage to the solenoid for a given duration induced a magnetic force. Magnate force from the solenoid pulls the armature, together with the ball valve, upward. Subsequently, the pressure in the pressure control chamber decreased as fuel in the chamber drained into the fuel return line. In the meantime, the fuel pressure in the accumulation chamber remains high, thus lifting the needle valve. Consequently, fuel starts to flow through the nozzle holes.
![Figure 2.13 - Deflection of light beams through an area of circular symmetrically distributed variation of refraction index, [14]](https://thumb-eu.123doks.com/thumbv2/123dokorg/4692315.44309/61.892.259.652.170.408/figure-deflection-light-circular-symmetrically-distributed-variation-refraction.webp)
![Table 5.2 - Injected fuel mass [mm 3 /stroke] for different injection pressures, timing, and voltage](https://thumb-eu.123doks.com/thumbv2/123dokorg/4692315.44309/116.892.146.763.227.628/table-injected-stroke-different-injection-pressures-timing-voltage.webp)