microorganisms
ArticleCulturing Toxic Benthic Blooms: The Fate of Natural
Biofilms in a Microcosm System
Francesca Di Pippo1,2and Roberta Congestri3,*
1 CNR-IRSA, National Research Council, Water Research Institute, Area della Ricerca di Roma 1,
Monterotondo Stazione, Rome 00015, Italy; [email protected]
2 CNR–IAMC, National Research Council, Institute for Coastal Marine Environment, Località Sa Mardini,
Torregrande, Oristano 09170, Italy
3 LBA-Laboratory for Biology of Algae, Department of Biology, University of Rome “Tor Vergata”,
Rome 00133, Italy
* Correspondence: [email protected]; Tel.: +39-06-7259-5989 Received: 30 June 2017; Accepted: 2 August 2017; Published: 6 August 2017
Abstract:A microcosm designed for culturing aquatic phototrophic biofilms on artificial substrata was used to perform experiments with microphytobenthos sampled during summer toxic outbreaks of Ostreopsis cf. ovata along the Middle Tyrrhenian coast. This dynamic approach aimed at exploring the unique and complex nature of O. cf. ovata bloom development in the benthic system. Epibenthic assemblages were used as inocula for co-cultures of bloom organisms on polycarbonate slides at controlled environmental conditions. Biofilm surface adhesion, growth, and spatial structure were evaluated along with shifts in composition and matrix production in a low disturbance regime, simulating source habitat. Initial adhesion and substratum colonisation appeared as stochastic processes, then community structure and physiognomy markedly changed with time. Dominance of filamentous cyanobacteria and diatoms, and dense clusters of Amphidinium cf. carterae at the mature biofilm phases, were recorded by light and confocal microscopy, whilst O. cf. ovata growth was visibly limited in the late culture phases. Life-form strategies, competitiveness for resources, and possibly allelopathic interactions shaped biofilm structure during culture growth. HPLC (High Performance Liquid Chromatography) analysis of exopolysaccharidic matrix revealed variations in sugar total amounts and composition. No toxic compounds were detected in the final communities tested by LC-MS (Liquid Chromatography- Mass Spectrometry) and MALDI-TOF MS (Matrix Assisted Laser Desorption Ionization Time OF Flight Mass Spectroscopy) techniques.
Keywords: benthic harmful algal blooms (BHABs); benthic dinoflagellates; Ostreopsis cf. ovata; biofilm cultures; confocal microscopy
1. Introduction
Ostreopsis cf. ovata, a toxic benthic dinoflagellate, has considerably expanded its distribution in temperate areas in the last 20 years, forming recurrent benthic harmful algal blooms (BHABs) in the Mediterranean basin [1,2]. BHABs rapidly spread along Italian Middle Tyrrhenian coast, since their first record in 1999 [3,4], with summer outbreaks sustained by the most abundant and so far widely distributed Ostreopsis Mediterranean species [5–8]. On these occasions, BHABs come in brownish, mucous cell aggregates, visible to the naked eye, proliferating on biotic and abiotic substrata of relatively shallow and sheltered coastal stretches favored by low water motion and increased input of organic nutrients [9–11]. Complex and diverse microphytobenthic associations co-occur with O. cf. ovata blooming cells, especially diatoms and cyanobacteria, all enmeshed in a common exopolymeric matrix that probably plays a central role in cell attachment to surfaces, colony formation, and bloom “nutrition” and dispersion [7,10,12–14]. Undesirable impact of Ostreopsis BHABs includes production
of palytoxin-like compounds that caused benthic biocenosis sufferings and mass mortalities, along with human intoxications and also severe economic impact [15–18]. A global increase in BHABs in temperate and tropical regions has been recorded, possibly due to more effective monitoring and also to anthropogenic factors and global climate change [1,19]. In any case, it is still a matter of debate whether global warming will increase Ostreopsis BHABs distribution, periodicity, and intensity, as the physiological response to temperature and pH in culture and field studies did not infer a clear effect of these variations on BHABs [1].
Much effort has been put in the monitoring of O. cf. ovata presence and blooms along the Italian coast and numerous studies focused on Ostreopsis phylogeography, taxonomy, ultrastructure, toxicology, and life-cycle with in depth understanding of the growth and toxicity responses to environmental conditions of several isolates in batch cultures [9–12,14,20–22].
Despite these considerable scientific advances, the unique and complex nature of the BHABs still poses questions as researchers’ acquaintance of bloom events mostly focuses on the planktonic system. Current knowledge of what affects BHAB organism presence, bloom onset, deleterious impact, and demise in benthic habitats is still scant, also due to the interplay between triggering factors (temperature, salinity, irradiance, microalgae nutrition and interactions) in bloom development, shifts, and dispersal in nature.
The use of microcosms to culture benthic communities on artificial substrata can represent a more realistic and dynamic approach to understand benthic bloom processes, starting from initial cell recruitment and adhesion to surfaces, to their growth in multilayered/network-like mature communities, their eventual detachment from host substrata and dispersion in the water column [23–25]. In this scenario, an incubator prototype specially designed for culturing aquatic phototrophic biofilms [26] was used to grow the whole microphytobenthic communities sampled during toxic O. cf. ovata outbreaks on artificial substrata at controlled environmental conditions. A microcosm approach provided the possibility to co-culture bloom microorganisms on polycarbonate slides in a moving film of medium in order to minimize planktonic growth under controlled temperature and light conditions in closed photobioreactors.
BHAB communities were sampled from bryozoans and macroalgal thalli at two “hot spots”, along the Latium coast (Middle Tyrrhenian Sea) identified during decadal monitoring of O. cf. ovata outbreak periodicity and intensity. Epibenthic biofilm samples were inoculated in the flow lane microcosm and cell growth and biofilm development were followed by means of automatic, real-time monitoring of biomass accumulation. This also allowed depiction of interaction processes of the bloom community with artificial substrata as cell accrual, surface adhesion, and coverage in confocal laser scanning microscopy of intact biofilms. A combination of confocal laser scanning microscope (CLSM) imaging and biochemical analysis was also applied to evidence spatial/biochemical interactions between biofilm members, compositional shifts, and matrix and toxin production in a low disturbance regime, simulating the conditions that support bloom development and persistence in nature.
2. Materials and Methods
2.1. Study Area and Sampling
Sampling was conducted in July and August 2009 at two stations along the Latium coast, Italy, Middle Tyrrhenian Sea (Formia, Site 1, 41◦1500000N, 13◦3700000E; and Sperlonga, Site 2, 41◦1503200N, 13◦2505800E), recurrently affected by Ostreospis cf. ovata summer blooms [3].
[-5]Both sites are shallow (mean depth 1.5 m), semi-enclosed rocky locations with low hydrodynamism; surface temperature, dissolved oxygen, salinity, and pH values were registered by YSI probes (YSI Inc., Yellow Springs, Oh, USA, Table1). Bryozoan samples, in July, and macroalgal thalli (Cystoseira sp., Phaeophyceae), in August, visibly colonised by conspicuous brownish mucous material, were opportunely collected in three replicates at 0.3 m depth, following the protocol reported in [27]. Briefly, the host organisms were hooded in plastic bags and promptly closed underwater to
Microorganisms 2017, 5, 46 3 of 15
avoid epibenthic cell loss, then transferred in plastic jars in the dark and refrigerated until laboratory analysis and preparation of culture inocula on the same day.
Table 1.Physical environment on sampling; host organism type and fresh weight (FW).
Parameters Site 1 Site 2
Temperature (◦C) 27.7 27.0 O2(%) 91.0 101.5 Salinity ( 1 ‰) 30.0 37.0 pH 7.8 8.2
Host substrata and FW 4 bryozoan colonies (28.3 g Run 1, 72.8 g Run 2) 2 Cystoseira sp. thalli (95 g Run 3) 2.2. Laboratory Analysis
2.2.1. Preparation of Inocula
Host samples were shaken in the storage water to allow detachment of epibenthic cells, then rinsed with filtered seawater (WhatmanGF/C filters GE Healthcare, Little Chalfont, UK) to completely remove biofilm material. Rinsing suspensions containing biofilm cells were sieved (100 µm mesh) to remove larger organisms and detritus. Bryozoans and macroalgae were weighted to determine fresh and dry weight (FW, DW).
2.2.2. Counting of Ostreopsis cf. ovata Cells
Aliquots of biofilm suspensions after homogenization were fixed in Lugol’s iodine solution and left to settle for 24 h in 25 mL counting chambers. Ostreopsis cells were counted according to the Utermöhl method [28] using a Zeiss Axiovert 100 microscope. Cell concentrations were expressed as cells g−1FW.
2.3. Microcosm Cultures
2 L fresh biofilm suspensions were poured into 4 L bottles containing 2 L of K/2 medium [29] to obtain a 4 L culture inoculum for each suspension. Three growth experiments, named Run 1, Run 2, and Run 3 were performed with the three different inocula at the same environmental conditions (Table1).
The methodological approach is shown in Figure1.
Microorganisms 2017, 5, 46 3 of 15
underwater to avoid epibenthic cell loss, then transferred in plastic jars in the dark and refrigerated until laboratory analysis and preparation of culture inocula on the same day.
Table 1. Physical environment on sampling; host organism type and fresh weight (FW).
Parameters Site 1 Site 2
Temperature (°C) 27.7 27.0
O2 (%) 91.0 101.5
Salinity (‰) 30.0 37.0
pH 7.8 8.2
Host substrata and FW 4 bryozoan colonies (28.3 g Run 1, 72.8 g Run 2) 2 Cystoseira sp. thalli (95 g Run 3) 2.2. Laboratory Analysis
2.2.1. Preparation of Inocula
Host samples were shaken in the storage water to allow detachment of epibenthic cells, then rinsed with filtered seawater (WhatmanGF/C filters GE Healthcare, Little Chalfont, UK) to completely remove biofilm material. Rinsing suspensions containing biofilm cells were sieved (100 µm mesh) to remove larger organisms and detritus. Bryozoans and macroalgae were weighted to determine fresh and dry weight (FW, DW).
2.2.2. Counting of Ostreopsis cf. ovata Cells
Aliquots of biofilm suspensions after homogenization were fixed in Lugol’s iodine solution and left to settle for 24 h in 25 mL counting chambers. Ostreopsis cells were counted according to the Utermöhl method [28] using a Zeiss Axiovert 100 microscope. Cell concentrations were expressed as cells g−1 FW.
2.3. Microcosm Cultures
2 L fresh biofilm suspensions were poured into 4 L bottles containing 2 L of K/2 medium [29] to obtain a 4 L culture inoculum for each suspension. Three growth experiments, named Run 1, Run 2, and Run 3 were performed with the three different inocula at the same environmental conditions (Table 1).
The methodological approach is shown in Figure 1.
Figure 1. Methodological approach. Host organisms were sampled (a) and the biofilms washed off and collected (b). Cell suspensions were filtered and inoculated in the flow lane incubator (c).
Two identical microcosms (biofilm growth systems) were used for July parallel cultures (Run 1 and Run 2) and one for the August experiment (Run 3), with simultaneous control of irradiance, temperature, and flow velocity. Each microcosm (UFZ Centre for Environmental Research, Magdeburg, Germany) contained four separate flow lanes (Figure 1) with integrated inlet and outlet devices at the start and the end of each lane. Each chamber had a 798 cm2 area made up of 42
removable polycarbonate slides, utilised as growth substrata. The inoculum was pumped from the 4
Figure 1.Methodological approach. Host organisms were sampled (a) and the biofilms washed off and collected (b). Cell suspensions were filtered and inoculated in the flow lane incubator (c).
Two identical microcosms (biofilm growth systems) were used for July parallel cultures (Run 1 and Run 2) and one for the August experiment (Run 3), with simultaneous control of irradiance, temperature, and flow velocity. Each microcosm (UFZ Centre for Environmental Research, Magdeburg, Germany) contained four separate flow lanes (Figure1) with integrated inlet and outlet devices at the start and the end of each lane. Each chamber had a 798 cm2area made up of 42 removable polycarbonate slides, utilised as growth substrata. The inoculum was pumped from the 4 L reservoir through the inlet device within each lane with a laminar flow of 50 L h−1over the growth surface. A turbulence reducer and a water temperature sensor were located at the inlet device of each chamber and the flow rate was valve-regulated. Temperature was set at 25◦C and irradiance at 110 µmol photons m−2·s−1. Fluorescent lamps (True-light 36 W AURALIGHT) were used in a 14/10 light/dark regime. The biofilm growth was followed for 50 days bloom duration at sampling sites, and accurately tracked on-line by the reduction in light transmittance measured in each chamber by nine light sensors positioned under the growth surface. Biofilm samples were collected at three temporal developmental phases: initial adhesion, active growth, and mature phase (corresponding to 90%, 50%, and 10% of the transmitted light, respectively) [26]. Each growth experiment ended when the recorded transmitted light was less than 10%, indicating the achievement of a stationary growth phase. Transmittance values were converted into a percentage of light absorbed by biofilms to obtain the growth curves [25,26]. The medium was changed at regular intervals (twice per week).
Biofilm Analyses:
• Biodiversity
To assess biodiversity of phototrophs in natural and cultured communities, samples scraped from randomly selected slides were fixed with formaldehyde at 2% and glutaraldehyde at 2.5% final concentrations and then stored at 4◦C. Fixed samples were examined using a ZEISS Axioskop light microscope equipped with differential interference contrast (DIC) at 40×and 100×objectives. Samples were also observed at light microscope after staining for 10 min with Alcian Blue (AB) 1% in HCl 0.5 N (pH 0.5) or in 3% acetic acid (pH 2.5) to evaluate the presence of sulfated and carboxylic polysaccharides in the extracellular matrix [30].
• Biomass
Cultured communities sampled at the three phases of development were scraped off the polycarbonate slides to evaluate the biomass. Biofilm biomass was determined as dry weight (DW) by oven drying samples at 60◦C for 72 h. Phototrophic biomass was assessed by determining Chl a concentration, extracted overnight in 90% acetone in the dark and then quantified spectrophotometrically according to [31].
• Structure
The biofilm architecture and spatial distribution of phototrophs during the different phases of development was obtained by observing intact biofilm, after non-destructive, non-invasive sampling, at the confocal laser scanning microscope (CLSM) (Olympus FV1000, IX81 using Plan-Apochromatic 60× (NA 1.42, oil) objectives) at the Centre of Advanced Microscopy “P. Albertano”, Department of Biology, University of Rome “Tor Vergata”, Rome, Italy. CLSM was used in a multichannel mode, whereby the different channels mapped individual biofilm components. The excitation wavelengths were in the blue (488 nm, Ar), green (543 nm, Ar/HeNe), and red (636 nm, Ar/HeNe) regions. Data consisted of a set of two dimensional (2D), cross-sectional images in the x-y plane that were captured along the z-axis. The three-dimensional images were obtained through acquisitions in the XY plane, Z step size 0.5 µm, using the software package IMARIS 6.2.0 software (Bitplane AG, Zurich, Switzerland).
Microorganisms 2017, 5, 46 5 of 15
• Spectral analyses
Spectral analysis (CLSM-SA) of different autofluorescence signals was also carried out on biofilm samples by using the lambda scan (λ scan) function of CLSM exciting specific regions of interest (1 µm2 ROIs) [32]. Lasers with the following excitation wavelengths: 488 nm; Ar, 543 nm; Ar/HeNe and red 635 nm; Ar/HeNe were used. Spectra were obtained for emission wavelengths ranging between 400 and 800 nm.
• Matrix exopolysaccharides
Bound/capsular exopolysaccharides (CPS) were also extracted from mature communities using 0.1 M H2SO4at 95◦C [33,34]. The carbohydrate fractions were measured spectrophotometrically using the phenol-sulphuric acid method [35]. In order to check the extraction efficiency of each eluent, the pellet obtained after the extraction was stained with Alcian Blue dyes, specific for acidic polysaccharides, to check localization of positive reaction in light microscopy [23]. CPS extracts were then analysed for their monosaccharide composition using RP-HPLC (reverse phase), using a Beckman Ultrasphere ODS (Octa Decyl Silane) column as reported in [36].
• Toxins
Ostreopsis toxins were analysed in inocula and culture material by LC-MS (Orbitrap XL). MALDI-TOF mass spectrometry for cyanobacterial toxins was performed by AnagnosTec GmBH (Postdam, Germany) on mature biofilm samples.
3. Results and Discussion
The dynamic approach employed here represents the first attempt to culture the whole O. cf. ovata BHAB community on substrata to better understand microphytobenthos/biofilm development and shifts under simplified, stable environmental conditions that can mimic bloom evolution in sheltered, temperate waters during summer.
3.1. Epibenthic Communities 3.1.1. Taxonomic Composition
Bryozoans and Cystoseira sp. (Phaeophyceae) hosted microphytobenthic communities with similar gross aspect and taxonomic composition irrespective of time and site of sampling. Epizoic and epiphytic associations macroscopically appeared as brownish mucous material, slightly diffluent and more or less adherent to the colonised surfaces. Light microscopy of host fragments revealed complex networks of microalgae and cyanobacteria. Epizoic associations in July samples included the dinoflagellates Ostreopsis cf. ovata, Amphidinium cf. carterae, Coolia monotis, and Prorocentrum lima. Among diatoms, solitary naviculoids and nitzschioid forms, along with tube dwelling and colonial species prevailed (Amphora spp., Ceratoneis closterium, Entomoneis sp., Grammatophora sp., Lichmophora spp., Rhabdonema sp.) over large centrics of Coscinodiscus and Thalassiosira genera. Fascicles of Nitzschia cf. martiana abundantly colonised bryozoans and had clusters of O. cf. ovata cells embedded in the mucopolysaccharidic material forming the diatom crenulated tube, as clearly evidenced by cytochemical staining in light microscopy (Figure2). Oscillatorialean cyanobacteria, mostly less than 3 µm in diameter, and few coccal morphotypes were also largely present. Cystoseira sp. thalli, sampled in August, appeared to host proportionally more abundant Ostreopsis cf. ovata and Coolia monotis cells.
Microorganisms 2017, 5, 46 6 of 15
extracts were then analysed for their monosaccharide composition using RP-HPLC (reverse
phase), using a Beckman Ultrasphere ODS (Octa Decyl Silane) column as reported in [36].
•
Toxins
Ostreopsis toxins were analysed in inocula and culture material by LC-MS (Orbitrap XL).
MALDI-TOF mass spectrometry for cyanobacterial toxins was performed by AnagnosTec
GmBH (Postdam, Germany) on mature biofilm samples.
3. Results and Discussion
The dynamic approach employed here represents the first attempt to culture the whole O. cf.
ovata BHAB community on substrata to better understand microphytobenthos/biofilm development
and shifts under simplified, stable environmental conditions that can mimic bloom evolution in
sheltered, temperate waters during summer.
3.1. Epibenthic Communities
3.1.1. Taxonomic Composition
Bryozoans and Cystoseira sp. (Phaeophyceae) hosted microphytobenthic communities with
similar gross aspect and taxonomic composition irrespective of time and site of sampling. Epizoic
and epiphytic associations macroscopically appeared as brownish mucous material, slightly
diffluent and more or less adherent to the colonised surfaces. Light microscopy of host fragments
revealed complex networks of microalgae and cyanobacteria. Epizoic associations in July samples
included the dinoflagellates Ostreopsis cf. ovata, Amphidinium cf. carterae, Coolia monotis, and
Prorocentrum lima. Among diatoms, solitary naviculoids and nitzschioid forms, along with tube
dwelling and colonial species prevailed (Amphora spp., Ceratoneis closterium, Entomoneis sp.,
Grammatophora sp., Lichmophora spp., Rhabdonema sp.) over large centrics of Coscinodiscus and
Thalassiosira genera. Fascicles of Nitzschia cf. martiana abundantly colonised bryozoans and had
clusters of O. cf. ovata cells embedded in the mucopolysaccharidic material forming the diatom
crenulated tube, as clearly evidenced by cytochemical staining in light microscopy (Figure 2).
Oscillatorialean cyanobacteria, mostly less than 3 µm in diameter, and few coccal morphotypes were
also largely present. Cystoseira sp. thalli, sampled in August, appeared to host proportionally more
abundant Ostreopsis cf. ovata and Coolia monotis cells.
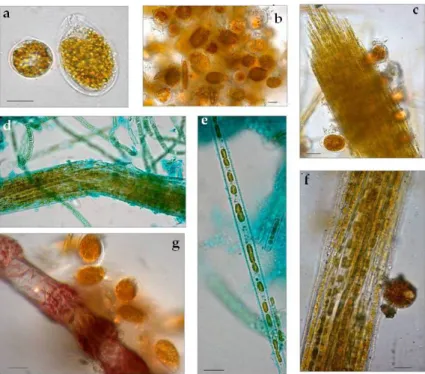
Figure 2. Light micrographs of July bloom communities washed off briozoa, Ostreopsis cf. ovata, and
Coolia monotis (a), O. cf. ovata and centric diatoms (b), fascicle of Nitzschia cf. martiana cells bearing individuals of O. cf. ovata (c) and C. monotis (f). Alcian blue pH 2.5 staining: the exopolysaccharidic
Figure 2.Light micrographs of July bloom communities washed off briozoa, Ostreopsis cf. ovata, and Coolia monotis (a), O. cf. ovata and centric diatoms (b), fascicle of Nitzschia cf. martiana cells bearing individuals of O. cf. ovata (c) and C. monotis (f). Alcian blue pH 2.5 staining: the exopolysaccharidic tube of N. cf. martiana and the sheaths of filamentous cyanobacteria are highlighted in (d) N. cf. martiana in valvar view (e), O. cf. ovata embedded in mucilage around an epizoic red alga branch (g).
3.1.2. O. cf. ovata Abundance
Inverted microscope counting showed abundances of 0.013, 0.062, and 0.103 cell g−1FW for Run 1, Run 2, and Run 3 inocula used for the culture experiments in the microcosms.
Recurrence of these composition patterns was also recorded during BHAB monitoring along Northern Adriatic sea coast [7] and along Catalonia coast (Spain, NW Mediterrenean sea) [37] and concentration data reflect ranges and variation observed in the Mediterranean basin [19].
3.2. Growth in the Microcosm
Biofilm did grow on the artificial substrata placed on the bottom of the microcosm lanes under high temperature and low disturbance simulating conditions that support bloom development in the sampling sites. Non-destructive, real-time monitoring of biomass accumulation was obtained by recordings of the subsurface light sensors. After inoculation, during which microorganisms settled and adhered onto the slides, a lag phase followed (Figure3). Initial phases lasted only three days in Run 3 but up to ten in Run 1 and Run 2 cultures. Exponential growth (active phase) followed in the three growth experiments and cultures displayed different maximum growth rates, the highest registered for Run 1 and Run 2 communities. After a period of exponential increase, curves assumed a S-shape and reached a stationary phase indicating similar trends in biomass accrual. These trends are comparable to those obtained for marine biofilms of the Schelde estuary mudflats (The Netherlands), cultivated in the same system [24]. During the late development phase, biofilm sloughing occurred in Run 3 at day 38, likely due to a lower adhesive potential of the biofilm, resulting from lower exopolysaccharide content estimates in Run 3 cultures (0.012 mg cm−2) compared to Run 1 (0.038 mg cm−2) and Run 2 (0.028 mg cm−2). In any case, partial detachment of biofilm flocs was recorded during the experimental time in the three Runs, likely due to diffusion limitation caused by biofilm thickness. This can be considered one factor intrinsic to the biofilm causing dispersion of the BHAB cells in the water column in nature.
Microorganisms 2017, 5, 46 7 of 15
Microorganisms 2017, 5, 46 6 of 15
tube of N. cf. martiana and the sheaths of filamentous cyanobacteria are highlighted in (d) N. cf.
martiana in valvar view (e), O. cf. ovata embedded in mucilage around an epizoic red alga branch (g).
3.1.2. O. cf. ovata Abundance
Inverted microscope counting showed abundances of 0.013, 0.062, and 0.103 cell g
−1FW for Run
1, Run 2, and Run 3 inocula used for the culture experiments in the microcosms.
Recurrence of these composition patterns was also recorded during BHAB monitoring along
Northern Adriatic sea coast [7] and along Catalonia coast (Spain, NW Mediterrenean sea) [37] and
concentration data reflect ranges and variation observed in the Mediterranean basin [19].
3.1. Growth in the Microcosm
Biofilm did grow on the artificial substrata placed on the bottom of the microcosm lanes under
high temperature and low disturbance simulating conditions that support bloom development in
the sampling sites. Non-destructive, real-time monitoring of biomass accumulation was obtained by
recordings of the subsurface light sensors. After inoculation, during which microorganisms settled
and adhered onto the slides, a lag phase followed (Figure 3). Initial phases lasted only three days in
Run 3 but up to ten in Run 1 and Run 2 cultures. Exponential growth (active phase) followed in the
three growth experiments and cultures displayed different maximum growth rates, the highest
registered for Run 1 and Run 2 communities. After a period of exponential increase, curves assumed
a S-shape and reached a stationary phase indicating similar trends in biomass accrual. These trends
are comparable to those obtained for marine biofilms of the Schelde estuary mudflats (The
Netherlands), cultivated in the same system [24]. During the late development phase, biofilm
sloughing occurred in Run 3 at day 38, likely due to a lower adhesive potential of the biofilm,
resulting from lower exopolysaccharide content estimates in Run 3 cultures (0.012 mg cm
−2)
compared to Run 1 (0.038 mg cm
−2) and Run 2 (0.028 mg cm
−2). In any case, partial detachment of
biofilm flocs was recorded during the experimental time in the three Runs, likely due to diffusion
limitation caused by biofilm thickness. This can be considered one factor intrinsic to the biofilm
causing dispersion of the BHAB cells in the water column in nature.
Figure 3. Growth curves obtained by transforming the on-line recorded light transmitted values in
light absorbance (A). Linear portion of the natural log transformed data (B).
3.2. Biofilm Observations
Macroscopic observations of biofilms were performed daily to monitor biofilm development on
the slides. Initial adhesion and substratum colonisation appeared as stochastic processes in the three
experiments performed. Cultures appeared as series of large patches, different in pigmentation that
became more coherent with experimental time, when a more homogeneous coverage of substrata
was visible. At the end of the experiments, corresponding to the late phase of development, biofilms
Figure 3.Growth curves obtained by transforming the on-line recorded light transmitted values in light absorbance (A). Linear portion of the natural log transformed data (B).
3.3. Biofilm Observations
Macroscopic observations of biofilms were performed daily to monitor biofilm development on the slides. Initial adhesion and substratum colonisation appeared as stochastic processes in the three experiments performed. Cultures appeared as series of large patches, different in pigmentation that became more coherent with experimental time, when a more homogeneous coverage of substrata was visible. At the end of the experiments, corresponding to the late phase of development, biofilms were approximately 1 mm thick. At this phase, microorganisms formed macroscopic, mucilaginous, bright blue-green mats, showing a coherent structure, where the filamentous forms were more or less oriented to the flow direction of the culture medium (Figure4).
Microorganisms 2017, 5, 46 7 of 15
were approximately 1 mm thick. At this phase, microorganisms formed macroscopic, mucilaginous, bright blue-green mats, showing a coherent structure, where the filamentous forms were more or less oriented to the flow direction of the culture medium (Figure 4).
Figure 4. Microcosm lane with bottom slides colonised by biofilm. Coverage is patchy and differently pigmented portions are visible.
Light microscopy observations of biofilm-fixed fragments scraped from randomly selected polycarbonate slides during the three Runs performed, showed a general reduction in taxon richness of cultures over experimental time. O. cf. ovata cells were healthy and proliferated at initial and active phases (Figure 5a,b), but then Amphidinium cf. carterae dominated among dinoflagellates and a general prevalence of filamentous, straight, or tightly coiled, non heterocytous cyanobacteria (Leptolyngbya, Lyngbya, Oscillatoria, Microcoleous, Phormidium, Pseudanabaena, Spirulina spp.) was observed in later phases (Figure 5 c–i). Among diatoms, tube-dwelling species dominated in late growth phases (Parlibellus sp.) along with the solitary Amphora spp. and Ceratoneis closterium (Figure 5 c, g, i). This loss in diversity and shift to cyanobacterial dominance has also been reported in other experiments performed on phototrophic biofilms cultivated in photobioreactors [24,25].
Figure 5. Light microscopy showed shifts in biofilm composition in all Runs and prevalence of cyanobacteria in late growth phases. O. cf. ovata cells were healthy and proliferating at initial (a), (b) Figure 4.Microcosm lane with bottom slides colonised by biofilm. Coverage is patchy and differently pigmented portions are visible.
Microorganisms 2017, 5, 46 8 of 15
Light microscopy observations of biofilm-fixed fragments scraped from randomly selected polycarbonate slides during the three Runs performed, showed a general reduction in taxon richness of cultures over experimental time. O. cf. ovata cells were healthy and proliferated at initial and active phases (Figure 5a,b), but then Amphidinium cf. carterae dominated among dinoflagellates and a general prevalence of filamentous, straight, or tightly coiled, non heterocytous cyanobacteria (Leptolyngbya, Lyngbya, Oscillatoria, Microcoleous, Phormidium, Pseudanabaena, Spirulina spp.) was observed in later phases (Figure5c–i). Among diatoms, tube-dwelling species dominated in late growth phases (Parlibellus sp.) along with the solitary Amphora spp. and Ceratoneis closterium (Figure5c,g,i). This loss in diversity and shift to cyanobacterial dominance has also been reported in other experiments performed on phototrophic biofilms cultivated in photobioreactors [24,25].
were approximately 1 mm thick. At this phase, microorganisms formed macroscopic, mucilaginous,
bright blue-green mats, showing a coherent structure, where the filamentous forms were more or
less oriented to the flow direction of the culture medium (Figure 4).
Figure 4. Microcosm lane with bottom slides colonised by biofilm. Coverage is patchy and differently
pigmented portions are visible.
Light microscopy observations of biofilm-fixed fragments scraped from randomly selected
polycarbonate slides during the three Runs performed, showed a general reduction in taxon richness
of cultures over experimental time. O. cf. ovata cells were healthy and proliferated at initial and
active phases (Figure 5a,b), but then Amphidinium cf. carterae dominated among dinoflagellates and a
general prevalence of filamentous, straight, or tightly coiled, non heterocytous cyanobacteria
(Leptolyngbya, Lyngbya, Oscillatoria, Microcoleous, Phormidium, Pseudanabaena, Spirulina spp.) was
observed in later phases (Figure 5 c–i). Among diatoms, tube-dwelling species dominated in late
growth phases (Parlibellus sp.) along with the solitary Amphora spp. and Ceratoneis closterium (Figure
5 c, g, i). This loss in diversity and shift to cyanobacterial dominance has also been reported in other
experiments performed on phototrophic biofilms cultivated in photobioreactors [24,25].
Figure 5. Light microscopy showed shifts in biofilm composition in all Runs and prevalence of
cyanobacteria in late growth phases. O. cf. ovata cells were healthy and proliferating at initial (a), (b)
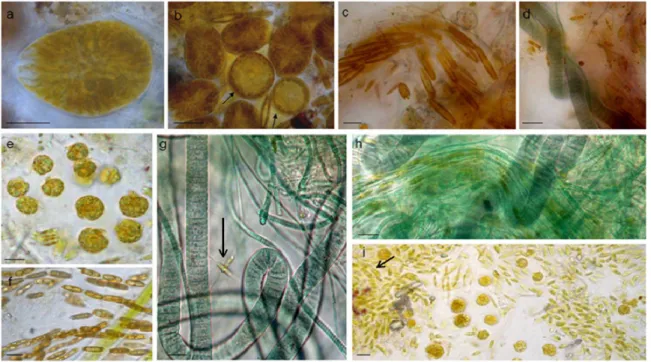
Figure 5. Light microscopy showed shifts in biofilm composition in all Runs and prevalence ofcyanobacteria in late growth phases. O. cf. ovata cells were healthy and proliferating at initial (a,b) and active phases. Coscinodiscus sp. (b, arrow) at initial phase of Run 3. Tube dwelling diatoms (c,f); active phase, Run 2) were abundant in all biofilms, along with Ceratoneis closterium (g, arrow) and Amphora spp. layered cells (i, arrow), while Oscillatorialean cyanobacteria (d,g,h) dominated the last development phases. Amphidinium cf. carterae (e,i) was also abundant in the last phases. Bars = 10 µm. 3.4. Biofilm Matrix
Biofilm microorganisms were immersed in an acidic exopolymeric matrix as revealed by light microscopy observations after biofilm staining with Alcian Blue dyes. Moreover, sulphated and carboxylated groups were present in the capsular polysaccharides of the cyanobacterial envelopes and in the tubes or diffluent mucilage produced by raphid diatoms. CPS extracted from all biofilm communities also contained at least seven different neutral sugars (Figure6a). Findings on sugar composition in mature phase samples agreed with data obtained for cultured biofilms dominated by cyanobacteria [23,36]. Exopolysaccharide-producing microorganisms are favoured in nutrient supply and internal recycling, and this can explain their prevalence in the late development phase. EPS (Exopolymeric Substances) also provided high light screening of the outermost biofilm phototrophs, pointing to a key role of EPS production capacity in shaping the mature biofilm phase.
Microorganisms 2017, 5, 46 9 of 15
Microorganisms 2017, 5, 46 8 of 15
and active phases. Coscinodiscus sp. (b, arrow) at initial phase of Run 3. Tube dwelling diatoms (c), (f); active phase, Run 2) were abundant in all biofilms, along with Ceratoneis closterium (g, arrow) and Amphora spp. layered cells (i arrow), while Oscillatorialean cyanobacteria (d), (g), (h) dominated the last development phases. Amphidinium cf. carterae (e), (i) was also abundant in the last phases. Bars = 10 µm.
3.3. Biofilm Matrix
Biofilm microorganisms were immersed in an acidic exopolymeric matrix as revealed by light
microscopy observations after biofilm staining with Alcian Blue dyes. Moreover, sulphated and
carboxylated groups were present in the capsular polysaccharides of the cyanobacterial envelopes
and in the tubes or diffluent mucilage produced by raphid diatoms. CPS extracted from all biofilm
communities also contained at least seven different neutral sugars (Figure 6a). Findings on sugar
composition in mature phase samples agreed with data obtained for cultured biofilms dominated by
cyanobacteria [23,36]. Exopolysaccharide-producing microorganisms are favoured in nutrient
supply and internal recycling, and this can explain their prevalence in the late development phase.
EPS (Exopolymeric Substances) also provided high light screening of the outermost biofilm
phototrophs, pointing to a key role of EPS production capacity in shaping the mature biofilm phase.
Figure 6. Biofilm capsular exopolysaccharides (CPS) monosaccharides in mature samples grown at
each Run. Different proportions of 8 neutral sugars differed between Runs, data are expressed as mol % (a). Dry weight (b) and chlorophyll a content (c) values of biofilms at the three development phases, increasing trends over time were detected for both biomass indicators.
3.4. Biomass
Due to the heterogeneous distribution of microorganisms on substrata and the high biomass
development at the late growth phases, sampling for counting biofilm members was not considered
as representative of the diversity observed. Thus, biomass accumulation was estimated as dry weight
(mg cm
−2) and chlorophyll a content (µg cm
−2), confirming trends of growth curves (Figure 6b,c,
respectively).
3.5. Biofilm Structure
Confocal microscopy analyses were carried out by directly observing biofilms on the
polycarbonate slides. This allowed preservation of biofilm integrity during sampling and analysis of
the spatial relationships among biofilm members and with the substrata throughout biofilm
development. Visualization of biofilm architecture, based on the autofluorescence signals of the
different photosynthetic organisms, also allowed analysis of the inner components immersed in the
biofilm thickness at the three sampled phases.
An in depth observation of the “patchwork” coverage of initial phases revealed that 10-day-old
biofilms already had a complex structure and thickness that could reach 150 µm in Run 1 (Figure
Figure 6.Biofilm capsular exopolysaccharides (CPS) monosaccharides in mature samples grown at each Run. Different proportions of 8 neutral sugars differed between Runs, data are expressed as mol % (a). Dry weight (b) and chlorophyll a content (c) values of biofilms at the three development phases, increasing trends over time were detected for both biomass indicators.
3.5. Biomass
Due to the heterogeneous distribution of microorganisms on substrata and the high biomass development at the late growth phases, sampling for counting biofilm members was not considered as representative of the diversity observed. Thus, biomass accumulation was estimated as dry weight (mg cm−2) and chlorophyll a content (µg cm−2), confirming trends of growth curves (Figure6b,c, respectively).
3.6. Biofilm Structure
Confocal microscopy analyses were carried out by directly observing biofilms on the polycarbonate slides. This allowed preservation of biofilm integrity during sampling and analysis of the spatial relationships among biofilm members and with the substrata throughout biofilm development. Visualization of biofilm architecture, based on the autofluorescence signals of the different photosynthetic organisms, also allowed analysis of the inner components immersed in the biofilm thickness at the three sampled phases.
An in depth observation of the “patchwork” coverage of initial phases revealed that 10-day-old biofilms already had a complex structure and thickness that could reach 150 µm in Run 1 (Figure7a,b). O. cf. ovata cells were healthy and proliferating at initial and active biofilm phases. Spectral analysis of cells confirmed the results (Figure 8). Different regions of interest (ROI) were acquired and excited with different laser wavelength and the reported obtained spectra (Figure8) showed active peridinin–chlorophyll a-protein complexes [38] for light absorption (Figure8). The possibility to perform the spectral analysis of individual cells allowed discrimination between the different autofluorescent signals, providing a community fingerprint based on the properties of photosynthetic pigments.
As the biofilm matured, so did its complexity with stratification and heterogeneous distribution of the organisms on substrata, resulting in the formation of voids and “valleys” (Figures9and10). Biofilm filamentous members, cyanobacteria and tube-dwelling diatoms, were mostly responsible of the layered structures observed (Figure9c), while voids appeared especially around Amphidinium cf. carterae cell clusters, indicating exclusion of other biofilm members possibly due to the production of allelopathic compounds or mucous capsules around cell clusters (Figures 9c and 10a) [23,41]. The ‘valley’ aspect was due to globular microcolonies of coccal cyanobacteria, evidencing active, multiple cell divisions (Figure10c,d).
Microorganisms 2017, 5, 46 10 of 15 7a,b). O. cf. ovata cells were healthy and proliferating at initial and active biofilm phases. Spectral
analysis of cells confirmed the results (Figure 8).Different regions of interest (ROI) were acquired and excited with different laser wavelength and the reported obtained spectra (Figure 8) showed active peridinin–chlorophyll a-protein complexes [38] for light absorption (Figure 8). The possibility to perform the spectral analysis of individual cells allowed discrimination between the different autofluorescent signals, providing a community fingerprint based on the properties of photosynthetic pigments.
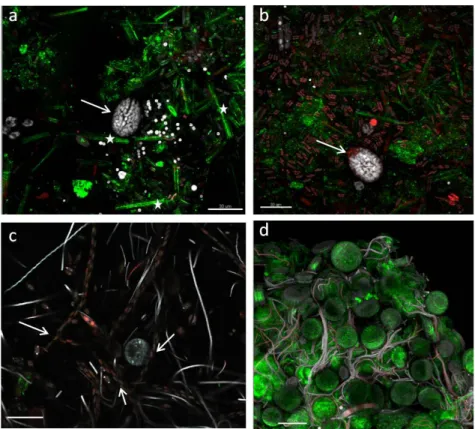
Figure 7. Confocal laser scanning microscopy (CLSM) 3D biofilm reconstruction at initial (a), (b), and active (c), (d) phases. O. cf. ovata cells are clearly visible in the median part of the uppermost images (a, b arrows) showing numerous, elongated chloroplasts located at the cell periphery. Green signal was obtained with a 488-nm laser source, emission of frustule autofluorescence [39,40] is visible in (a, asterisk) where elongated diatoms occurr sparse on the slide, while a dense cluster of Coscinodiscus sp. lies interspersed with thin cyanobacterial trichomes in (d). White and red signals were captured after 543- and 635-nm laser excitation of accessory pigments and chlorophyll a of biofilm phototrophs. Filaments of small naviculoids are visible in pale red in (c, arrows) Bars = 30 (a,b), 40 (c,d) µm.
Figure 7.Confocal laser scanning microscopy (CLSM) 3D biofilm reconstruction at initial (a,b), and active (c,d) phases. O. cf. ovata cells are clearly visible in the median part of the uppermost images (a,b, arrows) showing numerous, elongated chloroplasts located at the cell periphery. Green signal was obtained with a 488-nm laser source, emission of frustule autofluorescence [39,40] is visible in (a, asterisk) where elongated diatoms occurr sparse on the slide, while a dense cluster of Coscinodiscus sp. lies interspersed with thin cyanobacterial trichomes in (d). White and red signals were captured after 543- and 635-nm laser excitation of accessory pigments and chlorophyll a of biofilm phototrophs. Filaments of small naviculoids are visible in pale red in (c, arrows) Bars = 30 (a,b), 40 (c,d) µm.Microorganisms 2017, 5, 46 10 of 15
Figure 8. Spectral analysis at CLSM of O. cf. ovata, above, and A. cf. carterae after excitation with a 543 HeNe laser source. In (a) and (d) the original 3D reconstructions used for the SA, in (b) and (e), respectively, magnifications of the slices selected. Different regions of interest (ROIs) were acquired and labelled: 1 (encircling an O. cf. ovata cell) and 2 (encircling a substratum portion) of (b); 2 (encircling the growth substratum) and 3, 4, 5 (encircling Amphidinium cf. carterae cells) in (e). After excitation, the emission spectra relative to the selected ROIs where plotted (c, f), peaks in the 680-nm region are typical of peridinin–chlorophyll a-protein complexes present in both dinoflagellates. Bars = 30 µm
As the biofilm matured, so did its complexity with stratification and heterogeneous distribution of the organisms on substrata, resulting in the formation of voids and “valleys” (Figures 9 and 10). Biofilm filamentous members, cyanobacteria and tube-dwelling diatoms, were mostly responsible of the layered structures observed (Figure 9c), while voids appeared especially around Amphidinium cf.
carterae cell clusters, indicating exclusion of other biofilm members possibly due to the production of
allelopathic compounds or mucous capsules around cell clusters (Figures 9c and 10a) [23,41]. The ‘valley’ aspect was due to globular microcolonies of coccal cyanobacteria, evidencing active, multiple cell divisions (Figure 10c,d).
Figure 9. CLSM volume rendering of biofilm at initial phase (a), 3D reconstruction (b) and volume rendering (c) of samples at the active phase, signals are colour-coded as in Figure 7. Network (b arrow) and layering (c arrow) across the biofilm thickness are visible in the most advanced growth phases as well as the presence of voids (c, double arrow). Bars = 40 µm.
Figure 8. Spectral analysis at CLSM of O. cf. ovata, above, and A. cf. carterae after excitation with a 543 HeNe laser source. In (a,d) the original 3D reconstructions used for the SA, in (b,e), respectively, magnifications of the slices selected. Different regions of interest (ROIs) were acquired and labelled: 1 (encircling an O. cf. ovata cell) and 2 (encircling a substratum portion) of (b); 2 (encircling the growth substratum) and 3, 4, 5 (encircling Amphidinium cf. carterae cells) in (e). After excitation, the emission spectra relative to the selected ROIs where plotted (c,f), peaks in the 680-nm region are typical of peridinin–chlorophyll a-protein complexes present in both dinoflagellates. Bars = 30 µm.
Microorganisms 2017, 5, 46 11 of 15
Microorganisms 2017, 5, 46 10 of 15
Figure 8. Spectral analysis at CLSM of O. cf. ovata, above, and A. cf. carterae after excitation with a 543 HeNe laser source. In (a) and (d) the original 3D reconstructions used for the SA, in (b) and (e), respectively, magnifications of the slices selected. Different regions of interest (ROIs) were acquired and labelled: 1 (encircling an O. cf. ovata cell) and 2 (encircling a substratum portion) of (b); 2 (encircling the growth substratum) and 3, 4, 5 (encircling Amphidinium cf. carterae cells) in (e). After excitation, the emission spectra relative to the selected ROIs where plotted (c, f), peaks in the 680-nm region are typical of peridinin–chlorophyll a-protein complexes present in both dinoflagellates. Bars = 30 µm
As the biofilm matured, so did its complexity with stratification and heterogeneous distribution of the organisms on substrata, resulting in the formation of voids and “valleys” (Figures 9 and 10). Biofilm filamentous members, cyanobacteria and tube-dwelling diatoms, were mostly responsible of the layered structures observed (Figure 9c), while voids appeared especially around Amphidinium cf. carterae cell clusters, indicating exclusion of other biofilm members possibly due to the production of allelopathic compounds or mucous capsules around cell clusters (Figures 9c and 10a) [23,41]. The ‘valley’ aspect was due to globular microcolonies of coccal cyanobacteria, evidencing active, multiple cell divisions (Figure 10c,d).
Figure 9. CLSM volume rendering of biofilm at initial phase (a), 3D reconstruction (b) and volume rendering (c) of samples at the active phase, signals are colour-coded as in Figure 7. Network (b arrow) and layering (c arrow) across the biofilm thickness are visible in the most advanced growth phases as well as the presence of voids (c, double arrow). Bars = 40 µm.
Figure 9.CLSM volume rendering of biofilm at initial phase (a), 3D reconstruction (b) and volume rendering (c) of samples at the active phase, signals are colour-coded as in Figure7. Network (b, arrow) and layering (c, arrow) across the biofilm thickness are visible in the most advanced growth phases as well as the presence of voids (c, double arrow). Bars = 40 µm.
Microorganisms 2017, 5, 46 11 of 15
Figure 10. CLSM volume renderings (a), (c), (d), and 3D reconstruction (b) of biofilm at mature phases. Networks of diverse, more or less oriented, filamentous cyanobacteria lie close to clusters of
Amphidinium cf. carterae cells, apparently excluding other biofilm organisms (a, arrow), and of large
raphid diatoms (b, arrow). 3D renderings evidencing microcolonies of actively dividing coccal, colonial cyanobacteria (c arrow), forming channels (c, double arrow) and valleys (d, arrow)). White signal was obtained with a 488-nm laser source, magenta and cyan colour codes using 543-nm and 635-nm laser sources, respectively. Bars = 40 µm.
Low-magnification observations carried out to evaluate the structure and proportions of the different phototrophic components at active and mature communities showed biofilms strongly characterized by the dominance of cyanobacteria and the abundant presence of only a few diatoms taxa (Figure 9a and Figure 10a,b,c). Cyanobacteria represented the best competitors in the advanced phases of community development probably due to their capacity to thrive in the low light microenvironments established across the biofilm thickness as also shown in [36]. This could imply a risk of massive cyanobacterial development in benthic habitats and toxicity outbreaks, although our simplified conditions excluded zooplankton and invertebrate predators that would also shape the algal structure and relative abundance of each taxa. In any case, MALDI-TOF analysis of mature biofilms cultured in this study did not evidence bioactive compounds. Occasionally, loosely attached filamentous phototrophs, streamers, were observed floating in flow direction in biofilms at the mature phase. These structures could reflect an increase in surface area and a reduction in surface-boundary layer and secondly could be a mode of dispersal as these small communities could have better chance of survival when inhabiting a new environment (Figure 11a,b).
Figure 10.CLSM volume renderings (a,c,d), and 3D reconstruction (b) of biofilm at mature phases. Networks of diverse, more or less oriented, filamentous cyanobacteria lie close to clusters of Amphidinium cf. carterae cells, apparently excluding other biofilm organisms (a, arrow), and of large raphid diatoms (b, arrow). 3D renderings evidencing microcolonies of actively dividing coccal, colonial cyanobacteria (c arrow), forming channels (c, double arrow) and valleys (d, arrow)). White signal was obtained with a 488-nm laser source, magenta and cyan colour codes using 543-nm and 635-nm laser sources, respectively. Bars = 40 µm.
Low-magnification observations carried out to evaluate the structure and proportions of the different phototrophic components at active and mature communities showed biofilms strongly characterized by the dominance of cyanobacteria and the abundant presence of only a few diatoms taxa (Figures9a and10a,b,c). Cyanobacteria represented the best competitors in the advanced phases of community development probably due to their capacity to thrive in the low light microenvironments
established across the biofilm thickness as also shown in [36]. This could imply a risk of massive cyanobacterial development in benthic habitats and toxicity outbreaks, although our simplified conditions excluded zooplankton and invertebrate predators that would also shape the algal structure and relative abundance of each taxa. In any case, MALDI-TOF analysis of mature biofilms cultured in this study did not evidence bioactive compounds. Occasionally, loosely attached filamentous phototrophs, streamers, were observed floating in flow direction in biofilms at the mature phase. These structures could reflect an increase in surface area and a reduction in surface-boundary layer and secondly could be a mode of dispersal as these small communities could have better chance of survival when inhabiting a new environment (FigureMicroorganisms 2017, 5, 46 11a,b). 12 of 15
(a) (b)
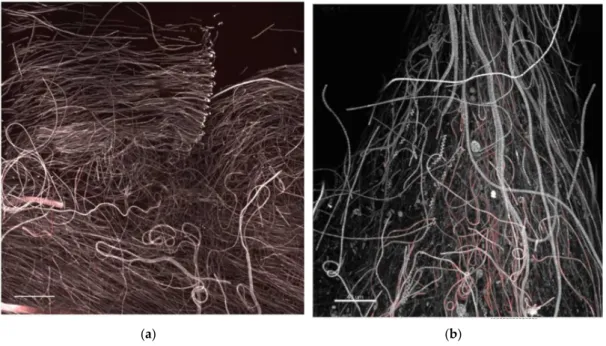
Figure 11. CLSM 3D recontructions of biofilm at mature phases showing layering of oriented, filamentous cyanobacteria (brighter autofluorescence at filament apex is possibly due to a light stimulus response) in (a) and occasional observation of loosely attached filamentous phototrophs or streamers, floating in flow direction (b), colour coded as in Figure 7. Bars = 40 µm.
This study contributed to describing the fate of an O. cf. ovata BHAB on artificial substrata under microcosm simplified, stable environmental conditions. It is often difficult to investigate biofilms in nature because of the large range of biotic and abiotic interactions that occur, the consequent ambiguity of experimental conditions, and the impossibility to maintain biofilm integrity during sampling procedures. Results indicated that at the low disturbance conditions tested, life-form strategies, competitiveness for resources, and possibly allelopathic interactions shaped the structure of the cultures during the biofilm growth. Toxin production did not occur in culture, although toxins were recorded in the inocula used for the experiments (0.137, 0.049, and 0.044 pg cell−1 of ovatoxin a in Run 1, Run 2, and Run 3, respectively). Phototrophs with a
filamentous growth habit and surface-associated motility, such as tube-dwelling diatoms and cyanobacteria (thin, light orientated, trichomes), out-competed flagellated life-forms. Exploitation of more favourable compartments was obvious in development of streamers floating in the flow direction. These accounted for an increase in surface area and could be a favourable mode of dispersal. In the hydrodynamic conditions tested, O. cf. ovata, possibly relying on vertical migrations to reduce surface-boundary layers and resource limitation, was limited in its vegetative growth.
Acknowledgments: We thank Elena Romano for her skillful assistance during CLSM sessions and NTW Ellwood for constructive criticisms. This work was carried out in the frame of the national project “Ostreopsis
ovata e Ostreopsis spp.: nuovi rischi di tossicità microalgale nei mari italiani“ ICRAM-Ministero Ambiente.
Author Contributions: Roberta Congestri and Francesca Di Pippo designed and performed the experiments as well as data analysis and paper writing.
Conflicts of Interest: The authors declare no conflict of interest.
References
1. Berdalet, E.; Tester, P.A.; Chinain, M.; Fraga, S.; Lemée, R.; Litaker, W.; Penna, A.; Usup, G.; Vila, M.; Zingone, A. Harmful algal blooms in benthic systems: Recent progress and future research. Oceanography 2017, 30, 36–45, doi:10.5670/oceanog.2017.108.
Figure 11. CLSM 3D recontructions of biofilm at mature phases showing layering of oriented, filamentous cyanobacteria (brighter autofluorescence at filament apex is possibly due to a light stimulus response) in (a) and occasional observation of loosely attached filamentous phototrophs or streamers, floating in flow direction (b), colour coded as in Figure7. Bars = 40 µm.
This study contributed to describing the fate of an O. cf. ovata BHAB on artificial substrata under microcosm simplified, stable environmental conditions. It is often difficult to investigate biofilms in nature because of the large range of biotic and abiotic interactions that occur, the consequent ambiguity of experimental conditions, and the impossibility to maintain biofilm integrity during sampling procedures. Results indicated that at the low disturbance conditions tested, life-form strategies, competitiveness for resources, and possibly allelopathic interactions shaped the structure of the cultures during the biofilm growth. Toxin production did not occur in culture, although toxins were recorded in the inocula used for the experiments (0.137, 0.049, and 0.044 pg cell−1of ovatoxin a in Run 1, Run 2, and Run 3, respectively). Phototrophs with a filamentous growth habit and surface-associated motility, such as tube-dwelling diatoms and cyanobacteria (thin, light orientated, trichomes), out-competed flagellated life-forms. Exploitation of more favourable compartments was obvious in development of streamers floating in the flow direction. These accounted for an increase in surface area and could be a favourable mode of dispersal. In the hydrodynamic conditions tested, O. cf. ovata, possibly relying on vertical migrations to reduce surface-boundary layers and resource limitation, was limited in its vegetative growth.
Acknowledgments:We thank Elena Romano for her skillful assistance during CLSM sessions and NTW Ellwood for constructive criticisms. This work was carried out in the frame of the national project “Ostreopsis ovata e Ostreopsis spp.: nuovi rischi di tossicità microalgale nei mari italiani“ ICRAM-Ministero Ambiente.
Microorganisms 2017, 5, 46 13 of 15
Author Contributions:Roberta Congestri and Francesca Di Pippo designed and performed the experiments as well as data analysis and paper writing.
Conflicts of Interest:The authors declare no conflict of interest.
References
1. Berdalet, E.; Tester, P.A.; Chinain, M.; Fraga, S.; Lemée, R.; Litaker, W.; Penna, A.; Usup, G.; Vila, M.; Zingone, A. Harmful algal blooms in benthic systems: Recent progress and future research. Oceanography 2017, 30, 36–45. [CrossRef]
2. Accoroni, S.; Totti, C. The toxic benthic dinoflagellates of the genus Ostreopsis in temperate areas: A review. Adv. Oceanogr. Limnol. 2016, 7, 1–15. [CrossRef]
3. Bianco, I.; Congestri, R.; Sangiorgi, V.; Albertano, P.; Zaottini, E. Fioriture di microalghe potenzialmente tossiche lungo le coste laziali. Biol. Mar. Mediterr. 2006, 13, 947–950.
4. Simoni, F.; Gaddi, A.; Di Paolo, C.; Lepri, L. Harmful epiphytic dinoflagellate on Tyrrhenian Sea reefs. Harmful Algae News 2003, 24, 13–14.
5. Penna, A.; Fraga, S.; Battocchi, C.; Casabianca, S.; Perini, F.; Capellacci, S.; Casabianca, A.; Riobo, P.; Giacobbe, M.; Totti, C.; et al. Genetic diversity of the genus Ostreopsis Schmidt: Phylogeographical considerations and molecular methodology applications for field detection in the Mediterranean Sea. Cryptogam. Algol. 2012, 33, 153–163. [CrossRef]
6. Battocchi, C.; Totti, C.; Vila, M.; Masó, M.; Capellacci, S.; Accoroni, S.; Reñé, A.; Scardi, M.; Penna, A. Monitoring toxic microalgae Ostreopsis (dinoflagellate) species in coastal waters of the Mediterranean Sea using molecular PCR-based assay combined with light microscopy. Mar. Pollut. Bull. 2010, 60, 1074–1084. [CrossRef] [PubMed]
7. Accoroni, S.; Romagnoli, T.; Pichierri, S.; Totti, C. Effects of the bloom of harmful benthic dinoflagellate Ostreopsis cf. ovata on the microphytobenthos community in the northern Adriatic Sea. Harmful Algae 2016, 55, 179–190. [CrossRef] [PubMed]
8. Mangialajo, L.; Ganzin, N.; Accoroni, S.; Asnaghi, V.; Blanfuné, A.; Cabrini, M.; Cattaneo-Vietti, R.; Chavanon, F.; Chiantore, M.; Cohu, S.; et al. Trends in Ostreopsis proliferation along the Northern Mediterranean coasts. Toxicon 2011, 57, 408–420. [CrossRef] [PubMed]
9. Pistocchi, R.; Pezzolesi, L.; Guidi, F.; Vanucci, S.; Guerrini, F.; Pinna, A. Inorganic nutrients uptake and organic phosphorus utilization by Ostreopsis cf. ovata. In Marine and Freshwater Harmful Algae, Proceedings of the 16th International Conference on Harmful Algae, Wellington, New Zealand, 27–31 October 2014; MacKenzie, A.L., Ed.; Cawthron Institute, International Society for the Study of Harmful Algae (ISSHA): Nelson, New Zealand, 2014; Volume 471, pp. 147–150. ISBN 978-87-990827-5-9.
10. Accoroni, S.; Totti, C.; Razza, E.; Congestri, R.; Campanelli, A.; Marini, M.; Ellwood, N.T.W. Phosphatase activities of a microepiphytic community during a bloom of Ostreopsis cf. ovata in the northern Adriatic Sea. Water Res. 2017, 120, 272–279. [CrossRef] [PubMed]
11. Jauzein, C.; Couet, D.; Blasco, T.; Lemée, R. Uptake of dissolved inorganic and organic nitrogen by the benthic toxic dinoflagellate Ostreopsis cf. ovata. Harmful Algae 2017, 65, 9–18. [CrossRef] [PubMed]
12. Honsell, G.; Bonifacio, A.; De Bortoli, M.; Penna, A.; Battocchi, C.; Ciminiello, P.; Dell’Aversano, C.; Fattorusso, E.; Sosa, S.; Yasumoto, T.; et al. New insights on cytological and metabolic features of Ostreopsis cf. ovata Fukuyo (Dinophyceae): A multidisciplinary approach. PLoS ONE 2013, 8, e5791. [CrossRef] 13. Barone, R. Behavioural trait of Ostreopsis ovata (Dinophyceae) in Mediterranean rock pools: The spider’s
strategy. Harmful Algae News 2007, 33, 1–3.
14. Escalera, L.; Benvenuto, G.; Scalco, E.; Zingone, A.; Montresor, M. Ultrastructural features of the benthic dinoflagellate Ostreopsis cf. ovata (Dinophyceae). Protist 2014, 165, 260–274. [CrossRef] [PubMed]
15. Ciminiello, P.; Dell’Aversano, E.; Fattorusso, E.; Fiorino, M.; Tartaglione, L.; Grillo, C.; Melchiorre, N. Putative palytoxin and its new analogue, ovatoxin-a, in Ostreopsis ovata collected along the Ligurian coasts during the 2006 toxic outbreak. J. Am. Soc. Mass Spetr. 2008, 19, 111–120. [CrossRef] [PubMed]
16. Tubaro, A.; Durando, P.; Del Favero, G.; Ansaldi, F.; Icardi, G.; Deeds, J.R.; Sosa, S. Case definitions for human poisonings postulated to palytoxins exposure. Toxicon 2011, 57, 478–495. [CrossRef] [PubMed]
17. Vila, M.; Abós-Herràndiz, R.; Isern-Fontanet, J.; Àlvarez, J.; Berdalet, E. Establishing the link between Ostreopsis cf. ovata blooms and human health impacts using ecology and epidemiology. Sci. Mar. 2016, 80, 107–115.
18. Gorbi, S.; Avio, G.C.; Benedetti, M.; Totti, C.; Accoroni, S.; Pichierri, S.; Bacchiocchi, S.; Orletti, R.; Graziosi, T.; Regoli, F. Effects of harmful dinoflagellate Ostreopsis cf. ovata exposure on immunological, histological and oxidative responses of mussels Mytilus galloprovincialis. Fish Shellfish Immunol. 2013, 35, 941–950. [PubMed] 19. GEOHAB. Global Ecology and Oceanography of Harmful Algal Blooms. Core Research Project: Harmful Algal Blooms in Benthic Systems; Berdalet, E., Tester, P., Zingone, A., Eds.; IOC: Newark, NY, USA; SCOR: Paris, France, 2012; p. 64.
20. Parsons, M.L.; Aligizaki, K.; Dechraoui Bottein, M.Y.; Fraga, S.; Morton, S.L.; Penna, A.; Rhodes, L. Gambierdiscus and Ostreopsis: Reassessment of the state of knowledge of their taxonomy, geography, ecophysiology, and toxicology. Harmful Algae 2012, 14, 107–129. [CrossRef]
21. Accoroni, S.; Romagnoli, T.; Pichierri, S.; Totti, C. New insights on the life cycle stages of the toxic benthic dinoflagellate Ostreopsis cf. ovata. Harmful Algae 2014, 34, 7–16. [CrossRef]
22. Scalco, E.; Brunet, C.; Marino, F.; Rossi, R.; Soprano, V.; Zingone, A.; Montresor, M. Growth and toxicity responses of Mediterranean Ostreopsis cf. ovata to seasonal irradiance and temperature conditions. Harmful Algae 2012, 17, 25–34.
23. Di Pippo, F.; Bohn, A.; Congestri, R.; De Philippis, R.; Albertano, P. Capsular polysaccharides of cultured phototrophic biofilms. Biofouling 2009, 25, 495–504. [CrossRef] [PubMed]
24. Congestri, R.; Albertano, P. Benthic diatoms in biofilm culture. In The Diatom World, Cellular Origin, Life in Extreme Habitats and Astrobiology; Part 2; Seckbach, J., Kociolek, P., Eds.; Springer Science: Berlin, Germany, 2011; Volume 19, pp. 227–243.
25. Di Pippo, F.; Ellwood, N.T.W.; Guzzon, A.; Bohn, A.; Congestri, R. Diversity and biomass accumulation in cultured phototrophic biofilms. Eur. J. Phycol. 2014, 49, 384–394. [CrossRef]
26. Zippel, B.; Rijstenbil, J.; Neu, T.R. A flow-lane incubator for studying freshwater and marine phototrophic biofilms. J. Microbiol. Meth. 2007, 70, 336–345. [CrossRef] [PubMed]
27. Totti, C.; Accoroni, S.; Cerino, F.; Cucchiari, E.; Romagnoli, T. Ostreopsis ovata bloom along the Conero Riviera (northern Adriatic Sea): Relationships with environmental conditions and substrata. Harmful Algae 2010, 9, 233–239. [CrossRef]
28. Utermöhl, H. Zur Vervollkommnung der quantitativen Phytoplankton-Methodik. Mitt. Int. Ver. Theor. Angew. Limnol. 1958, 9, 1–38.
29. Keller, M.D.; Selvin, R.C.; Claus, W.; Guillard, R.R.L. Media for the culture of oceanic ultraphytoplankton. J. Phycol. 1987, 23, 633–638. [CrossRef]
30. Bellezza, S.; De Philippis, R.; Paradossi, G.; Albertano, P. Exopolysaccharides of two cyanobacterial strains from Roman hypogea. Geomicrobiol. J. 2006, 23, 301–310. [CrossRef]
31. Jeffrey, S.W.; Humphrey, G.F. New spectrophotometric equations for determining chlorophylls a, b, c1 and c2 in higher plants, algae, and natural phytoplankton. Biochem. Physiol. Pflanz. 1975, 167, 191–194. [CrossRef] 32. Bruno, L.; Romano, E.; Bellezza, S.; Urzi’, C.; Albertano, P. Confocal microscopy and diagnosis of
biodeterioration caused by phototrophic biofilms. In Diagnosis for the Conservation and Valorization of Cultural Heritage; Campanella, L., Piccioli, C., Eds.; Museo Leonardiano: Naples, Italy, 2010; pp. 152–157.
33. Barranguet, C.; Van Beuseom, S.A.M.; Veuger, B.; Neu, T.R.; Manders, E.M.M.; Sinke, J.J.; Admiraal, W. Studying undisturbed autotrophic biofilms: Still a technical challenge. Aquat. Microb. Ecol. 2004, 34, 1–9. [CrossRef]
34. Barranguet, C.; Veuger, B.; van Beusekom, S.A.M.; Marvan, P.; Sinke, J.J.; Admiraal, W. Divergent composition of algal-bacterial biofilms developing under various external factors. Eur. J. Phycol. 2005, 40, 1–8. [CrossRef] 35. Dubois, M. Colorimetric method for determination of sugars and related substances. Anal. Chem. 1956, 28,
350–356. [CrossRef]
36. Congestri, R.; Di Pippo, F.; De Philippis, R.; Paradossi, G.; Albertano, P. Seasonal succession of phototrophic biofilms in an Italian wastewater treatment plant: Biovolume, spatial structure and exopolysaccharides. Aquat. Microb. Ecol. 2006, 45, 301–312. [CrossRef]
37. Carnicer, O.; Guallar, C.; Andree, K.B.; Diogène, J.; Fernández-Tejedor, M. Ostreopsis cf. ovata dynamics in the NW Mediterranean Sea in relation to biotic and abiotic factors. Environ. Res. 2015, 143, 89–99. [CrossRef] [PubMed]
Microorganisms 2017, 5, 46 15 of 15
38. Krueger, B.P.; Lampoura, S.S.; van Stokkum, I.H.M.; Papagiannakis, E.; Salverda, J.M.; Gradinaru, C.C.; Rutkauskas, D.; Hiller, R.G.; van Grondelle, R. Energy Transfer in the Peridinin Chlorophyll-a Protein of Amphidinium carterae studied by Polarized Transient Absorption and Target Analysis. Biophys. J. 2001, 80, 2843–2855. [CrossRef]
39. Lamastra, F.R.; De Angelis, R.; Antonucci, A.; Salvatori, D.; Prosposito, P.; Casalboni, M.; Congestri, R.; Melino, S.; Nanni, F. Polymer composite random lasers based on diatom frustules as scatterers. RSC Adv. 2014, 4, 61809–61816. [CrossRef]
40. De Angelis, R.; Melino, S.; Prosposito, P.; Casalboni, M.; Lamastra, F.R.; Nanni, F.; Bruno, L.; Congestri, R. The diatom Staurosirella pinnata for photoactive material production. PLoS ONE 2016, 11, e0165571. [CrossRef] [PubMed]
41. Mandal, S.K.; Singh, R.P.; Patel, V. Isolation and Characterization of Exopolysaccharide Secreted by a Toxic Dinoflagellate, Amphidinium carterae Hulburt 1957 and Its Probable Role in Harmful Algal Blooms (HABs). Microb. Ecol. 2011, 62, 518–527. [CrossRef] [PubMed]
© 2017 by the authors. Licensee MDPI, Basel, Switzerland. This article is an open access article distributed under the terms and conditions of the Creative Commons Attribution (CC BY) license (http://creativecommons.org/licenses/by/4.0/).