Original Article
Taste Intensity and Hedonic Responses
to Simple Beverages in Gastrointestinal
Cancer Patients
Maurizio Bossola, MD, Gabriella Cadoni, MD, Rocco Bellantone, MD, Concetta Carriero, MD, Elena Carriero, MD, Fabrizio Ottaviani, MD, Domenico Borzomati, MD, Antonio Tortorelli, MD, and
Giovan Battista Doglietto, MD
Departments of Surgical Sciences (M.B., R.B., C.C., D.B., A.T., G.B.D.) and Otorhinolaryngology (G.C., E.C., F.O.), Catholic University of the Sacred Heart, Rome, Italy
Abstract
Changes in the taste of food have been implicated as a potential cause of reduced dietary intake among cancer patients. However, data on intensity and hedonic responses to the four basic tastes in cancer are scanty and contradictory. The present study aimed at evaluating taste intensity and hedonic responses to simple beverages in 47 anorectic patients affected by gastrointestinal cancer and in 55 healthy subjects. Five suprathreshold concentrations of each of the four test substances (sucrose in black current drinks, citric acid in lemonade, NaCl in unsalted tomato juice, and urea in tonic water) were used. Patients were invited to express a judgment of intensity and pleasantness ranging from 0 to 10. Mean intensity scores directly correlated with concentrations of sour, salty, bitter, and sweet stimuli, in both normals and those with cancer. Intensity judgments were higher in cancer patients with respect to sweet (for median and high concentrations, P < 0.05), salty (for all concentrations, P < 0.05), and bitter tastes (for median concentration, P < 0.01). Hedonic function increased with the increase of the stimuli only for the sweet taste. A negative linear correlation was found between sour, bitter, and salty concentrations and hedonic score. Both in cancer patients and in healthy subjects, hedonic judgments increased with the increase of the stimulus for the sweet taste (r¼ 0.978 and r ¼ 0.985, P ¼ 0.004 and P ¼ 0.002, respectively), and decreased for the salty (r¼ "0.827 and r ¼ "0.884, P ¼ 0.084 and P ¼ 0.047, respectively) and bitter tastes (r ¼ "0.990 and r ¼ "0.962, P ¼ 0.009 and P ¼ 0.001, respectively). For the sour taste, the hedonic scores remained stable with the increase of the stimulus in noncancer controls (r¼ "0.785, P ¼ 0.115) and decreased in cancer patients (r¼ "0.996, P ¼ 0.0001). The hedonic scores for the sweet taste and the bitter taste were similar in cancer patients and healthy subjects, and these scores were significantly higher in cancer patients than in healthy subjects for most of the concentrations of the salty taste and all the concentrations of the sour taste. The present study suggests that cancer patients, compared to healthy individuals, have a normal sensitivity, a normal liking
Address reprint requests to: Maurizio Bossola, MD, Isti-tuto Clinica Chirurgica, Universita` Cattolica Sacro Cuore, Largo A. Gemelli 8, 00168 Rome, Italy. E-mail:[email protected]
Accepted for publication: December 22, 2006.
! 2007 U.S. Cancer Pain Relief Committee Published by Elsevier Inc. All rights reserved.
0885-3924/07/$esee front matter doi:10.1016/j.jpainsymman.2006.12.013
for pleasant stimuli, and a decreased dislike for unpleasant stimuli. Moreover, when compared to controls, they show higher hedonic scores for middle and high concentrations of the salty taste and for all concentrations of the sour taste. Further studies are needed to evaluate whether these changes observed in cancer patients translate into any alteration in dietary behavior and/or food preferences. J Pain Symptom Manage 2007;34:505e512. ! 2007 U.S. Cancer Pain Relief Committee. Published by Elsevier Inc. All rights reserved. Key Words
Taste, cancer, anorexia, hedonic, intensity
Introduction
A decline in food intake is common among cancer patients and may be secondary to mul-tiple causes.1,2Among these, changes in taste and smell have been implicated.3,4 The fre-quency of taste alterations in patients with can-cer is not known, probably because these kinds of alterations are rarely investigated and hardly ever reported spontaneously by the patients.3 Data on detection and recognition of thresh-old and suprathreshthresh-old intensity responses to the four basic tastes are controversial.5e15
Moreover, almost all studies in cancer patients have focused on taste acuity and sensitivity rather than on hedonic judgments.5e15 He-donic judgments are a measure of acceptability or pleasantness of a given stimulus.16e18
Disparities in the choice and stratification of patient populations and the use of different taste test methodologies contribute to the in-consistencies among these results. Most of the studies included patients with different dis-eases, who were receiving different treatments. Moreover, the inclusion of suitable control groups often has not been considered.6e15
The present study aimed to evaluate supra-threshold taste intensity and hedonic re-sponses using simple beverage systems and whole mouth stimulation in a more or less ho-mogeneous group of anorectic gastrointestinal cancer patients and comparing the results with those of nonanorectic healthy subjects.
Methods
Subjects
Patients affected by gastrointestinal malig-nant tumors admitted to the Istituto di Clinica Chirurgica of the Universita` Cattolica del Sac-ro Cuore of Rome between June and
December 2005 who were candidates for sur-gery were considered eligible. Inclusion crite-ria were: expected survival of more than six months, performance status of grade 3 or bet-ter on the Easbet-tern Cooperative Oncology Group (ECOG) scale, weight loss >5%, and presence of anorexia. Exclusion criteria were: evidence of distant metastases, age over 70 years, anorexia nervosa, AIDS, sepsis, endocrine or neurologic disorders known to alter taste or smell sensitivity, renal failure (se-rum creatinine > 1.5 mg/dl), jaundice (biliru-bin > 1.5 mg/dl), alcoholism, inflammatory bowel diseases, pregnancy, assumption of drugs known to alter taste, and chemotherapy and/or radiotherapy within four months be-fore the study. Healthy subjects matched for body, age, sex, weight, and smoking habits con-stituted the control group.
Current weight and weight before illness (usual body weight) were registered. Anorexia, defined as the loss of the desire to eat, was assessed by means of a questionnaire, exten-sively validated in cancer patients,17in which the presence of major symptoms, namely meat aversion, taste and smell alterations, nausea and/or vomiting, and early satiety were investigated. All these symptoms inter-fere with eating and are likely related to a de-ranged central nervous system regulation of feeding behavior. Patients reporting one or more of the major symptoms were considered anorectic.
Before threshold and hedonic determina-tion, all patients and control subjects had a thorough clinical examination of ears, nose, and throat to disclose any pathologic conditions that could affect taste. No patient was tested while having fever or anemia.
The study was approved by the local ethics committee, and written informed consent was
obtained from all patients before enrollment in the study.
Materials
Five suprathreshold concentrations of each of the four taste substances were dissolved in appropriate beverages: sucrose in a black cur-rant drink (Germinal Italia, Cellatica-BS, Italy); citric acid in lemonade (Vismara, Seg-rate-MI, Italy); NaCl in unsalted tomato juice (Germinal Italia, Cellatica-BS, Italy); and urea in tonic water solvent (Schweppes Italia, Scorze-VE, Italy).
Concentrations were prepared as follows, according to Trant’s modified method:16
1) Sweet taste: Solution ‘‘A’’ (1.0 M) was pre-pared by dissolving 340 g of sucrose in 1.0 L of Solution ‘‘B’’ (which represents the commercially available product diluted 1:1 in water);
2) Sour taste: Solution ‘‘A’’ (0.1 M) was pre-pared by dissolving 21 g of citric acid in 1.0 L of Solution ‘‘B’’ (which represents the commercially available product di-luted 1:1 in water) and adding 85 mg of sucrose per liter (0.25 M);
3) Bitter taste: Solution ‘‘A’’ (4.0 M) was pre-pared by dissolving 248 g of urea in 1.0 L of Solution ‘‘B’’ (which represents the commercially available tonic water); and 4) Salty taste: Solution ‘‘A’’ (0.1 M) was
pre-pared by dissolving 57.7 g of NaCl in 1.0 L of Solution ‘‘B’’ (which represents the commercially available product diluted 1:1 in water).
The concentrations of solutions, made by se-rial half dilution, were identified by a progres-sive number, with 1 being the lowest.
These beverages were chosen because they taste similar to the additive, and they contain a known amount of the tastant itself (approxi-mately 0.14 M sodium in salted tomato juice, 0.33 M citric acid in lemonade, and 0.33 M su-crose in cherry drink, according to manufac-turer’s specifications), giving the subject a familiar framework upon which to base he-donic judgments. The five concentrations of each taste were chosen because, according to the literature, they were easily discerned by normal subjects.16 Solutions were prepared the day before the test and stored at 4#C to
5#C in glass containers. Before testing, 10 ml
samples of each solution were brought to room temperature (24#C $ 2#C) in 30 ml
plas-tic medicine cups. The order of presentation of the five concentrations was randomized among each of the four replicate sets. The taste samples, 1 L of distilled water for rinsing, and a container for expectorating were placed on a mobile cart to allow tasting at the patient’s bedside or in the clinic.
Taste Evaluations
Intensity and hedonic judgments were per-formed separately on two different days. All sessions were scheduled at the same time of the day, at least two hours after eating or smok-ing and under constant temperature and hu-midity conditions. Dentures were removed, and the mouth was rinsed with a sip of distilled water before tasting each of the 10 ml samples from a plastic cup. All samples and rinse water were spit before making judgments.
The presentation order of five dilutions was randomized within each of the four sets. The washout period between the test of each taste was 15 minutes. During the first session, differ-ent tastes were administered, chosen at ran-dom, and the subject was invited to express a judgment of intensity ranging from 0 (no sweetness, sourness, saltiness, or bitterness) to 10 (extremely sweet, sour, salty, or bitter) of each sample, placing a crosshatch on a 10 cm line labeled at each end. During the second session, different tastes were adminis-tered, and the subject was invited to express a hedonic judgment ranging from 0 (dislike extremely) to 10 (like extremely) to indicate degree of liking of each sample, placing a cross-hatch on a 10 cm line labeled at each end. The first of the four replications of each tastant se-ries was used to orient the subject to the score sheet and the range of concentrations. These scores were discarded.
The response ‘‘absence of sensation’’ and ‘‘I don’t know’’ were accepted. The repetition of the presentation was also allowed, provided the examiner considered the error as casual; in such cases, a positive response substituted for a previous negative one, in order to avoid cognitive errors.
Data Analysis
Scores were recorded as distance in centi-meters from the left end mark on the 10 cm
scale. All analyses were performed with the CRISP package. Hedonic and intensity data were expressed as mean $ SD. The correlation between the intensity and liking degree and the intensities of stimulation for the four main tastes were evaluated by linear regres-sion analysis. Student’s t-test was used to eval-uate the difference of intensity and hedonic judgments at every concentration and for the same taste between control and cancer patients.
Results
One hundred-two subjects were included in the study. Forty-seven subjects constituted the cancer group, and 55 the control group. Their characteristics are shown in Table 1. Groups were comparable in terms of age, sex, and smoking habits. Cancer patients had a mean body weight loss of 9.9 $ 1.8% with respect to the usual weight.
Intensity Scores
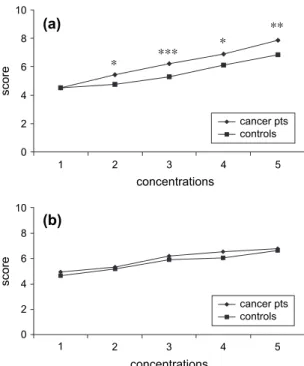
Mean intensity scores of healthy controls and cancer patients increased directly with concen-tration of added stimuli (Figs. 1ae4a) for the sweet (r2¼ 0.983, P ¼ 0.0001 and r2¼ 0.988, P¼ 0.0001, respectively), the salty (r2¼ 0.998, P¼ 0.0001 and r2¼ 0.996, P ¼ 0.0001, respec-tively), the sour (r2
¼ 0.997, P ¼ 0.0001 and r2¼ 0.979, P ¼ 0.0001, respectively), and the bit-ter tastes (r2¼ 0.921, P ¼ 0.026 and r2¼ 0.979, P¼ 0.0004, respectively). The extremely high coefficients of determination (r2) for these
correlations signify that cancer patients, similar to healthy individuals, were able to distinguish easily among the five concentrations of each additive.
Table 1
Patients’ Characteristics Cancer Patients
(n ¼ 47) Controls(n ¼ 55) Age (y), mean $ SE 65.3 $ 9.7 64.8 $ 10.6
Male/female 25/22 29/26 Smokers/nonsmokers 0/47 0/55 Weight loss (%), mean $ SE 9.9 $ 1.8 1.3 $ 0.5 Anorexia 47 (100%) 0 (0%) Serum albumin (g/L) 3.4 $ 0.2 4.3 $ 0.3 Tumor site Stomach 25 (53%) d Ampullary region 10 (21.2%) d Colon-rectum 12 (25.5%) d Chemotherapy in last 6 mo 0 0 Radiotherapy in last 6 mo 0 0 Surgery in last 6 mo 0 0 0 2 4 6 8 10 (a) 1 2 3 4 5 concentrations 1 2 3 4 5 concentrations score 0 2 4 6 8 10 (b) score * *** * ** cancer pts controls cancer pts controls
Fig. 1. (a) Sweet taste: intensity scores. *P < 0.05, **P < 0.01, ***P < 0.005; (b) sweet taste: hedonic scores. 0 2 4 6 8 10 1 2 3 4 5 concentrations 1 2 3 4 5 concentrations score 0 2 4 6 8 10 score cancer pts controls *** * * ** *** cancer pts controls (a) (b)
Fig. 2. (a) Salty taste: intensity scores. *P < 0.05, ***P < 0.005; (b) salty taste: hedonic scores. *P < 0.05, **P < 0.01, ***P < 0.005.
Moreover, we observed that:
e Mean intensity scores for the middle and highest concentrations of the sweet taste were significantly higher in cancer pa-tients than in healthy subjects (Fig. 1a);
e Mean intensity scores for the salty taste were similar in cancer patients and healthy subjects, except for the lowest concentration (Fig. 2a);
e Mean intensity scores for the sour taste were similar in cancer patients and healthy subjects (Fig. 3a); and
e Mean intensity scores for the middle con-centrations of the bitter taste were signifi-cantly higher in cancer patients than in healthy subjects (Fig. 4a).
Hedonic Scores
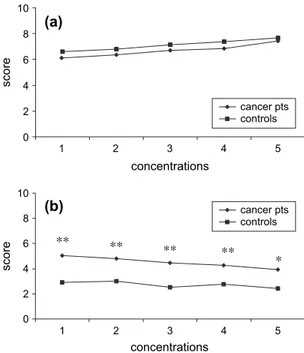
Both in cancer patients and in healthy sub-jects, hedonic judgments increased with the increase of the stimulus for the sweet taste (Fig. 1a), while decreasing for the salty (Fig. 2b) and bitter (Fig. 4b) tastes. For the sour taste, the hedonic scores remained stable with the increase of the stimulus in controls (r ¼ "0.785, P ¼ 0.115), while decreasing in cancer patients (r ¼ "0.996, P¼ 0.0001) (Fig. 3b). Moreover, the study demonstrated that:
e The hedonic scores for the sweet taste and the bitter taste were similar in cancer patients and healthy subjects (Fig. 1b and
Fig. 4b);
e The hedonic scores for all the concentra-tions of the salty taste (with the exception of the concentration number 2) were sig-nificantly higher in cancer patients than in healthy subjects (Fig. 2b); and
e The hedonic scores for all the concentra-tions of the sour taste were significantly higher in cancer patients than in healthy subjects (Fig. 3b).
Discussion
In the present study, mean intensity scores directly correlated with concentrations of sour, salty, bitter, and sweet stimuli, both in cancer patients and in controls. These data suggest that cancer patients, similar to healthy individuals, were able to distinguish easily among the five concentrations of each additive in the beverages and that their taste sensitivity was not reduced. Interestingly, the sweet inten-sity function increased more consistently with high concentrations of added taste stimuli.
0 2 4 6 8 10 1 2 3 4 5 concentrations 1 2 3 4 5 concentrations score 0 2 4 6 8 10 score ** ** ** ** * cancer pts controls cancer pts controls (a) (b)
Fig. 3. (a) Sour taste: intensity scores; (b) sour taste: hedonic scores. *P < 0.005; **P < 0.001.
0 2 4 6 8 10 1 2 3 4 5 concentrations 1 2 3 4 5 concentrations score 0 2 4 6 8 10 score cancer pts controls * ** cancer pts controls (a) (b)
Fig. 4. (a) Bitter taste: intensity scores. *P < 0.05; **P < 0.001; (b) bitter taste: hedonic scores.
Similar results have been reported by Trant et al. in a heterogeneous group of cancer patients.16
The intensity scores for the lower concentra-tions of the salty taste and for the low-interme-diate concentrations of the bitter taste were higher in cancer patients than in controls. A lower bitter detection threshold has been re-ported by Pattison et al. in a heterogeneous group of patients with advanced cancer with-out being associated with a reduced dietary intake.17In the general population, detection thresholds for bitter taste are extremely low.18e20 Bitter compounds, including ex-tremely toxic bitter poisons, are detected by humans in micromolar amounts. Sensitivity to bitter taste is a heritable trait.21 Crystals and solutions of phenylthiocarbonate and 6-n-propylthiouracil (PROP) that taste bitter to some people are tasteless to others. It was re-cently demonstrated on the basis of thresholds and intensity ratings of PROP solutions relative to NaCl solutions that people can be distin-guished as nontasters, regular tasters, and supertasters.
The hedonic scores for sweet taste, both in cancer patients and in controls, increased with the increase of the concentration. Our data are in perfect agreement with those of the study of Trant et al.,16in which the distri-bution of hedonic responses relative to increasing sucrose concentrations for patients categorized according to therapy and appetite indicated that patients on chemotherapy ex-hibited a greater percentage of flat functions whereas those not on chemotherapy a greater percentage of direct functions. A flat response for sweet stimuli was indicative of no distinct preference for any of the five concentrations of sucrose in cherry drink. Inversely, other au-thors have observed that anorectic cancer pa-tients as a group were more likely to prefer lower sweetness levels than nonanorectics.11,16 In the general population, in lean and obese subjects, hedonic response profiles for sweet taste are highly diverse, ranging from a mono-tonic rise, to an inverse U shape, to a sharp decline with increasing sweetness.22e24 This extreme high range of results is probably due to the difference in the population of healthy subjects and patients included in the studies.
In the past, on the bases of some of these results, some authors have suggested that
increasing the number of mildly or highly sweet food items might improve the palatabil-ity of diet of anorectic cancer patients.11,16 In-deed, it is generally assumed that taste preferences predict food preferences. This is not necessarily true.11In fact, it is well known that preferences for sweet solutions in the gen-eral population do not necessarily predict self-reported liking for, or the likely consumption of, sweet foods.25e30 If this occurs in cancer
patients remains to be defined.
Hedonic scores decreased with the increase of the stimulus for the salty taste both in healthy controls and in cancer patients. Inter-estingly, hedonic scores of cancer patients were higher than those in healthy individuals at the middle and high concentrations. It seems that cancer subjects have a higher sense of pleasantness when a very salty beverage is administered. It remains to be defined if liking a higher concentration of the salty taste trans-lates to a higher preferred frequency of con-sumption of foods with such a taste. In healthy individuals, preferences for salty solu-tions do not necessarily predict liking or likely consumption of salty foods.27e30
With the increase of the stimuli, the hedonic scores for the sour taste decreased in cancer pa-tients whereas it remained stable in controls. However, hedonic judgments for sour taste were significantly higher in cancer patients than in healthy individuals at all concentra-tions, with highest scores observed at low con-centrations. These data would suggest that cancer patients do not dislike sour tastes as healthy individuals do, and have the highest pleasantness at low concentrations. Similar to the sweet and salty tastes, if this translates to a higher preferred consumption of foods with such taste characteristics remains to be defined. With regard to the bitter taste, hedonic scores were similar in cancer patients and healthy individuals. Both normal subjects and cancer patients preferred lower concentrations of bitter taste, the pleasantness decreasing with the increase of the stimulus. These results are similar to those described as typical functions for normal European and North American populations28e30 and with those reported in a heterogeneous group of cancer patients.16
Several factors are responsible for the loss of appetite in cancer,1,2and among these,
well known that taste can affect food prefer-ence in healthy animals and humans.4,5Taste alterations comprise a reduction in taste sensi-tivity (hypogeusia), an absence of taste sensa-tion (ageusia), or a distorsensa-tion of normal taste (dysgeusia).3e7
Chemical gustometry has frequently been used to test taste threshold in patients with different cancer diseases, with contradictory results.8e17,31e33 Thus, the question persists
whether and how taste abnormalities exist in cancer patients.
Henkin’s drop method has been extensively criticized.16,35 Taste threshold measured by this method has been shown to change in the desired direction after administration of a placebo.16 Use of forced-choice methods eliminates some response biases, but the time required for these procedures reduces their desirability as a chemical test.35Studies using these techniques have given inconsistent re-sults due to the inclusion of patients with dif-ferent types and stages of cancer, difdif-ferent antineoplastic therapies, and poorly matched controls.31e33 Moreover, using the
forced-choice three-stimulus drop technique, the threshold will vary depending on the volume and the location of the drop applied.
Model systems of pure taste chemicals in dis-tilled water also have been used, but the ex-trapolation of the results obtained from a single aqueous medium to complex food has been showed to be tenuous.34,35 In 1982, Trant et al.16proposed to characterize supra-threshold taste intensity and hedonic re-sponses using real food systems and whole mouth stimulation. Comparing anorectic and nonanorectic cancer patients, they concluded that no abnormalities of taste perception were observed, while hedonic functions dif-fered among individuals and groups. However, a control group of noncancer patients was lacking, and patients who had chemotherapy within the month before testing were in-cluded. Therefore, using the above-mentioned method, we tried to compare a group of ano-rectic cancer patients (gastrointestinal tumors) without evidence of distant metastases and without treatments such as chemotherapy or radiotherapy with a well-matched group of nonanorectic healthy subjects.
We are aware that some investigators have ar-gued that, in fact, there are more than four
types of taste (e.g., umami and taste for free fatty acids). Umami applies to the sensation of savoriness, specifically to the detection of glutamates that are especially common in meats, cheese, and other protein-heavy foods. New evidence is emerging that supports the in-clusion of a sixth taste category for free fatty acids, the chemical components of dietary fat. However, during the design of the study, we realized that it was not easy to create simple beverages for umami and free fatty acids. Hopefully, further studies including these two tastes will be conducted in the near future.
In conclusion, the present study suggests that cancer patients, compared to healthy indi-viduals, have a normal taste sensitivity, a normal liking for pleasant stimuli, and a decreased dis-like for unpleasant stimuli. Moreover, when compared to controls, they show higher hedonic scores for middle and high tions of the salty taste and for all concentra-tions of the sour taste. Further studies are needed to evaluate whether these changes observed in cancer patients translate into any alteration in dietary behavior and/or food preferences.
References
1. Muscaritoli M, Bossola M, Aversa Z, et al. Prevention and treatment of cancer cachexia: new insights into an old problem. Eur J Cancer 2006; 42:31e41.
2. Muscaritoli M, Bossola M, Bellantone R, Rossi Fanelli F. Therapy of muscle wasting in cancer: what is the future? Curr Opin Clin Nutr Metab Care 2004;7:459e466.
3. Ripamonti C, Fulfaro F. Taste alterations in can-cer patients. J Pain Symptom Manage 1998;16: 349e351.
4. Ravasco P. Aspects of taste and compliance in patients with cancer. Eur J Oncol Nurs 2005;9(Suppl 2):S84eS91.
5. Groavenor M, Bulcavage L, Chlebowski R. Symptoms potentially influencing weight loss in a cancer population. Cancer 1989;63:330e334.
6. Abasov IT. Changes in gustatory sensitivity of cancer patients. Sovetaska Meditsina 1961;25: 47e52.
7. De Wys WD, Walters K. Abnormalities of taste sensation in cancer patients. Cancer 1975;36: 188e196.
8. Carson JS, Gormian A. Taste activity and food at-titudes of selected patients with cancer. J Am Diet Assoc 1987;70:361e365.
9. Mossman RL, Henkin RI. Radiation induced changes in taste acuity in cancer patients. Int J Radi-at Oncol Biol Phys 1978;4:663e670.
10. Thompson DA, Campbell RG, Bennett JM. Report to the Nationals Institute of Health, Bethes-da, MD. Meeting on gustatory evaluation in cancer patients. August 4, 1978 (Contract N01-CP-66833). 11. Settle RG, Quinn MR, Rase MR. Report to the National Institutes of Health, Bethesda, MD. Meet-ing on gustatory evaluation in cancer patients. August 4, 1978 (Contract N01-CP-65791).
12. Oversen L, Sorensen M, Hannibal J, Allingstrup L. Electrical bite detection threshold and chemical smell detection threshold in patients with cancer. Cancer 1991;58:2260e2265.
13. Ovesen L, Hannibal J, Sorensen M. Taste thresholds in patients with small-cell lung cancer. J Cancer Res Clin Oncol 1991;117:70e72.
14. Williams LR, Coheno MA. Altered threshold in lung cancer. Am J Clin Nutr 1978;31:122e125. 15. Brown RO, Schlegel K, Hall N, Bernard S, Heizer W. Taste preference for multifactorial sup-plements: comparison of cancer patients and healthy controls using a unic taste scale. JPEN J Parenter Enteral Nutr 1986;10:490e493.
16. Trant A, Serin J, Douglass A. Is taste related to anorexia in cancer patients? Am J Clin Nutr 1982; 36:45e58.
17. Pattison RA, Richardson H, Dougan H, Davidson HIM. Impact of altered taste sensitivity on dietary intake of patients with advanced cancer. Proc Nutr Soc 1997;56:314A.
18. Glendenning JI. Is the bitter rejection response always adaptive? Physiol Behav 1994;56:1217e1227. 19. Hladik CM, Simmen B. Taste perception and feeding behavior in nonhuman primates and hu-man populations. Evol Anthropol 1996;5:58e71. 20. McBurney DH. Psychological dimensions and perceptual analyses of taste. In: Carterette EC, Friedman MP, eds, Handbook of perception: tasting and smelling, Vol. 6A. New York: Academic Press, 1978.
21. Kalmus H. Genetics of taste. In: Beidler LM, ed. Chemical senses, Handbook of sensory physiology, Vol. IV. Berlin: Springer, 1971: 165e179.
22. Drewnowski A. Sweetness and obesity. In: Dobbing J, ed. Sweetness. Berlin: Springer-Verlag, 1987: 177e192.
23. Thompson DA, Moskowitz HR, Campbell R. Ef-fects of body weight and food intake on pleasant-ness ratings for sweet stimulus. J Appl Psycol 1976; 41:77e83.
24. Witherly SA, Pangborn RM, Stern JS. Gustatory responses and eating duration of obese and lean adults. Appetite 1980;1:52e63.
25. Lucas F, Bellisle F. The measurement of food preference in humans: do taste and spit tests predict consumption? Physiol Behav 1987;39:739e743. 26. Mattes RD. Gustation as a determinant of inges-tion: methodological issues. Am J Clin Nutr 1985;41: 672e683.
27. Frank RA, van der Klaauw NJ. The contribution of chemosensosry factors to individual differences in reported food preferences. Appettite 1994;22: 101e123.
28. Pangborn RM. Individual variation in affective response to taste stimuli. Psychonomic Sci 1970;21: 125e126.
29. Moskowitz HR. Taste and food technology: acceptability, aesthetics and preferences. In: Corterette EC, Friedman MP, eds. Handbook of per-ception. New York: Academic Press, 1978: 157e194. 30. Kocher EC, Fisher GL. Subjective intensity and taste preference. Percept Motor Skills 1969;28: 735e740.
31. Ekmann G, Akesson C. Saltness, sweetness and preference: a study of quantitative relations in indi-vidual subjects. Report of Physics Lab, no. 177. Stockholm: University of Stockholm, 1964.
32. Camath S, Booth P, Lad T, Kolves MB, Mc Guire VG. Taste threshold of patients with cancer of esophagus. Cancer 1983;52(2):386e389. 33. Hall JC, Staniland JR, Giles GR. Altered taste thresholds in gastrointestinal cancer. Clin Oncol 1980;6(2):137e142.
34. Gallagher P, Tueedle D. Taste threshold accept-ability of commercial diets in cancer patients. JPEN J Parenter Enteral Nutr 1983;7:361e363.
35. Mackey AO, Johns P. Selection of members of a food tasting panel: discernment of primary tastes in water solutions compared with judging ability for foods. Food Technol 1954;8:527e530.