ALMA MATER STUDIORUM - UNIVERSITÀ DI BOLOGNA
FACOLTA’ DI INGEGNERIA
CORSO DI LAUREA IN INGEGNERIA MECCANICA DIPARTIMENTO
DIEM-MACCHINE
TESI DI LAUREA
In
Protocolli di gestione dei motori a combustione interna LS
DESIGN OF ALTERNATIVE ENERGY STORAGE SYSTEMS FOR HYBRID VEHICLES BASED ON STATISTICAL PROCESSING OF
DRIVING CYCLES INFORMATION
CANDIDATO: RELATORE:
Bolletta Alberto Chiar.mo Prof. Cavina Nicolò
CORRELATORI: Chiar.mo Prof. Rizzoni Giorgio Chiar.mo Prof. Canova Marcello Ill.mo Dott. Ing. Chiara Fabio
Anno Accademico 2009/2010 Sessione III
2
Acknowledgments
This thesis was elaborated and developed while I was visiting scholar at the Center of Automotive Research (CAR) of The Ohio State University. I wish to thank the director of this center of research, Prof. Giorgio Rizzoni. He gave me the great opportunity to spend almost eight months in this center where he formed a fantastic team that he leads with his wide knowledge and managerial capability.
I want to thank my two advisors at CAR, Dott. Fabio Chiara and Prof. Marcello Canova. They gave me a fundamental help during the entire working experience. For me it has been a pleasure working with them.
I want to thank my advisor in Bologna, Prof. Cavina, who taught the two most interesting classes during my academic career, and who gave me the opportunity to work on my thesis at CAR.
A special thank to my friends met during this wonderful experience. They made me enjoy every day of stay and they became a kind of family. I met wonderful funny people and each one brought something extraordinary into this experience. I hope I will have the chance to meet them again. I hope that both the distance and time will not ruin our friendships.
Another special thank to friends that have characterized my life in Bologna until now. Each of them has participated to an episode of my life, adding brilliant memories to my existence. They are a large and important part of life.
The most important thank to my family. Their never ending love, support and encouragement have been essential during my life and academic career.
4
Summary
Acknowledgments ... 2
Abstract ... 8
1. Introduction ... 10
1.1 Hybrid Electric Vehicles ... 11
a) Series Hybrid Electric Vehicle... 12
b) Parallel Hybrid Electric Vehicle ... 13
c) Power-split Hybrid Electric Vehicle ... 13
1.2 Non-electric Hybrid Vehicles ... 14
1.2.1 Energy Storage Systems for HV ... 14
1.2.2 Short-term Energy Storage System ... 15
2. Literature Review ... 18
2.1 Energy Storage System Design Methodologies ... 18
2.2 Driving Cycles Analysis Methodologies ... 23
2.2.1 Principle of Machine Components Design ... 31
2.3 Overview of Modeling Approach for ESS ... 33
2.3.2. Operation of Short-term ESS ... 37
2.3.3. Hydraulic ESS Literature Review ... 39
2.4 Introduction to the Work ... 41
3. Driving Cycle Analysis Methodology ... 43
3.1 Development of a Driving Cycles Analysis Tool ... 45
3.1.1. Driving Cycles ... 45
a) Regulatory Cycles ... 45
b) Real-world Driving Cycles ... 46
3.1.2. Driving Cycles Analysis ... 48
5
3.1.2.2. Creation of Event ID ... 54
3.1.2.3. Events Clustering Process ... 56
3.1.2.4. Braking Events Analysis ... 57
3.1.2.5. Traction Events Analysis ... 60
3.1.2.6. Coasting Phase ... 62
3.1.2.7. Synthetic Cycle Statistically Relevant Events ... 64
3.2 Vehicle Mass Sensitivity Study ... 67
3.2.1. Vehicle Mass Sensitivity Study on US06 Driving Cycle ... 67
3.2.1.1 First Case Analysis ... 69
3.2.1.2 Second Case Analysis ... 86
3.2.1.3 Analysis of “Real-world” Driving Cycles ... 100
3.3 Representative Cycles Analysis ... 112
3.3.1. User I ... 112
3.3.2. User II ... 113
3.3.3. User III ... 114
4. Design Procedure for Alternative Energy Storage Systems ... 117
4.1 Definition of Design Inputs for the AESS ... 118
4.2 Definition of the Design Targets of the AESS ... 119
4.2.1. From Design Inputs to Design Targets ... 119
4.3 Definition of Design Constraints for the AES Systems ... 120
4.4 Determination of the Relationships between Design Targets and Design Parameters of the AESS ... 121
4.5 Definition of the attributes of the selected design solution ... 123
a) Pump Mass and Volume ... 124
b) Accumulator Mass and Volume ... 124
c) Fluid and Reservoir Mass and Volume... 126
6
5. Results ... 128
5.1 Definition of Real-world Driving Cycle for System Sizing ... 128
5.1 Application of the Design Procedure ... 129
5.2.1. Hydraulic Energy Storage System Design ... 135
5.3 Definition of Real-world Driving Cycles for Design Validation ... 138
5.3.1. Cycle-A... 138
5.3.2. Cycle-B ... 142
5.4 Definition of Simulation Methodology ... 145
5.4.1. Methodology to Determine Testing Events ... 145
5.4.2. Methodology to Simulate the Short-Term ESS Use... 148
5.4.3. Simulation Model ... 150
5.4.4. Definition of AESS Efficiency ... 151
5.5 Evaluation of Energy Storage System Performances by Simulation ... 152
5.5.1. Sizing Results ... 152
5.5.2. Simulation Results ... 155
5.5.3. Comparison of Designs Efficiency over the Tested Cycles ... 181
6. Conclusions ... 185
8
Abstract
Hybrid vehicles represent the future for automakers, since they allow to improve the fuel economy and to reduce the pollutant emissions. A key component of the hybrid powertrain is the Energy Storage System, that determines the ability of the vehicle to store and reuse energy. Though electrified Energy Storage Systems (ESS), based on batteries and ultracapacitors, are a proven technology, Alternative Energy Storage Systems (AESS), based on mechanical, hydraulic and pneumatic devices, are gaining interest because they give the possibility of realizing low-cost mild-hybrid vehicles. Currently, most literature of design methodologies focuses on electric ESS, which are not suitable for AESS design. In this contest, The Ohio State University has developed an Alternative Energy Storage System design methodology.
This work focuses on the development of driving cycle analysis methodology that is a key component of Alternative Energy Storage System design procedure. The proposed methodology is based on a statistical approach to analyzing driving schedules that represent the vehicle typical use. Driving data are broken up into power events sequence, namely traction and braking events, and for each of them, energy-related and dynamic metrics are calculated. By means of a clustering process and statistical synthesis methods, statistically-relevant metrics are determined. These metrics define cycle representative braking events. By using these events as inputs for the Alternative Energy Storage System design methodology, different system designs are obtained. Each of them is characterized by attributes, namely system volume and weight. In the last part the work, the designs are evaluated in simulation by introducing and calculating a metric related to the energy conversion efficiency. Finally, the designs are compared accounting for attributes and efficiency values. In order to automate the driving data extraction and synthesis process, a specific script Matlab based has been developed.
Results show that the driving cycle analysis methodology, based on the statistical approach, allows to extract and synthesize cycle representative data. The designs based on cycle statistically-relevant metrics are properly sized and have satisfying efficiency values with respect to the expectations. An exception is the design based on the cycle worst-case scenario, corresponding to same approach adopted by the conventional electric ESS design methodologies. In this case, a heavy system with poor efficiency is produced. The proposed new methodology seems to be a valid and consistent support for Alternative Energy Storage System design.
10
1. Introduction
The development of vehicles that have greater fuel efficiency and produce lower emissions has become a priority for the automotive industry due to government demands as well as the recent energy crisis. In principle, Battery Electric Vehicles (BEVs) are considered by many as the solution of choice for personal mobility with reduced environmental impact. However, despite of the continuous technological research, the energy storage density of electric batteries remains very low, compared with that of hydrocarbon fuels [1].
For this reason, the use of BEVs is today limited to applications characterized by short driving distance and allowing for long recharging times, such as delivery trucks.
In the last decades, the automakers have introduced to the market several hybrid electric vehicles, which have the potential of utilizing two distinct energy sources to provide motion to the vehicle. A hybrid vehicle is based on a complex drivetrain that accommodates a primary energy converter (generally, an internal combustion engine) and a secondary energy converter and storage system, such as a combination of electric motors and batteries. These additional components enable different engineering solutions that contribute in decreasing considerably the vehicle energy consumption and, consequently, CO2 emissions.
In general, two main categories of hybrid vehicles can be identified, depending on the components installed:
• Hybrid Electric Vehicle(HEV): also defined as long-term energy storage systems vehicles. These are characterized by two or more prime movers and power sources. The vehicles design combines a primary energy converter, as an internal combustion engine or a fuel cell, and an electrified secondary energy converter, such as an electric motor. Plug-in hybrid electric vehicles (PHEVs) are part of this group and are basically HEV with the ability to recharge the energy storage system by connecting the vehicle to the electric grid.
• Non-Electric Hybrid Vehicle: also defined as short-term energy storage systems vehicles. These vehicles mainly differ from the HEV because of the presence of non-electrified secondary energy converter, such as mechanical, hydraulic and pneumatic energy storage systems.
11 1.1 Hybrid Electric Vehicles
In general, hybrid electric vehicles include a primary energy converter and an electrified secondary energy converter [1] . The primary energy converter can be an internal combustion engine or, in innovative power train designs, a fuel cell. The secondary energy converter is an electric motor. Different types of motors are used depending on the powertrain design (standard DC, induction AC, brushless DC, etc.). In some configurations, two electric machines are included in the powertrain, one of them acts primarily as a generator. A fundamental component of hybrid electric vehicles is the energy storage system. In the most common vehicles configurations, electrochemical batteries are used. Batteries are devices that convert chemical energy into electric energy and vice versa. Due to their relatively high energy density and low power density [1], electrochemical batteries are suitable for long-term energy storage.
Depending on their specific powertrain configuration, HEVs give the possibility to combine the advantages of the purely electric vehicles, in particular zero local emissions, with the advantages of ICE-based vehicles, namely performance and range. Respect to conventional vehicles based on internal combustion engines, HEVs can profit from various opportunities to improve the fuel economy [2].
In principle, it is possible to:
• recover energy during deceleration instead of dissipating it in friction braking; • downsize the engine;
• regulate and optimize the energy distribution between the prime movers through advanced control strategies;
• eliminate the idle fuel consumption by turning off the engine if the conditions allow for.
Depending on the configuration of the powertrain components, it is possible to identify three categories of HEVs:
a. Series hybrid: the electric motor alone drives the vehicle and the electricity can be provided either by the engine or by the batteries or by an engine-driven generator;
b. Parallel hybrid: both prime movers operate on the same drive shaft. They can drive the vehicle individually or simultaneously;
12
c. Power-split hybrid: it is an intermediate solution between series and parallel
configurations.
A brief description of these configurations is proposed as follows.
a) Series Hybrid Electric Vehicle
Fig 1.1: Series hybrid configuration [3]
Series hybrid propulsion systems utilize the internal combustion engine as an auxiliary power unit to extend the driving range of a purely electric vehicle [1]. The engine is not directly coupled to the wheels. Its torque output is converted into electricity through a generator that can either directly supply the motor or charge the battery.
One of the main advantages of this configuration is the possibility to size the engine to operate at a point with optimal efficiency, since it is not related to the required driving load. However, a series hybrid configuration needs three machines, namely the engine, the electric generator and the electric traction motor. The presence of three interconnected energy converters limits the overall powertrain efficiency. Furthermore, since the traction motor has to be sized based on the maximum power requirements, the vehicle weight may increase considerably. For the above reasons, series HEVs are today limited to few platforms (SUVs, trucks) and heavy-duty vehicles.
13
b) Parallel Hybrid Electric Vehicle
Fig 1.2: Parallel hybrid configuration [3]
In parallel hybrid electric vehicles both the engine and electric motor can supply the traction power, either individually or in combination, creating an additional degree of freedom in fulfilling the power requirements of the vehicle. For this reason, the supervisory powertrain control strategy is very important to optimize the power distribution between the energy conversion systems. With parallel HEV configurations, the engine can be turned off at idle and the electric motor can be used to assist accelerations and, in general, high power demand conditions. Both machines can therefore be sized for a fraction of the maximum power.
One of the main disadvantages is the design complexity that is caused by the fact that both the machines are mechanically linked to the drive train, requiring clutches and transmission components to best optimize energy efficiency.
c) Power-split Hybrid Electric Vehicle
This configuration can be considered a combination of a parallel hybrid and a series hybrid configuration. Both mechanical and electric links are present with two distinct electric machines: one is used as a prime mover while other machine works like a generator and it is used to charge the battery via the engine.
14 1.2 Non-electric Hybrid Vehicles
Non-electric hybrid vehicles have a non-electrified secondary energy converter. The majority of such systems are based on mechanical energy storage devices (flywheels) or hydraulic accumulators, which are characterized by low energy and high power density. For this reason, they are also defined as short-term energy storage systems.
Non-electrified HV can accomplish several functions, such as:
• recovering and storing part of the energy made available by the vehicle’s braking phase and releasing it during the following traction phase. This energy recovery strategy is named regenerative braking;
• allowing for engine torque assist, start/stop strategies and vehicle launch operations.
1.2.1 Energy Storage Systems for HV
Several design solutions have been proposed for energy storage on hybrid vehicles. In general, ESS are characterized by two main parameters, namely specific power and specific energy. The first is directly related to the capability of the system to recuperate high quantities of energy in a limited amount of time, while the second parameter is a measure of the total amount of energy that can be stored in the device. A comparison of the most common energy storage devices are reported in the Ragone plot in Fig 1.3.
15 In Fig 1.3, the most common energy storage devices are shown. It is possible to group them in two distinct categories depending on the function in the power train configuration. The long-term energy storage devices are characterized by high specific energy values and moderate specific power values. In fact their primary function is to provide energy to the system during long time periods. Due to the component characteristics also the energy storing phase occurs on extended period. The short-term energy storage devices are characterized by high specific power values instead. The target storing and release phase duration is therefore much shorter than for the previous devices, making them effective for regenerative braking strategies.
1.2.2 Short-term Energy Storage System
Fig 1.3 presents a comparison of ESS depending on the specific power and specific energy characteristics. Long-term energy storage system components have high specific energy and moderate specific power, and the electrochemical battery is the most common representative unit of this category. Long-term ESS are key components in hybrid electric vehicles. On the other hand, short-term energy storage systems components have high specific power and moderate specific energy. Hydraulic systems, mechanical systems and pneumatic systems belong to this category. Short-term ESS are gaining substantial interest during the last years from the automotive companies, due to the opportunity for low-cost hybridization. Though electric hybrids are a proven technology, with several models in production and advanced development phase, prototypes have been designed and tested by well-know companies adopting flywheel based ESS [5] . Similarly hydraulic energy storage systems have been tested as part of an hydraulic powertrain that substitutes the classical mechanical power train [6] These vehicles show that it is possible to have several advantages realizing low-cost mild-hybrid vehicles. In fact, short-term ESS allows the vehicle recovery braking energy through regenerative braking. In order to maximize energy recovery, high power density is required. The energy recovery allows to considerably improving the fuel consumption, particularly in urban driving. Another advantage of these systems it is the pot ential low-costs and the opportunity of moderate weight addition, especially for ESS.
16
a) Mechanical Energy Storage Systems
Flywheel
Gears
Clutch
CVT
Gears to powertrainFig 1.4: Conceptual scheme of a mechanical ESS
A typical configuration of a mechanical energy storage system is composed by a flywheel, CVT (continuously variable transmission) and clutch. Fig 1.4 shows a simplified scheme of a mechanical energy storage system. A continuously variable transmission (CVT) system with a wide range is necessary between the flywheel shaft and the drive train [4].
In mechanical energy storage systems the main storing component is the flywheel which accumulates energy in kinetic form. The flywheel is generally placed inside a vacuum containment system to reduce the windage losses due to the air viscosity, and it is supported by low-friction bearings. We can distinguish mainly the typologies of applications: low speed flywheels (up to 20,000 r/min) or high speed (up to 70,000 r/min) . The kinetic energy 𝐸 stored in the flywheel depends on the inertia 𝐼 and on the angular velocity 𝑤 by means of the formula:
𝐸 =12 ∗ 𝐼 ∗ 𝑤2 (1.1)
For mobile applications, it would be better to reduce as much as possible the volume and mass of the components, hence using high rotating speeds. However, flywheels are limited to a maximum speed due to limits of material strength. In detail the radial tensile strength on the flywheel structure is mainly due to the centrifugal force due to the rotation of the flywheel around its axis [7]:
17 where
r
is the radius vector of the generic infinitesimal portion of the body with respect to the axis of rotation, ρ(r
) is the mass density at the same point and ω is the flywheelvelocity. The maximum radial tensile strength of the flywheel depends upon the geometry of the flywheel and the physical structure of the material.
b) Hydraulic Energy Storage Systems
Accumulator
Reservoir
Pump/
Motor
Gears
Fig 1.5: Conceptual scheme of an hydraulic ESS
All types of hybrid-hydraulic propulsion systems include a high-pressure accumulator and a low-pressure reservoir. The accumulator contains the hydraulic fluid and a gas such as nitrogen (N2) or methane (CH4), separated by a membrane. When the hydraulic
fluid flows in, the gas is compressed. During the discharge phase, the fluid flows out through the motor and then into the reservoir. The hydraulic motor converts pressure energy of a fluid into mechanical energy available at the motor shaft. Conversely, the machine can operate as a pump, converting mechanical energy back into hydraulic energy. The accumulator potential energy can be expressed by the formula [4] :
𝐸𝑎𝑐𝑐𝑢𝑚𝑢𝑙𝑎𝑡𝑜𝑟= 𝑃0 � �1 −𝑉𝑉 𝑎𝑐𝑐� −𝛾 𝑑𝑉 𝑉𝑚𝑎𝑥 𝑉𝑚𝑖𝑛 (1.3) Where Eaccumulator is the accumulator potential energy, Po is the accumulator pre-charge pressure, Vmin, Vmax and Vacc are the initial volume, the final volume and the total volume of the accumulator, V is the fluid volume in the accumulator and γ is the specific heat ratio of the pre-charge gas. Where Pacc,max is the maximum accumulator pressure
18
2. Literature Review
The previous chapter introduced the most important concepts on hybrid vehicles and energy storage systems. In particular, short-term energy storage systems have been introduced, pointing out their suitability for regenerative braking application, vehicle launch and torque assist. In this chapter, a literature review concerning energy storage system design procedures for ESS, driving cycle analysis methodologies and ESS modeling approaches is presented. This review is aimed at giving a general picture about the state of the art regarding the above topics. In particular it gives a prospective of the contest in which this work brings his contribution.
2.1 Energy Storage System Design Methodologies
The design of energy storage systems for hybrid vehicles is a topic on which engineers have been focusing for several years, since the idea to recover energy form regenerative braking and utilize it to reduce fuel consumption is a key to a more sustainable transportation. In the first treated paper [8] both mechanical and hydraulic energy storage systems were analyzed to obtain minimum sizing of the components.
Fig 2.6: Example of internal combustion engine—flywheel hybrid vehicle powertrain
In Fig 2.6 a flywheel concepts is illustrated. In this configuration the CVT between the flywheel and drive axle allows the flywheel and vehicle speed to be matched under all driving condition. When the engine is operated along the specified power line, its speed and power are directly governed by the flywheel speed except when the flywheel clutch is disengaged.
19 Fig 2.7:Example of Internal combustion engine—accumulator hybrid vehicle
powertrain
In Fig 2.7 a hydraulic concept is illustrated. It uses two variable displacement hydrostatic units. The unit attached to the engine operates only as a pump, but the other unit will alternate between being a pump and a motor, depending upon whether the vehicle is being driven with positive torque or being retarded by regenerative braking. The hydraulic energy from the engine-driven pump is either put into storage in the hydraulic accumulator, or is used to drive the car directly through the final drive pump/motor unit. During regenerative braking, the energy developed by the pump/motor unit is stored in the accumulator.
The studies are based on a 1360 kg vehicle and the implementation of these systems allows the engine to operate close to condition of maximum efficiency or to be turned off during some intervals of the duty cycle. This sizing methodology is based on simulations using different energy storage systems capacities on three driving cycles: Federal Urban Driving cycle, New York City cycle and EPA Highway cycle. Moreover an effect of hill terrains have been proposed introducing constant slopes of -4, -2, +2, +4 percent. From the definition of engine and storage systems control strategies, the performances of the components are evaluated. Also engine on-off cycling have been considered, since it can affect temperature variations in many components. Analyzing Table 2.1 it is possible to notice that as the energy accumulator component increase the size, the frequency of engine on-off decreases and the intervals become longer because a bigger amount of energy is stored.
In this study there is no reference to fuel economy and the only point of reference to evaluate the performances of the systems is the “Friction brake loss” that is related to energy lost and it indicates the amount of energy that could be saved with a larger energy accumulator. The design methodology is simply based on several accumulators dimensions comparison, but there is no consideration about costs and weights of the installed components.
20 Table 2.1: Accumulator and flywheel car operating characteristics
The definition of a methodology to determine the requirements for hybrid vehicles does not involve just mechanical and hydraulic storage systems. In fact plug in hybrid vehicles (PHEV) and fuel cell hybrid vehicles have been subject of a large number of studies and researches. About energy storage systems for fuel cell vehicles the following paper treats [10]. In this study an hybrid size SUV and an hybrid mid-size car were considered, both with primary power source and secondary power source: respectively a fuel cell power unit and an electrochemical energy storage unit. In this case the battery pack sizing is based on several power and energy requirements. These requirements are determined on the vehicles use on representative driving cycles: the regulatory cycles US06, 2UDDS and HWFET. In this analysis the fuel cell unit power
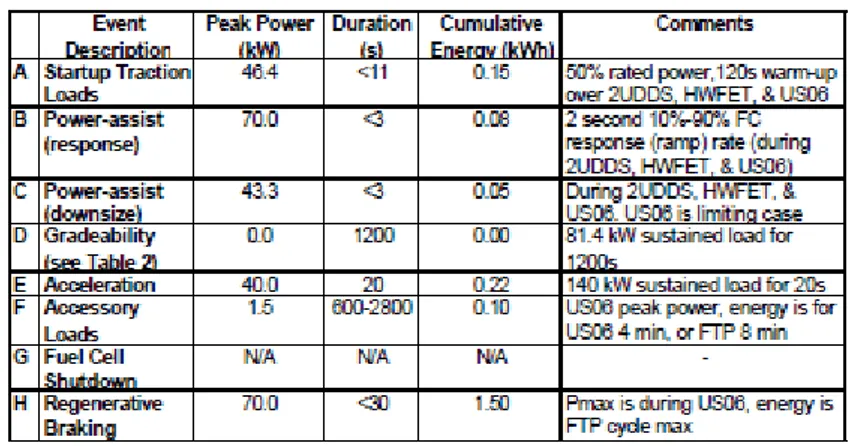
21 is determined. Starting from that, the secondary storage system has to be properly sized to provide the necessary power and energy for the following predetermined events: startup, power driving cycle, regenerative braking phases, acceleration phases, driving on hilling path phase (gradeability performance) and electrical components loads.
For each event above, the power and energy requirements have been evaluated for all the aforementioned driving cycles. Within the determined power and energy requirements, it is possible to identify the limit requirements that are related to the most energy and power requiring cases. In Table 2.2, for each aforementioned event, energy and power values related to limit requirements are reported considering the mid-size SUV hybrid vehicle.
Table 2.2: Summary of Energy Storage Requirements for SUV With a 100 kW Fuel Cell System
In order to size the total energy storage system to meet the energy requirements, this method considers the greatest of four cases: (1) If any energy storage power is required to sustain the grade test at the specified fuel cell size, the energy required to sustain this power plus a 750W accessory power for 20 minutes; (2) The energy required to sustain the energy storage power requirement over six consecutive acceleration tests; (3) The energy required to sustain the Highway or FTP accessory load for eight minutes, or the US06 accessory load for 4 minutes; or (4) The summation of the energies in A, B, and C.
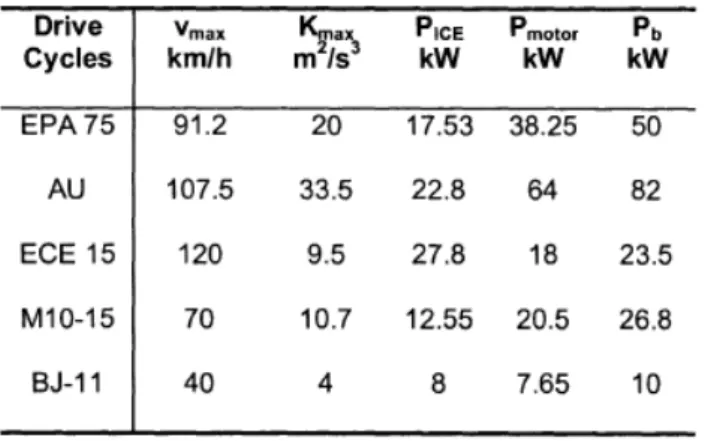
In the following paper [9] a study to optimize the main components of an hybrid electric vehicle is proposed. In particular the extent is the sizing of an internal combustion engine, electric motor and energy storage system based on the demand of different driving cycles. Using this methodology the authors want to determine the peak power capacity of both engine and motor, and the energy capacity of the battery pack for each considered driving cycles.
22 In order to achieve these targets the total power 𝑃 demanded by the vehicle is calculated through the following equation:
𝑃 =𝑉 ∗ (𝑓 ∗ 𝑀 ∗ 𝑔 + 12 ∗ 𝐶𝑑 ∗ 𝐴𝑓∗ 𝜌 ∗ 𝑉
2+ 𝑀𝛿 𝑑𝑉
𝑑𝑡 )
𝜂𝑡 + 𝑃𝑎𝑢𝑥
(2.1 )
where, 𝑃 is the vehicle power demand in Watts, 𝑉 is the velocity of the vehicle in 𝑚 ⁄ 𝑠
, 𝑓 is the coefficient of rolling resistance, 𝑀 is the vehicle weight in 𝑘𝑔, 𝑔 is the
acceleration of gravity in 𝑚 ⁄ (𝑠2) , 𝜌 is the air density in 𝑘𝑔 ⁄ (𝑚3), 𝐶𝑑 is the coefficient of air drag, 𝐴𝑓 is the frontal area of the vehicle in 𝑚2, 𝛿 is the mass factor which includes the effect of rotational inertia, 𝜂𝑡is the transmission efficiency and 𝑃𝑎𝑢𝑥 is the power required to drive the ancillary loads in watts.
The basic sizing concept is that the steady portion of the driving power is provided by the engine, while the transient portion by the motor. Therefore the expression ( 2.1) can be divided in two terms
𝑃𝑒𝑛𝑔𝑖𝑛𝑒 = 𝑉 ∗ (𝑓 ∗ 𝑀 ∗ 𝑔 + 12 ∗ 𝐶𝑑 ∗ 𝐴𝑓∗ 𝜌 ∗ 𝑉2) 𝜂𝑡 + 𝑃𝑎𝑢𝑥 (2.2) and 𝑃𝑚𝑜𝑡𝑜𝑟 = 𝑀 ∗ 𝛿 ∗ 𝑑𝑉𝑑𝑡 ∗ 𝑉 𝜂𝑡 (2.3)
Where 𝑃𝑒𝑛𝑔𝑖𝑛𝑒 is the power provided by the engine and 𝑃𝑚𝑜𝑡𝑜𝑟 is the power provided by the motor. From the equations (2.2) and (2.3) the maximum power requirements are determined by the peak velocity 𝑣𝑚𝑎𝑥 and the motor power rating by the maximum of
𝑑𝑉
𝑑𝑡 ∗ 𝑉 of the specific driving cycle.
To properly size the energy storage unit, in this case the battery pack, the capability to deliver the motor peak power is required. Since during positive motor power demand the power is delivered by the battery, it is possible to express the battery power in watts 𝑃𝑏 by means of the following equation
𝑃𝑏= 𝜂 𝑃𝑚𝑜𝑡𝑜𝑟
23 where 𝜂𝑏𝑎𝑡𝑡 is battery discharging efficiency and 𝜂𝑚𝑜𝑡𝑜𝑟 ismotor efficiency.
Using the sizing criteria above, in Table 2.3 are reported the powers values of the system components for some exemplary driving cycles.
Table 2.3 Determination of ICE, EM and battery power for different driving cycles
2.2 Driving Cycles Analysis Methodologies
In the previous paragraph, different design methodologies have been presented for the energy storage system of H.V., showing that each methodology determines the energy and power requirements for the vehicle components starting from the analysis of driving cycles data. Each methodology uses a different process and different starting inputs to size the components. These inputs derive from an analysis process that extracts and synthesizes specific information from the driving cycles. Each sizing methodology adopts a unique process to analyze driving patterns and to obtain the required inputs for the subsequent hybrid vehicle components sizing process.
The driving cycle analysis can be processed mainly in two steps, depending on the information to extract. The preliminary analysis of driving cycles permits to extract kinematic and statistic driving data considering just the cycle velocity profile versus time, allowing one to obtain information concerning time, distances, number of stops, velocity and acceleration. A more thorough analysis is based on the longitudinal vehicle dynamic equation introduced referring to a set of vehicle parameters. The information that can be extracted regards the energy and power data related to the driving cycle and to the vehicle parameters.
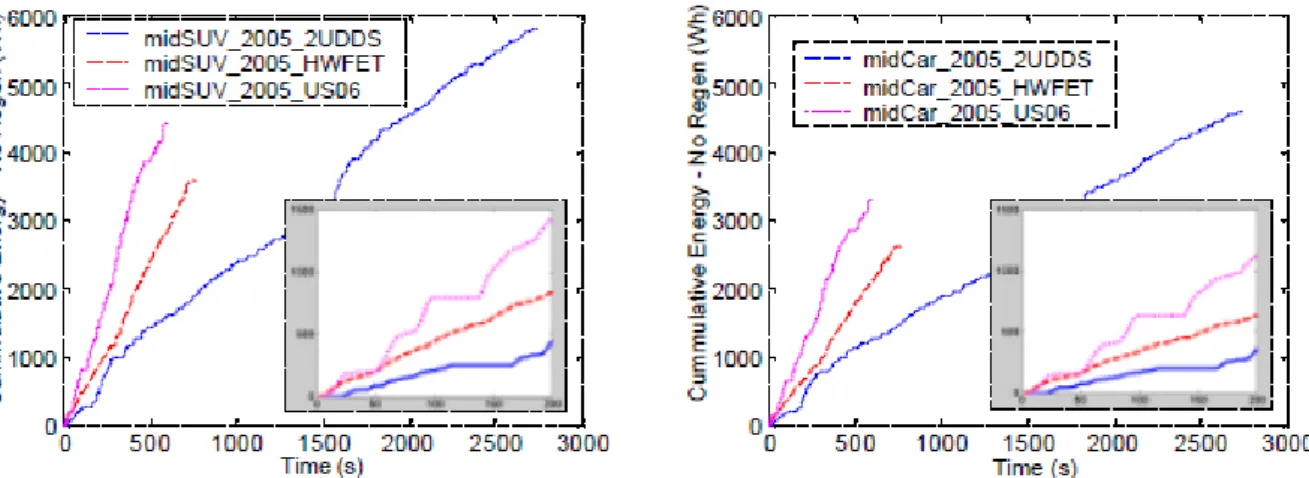
24 In [10], the main goal is to determine the desirable characteristics of an energy storage system for two vehicles, mid-size SUV and midcar, using three typical driving cycles: 2UDDS, HWFET and US06. In this case the driving patterns have been analyzed to extract the cumulative traction energy and the cumulative available braking energy. For each vehicle and for a specific cycle, the total energy required to move the vehicle and the total energy required to brake. The latter is the energy that can be theoretically recovered through an energy storage system. These aforementioned data are reported in Fig2.8 and Fig 2.9. It is worth noting how the amount of the available braking energy depends on each specific driving cycle, increasing the complexity of energy storage system design.
Fig2.8 cumulative traction energy is shown, that is the energy required to complete the patterns.
Fig 2.9 the available braking energy that is dissipate during braking phases.
Analyzing every driving cycle profile it is possible to identify the traction phases, during which the powertrain provides traction power for vehicle motion, and the braking phases, during which the braking force is applied to decelerate the vehicle. The latter ones are also named braking events, where regenerative braking occurs. Each
25 braking event is characterized by a unique duration, power profile and available energy, as shown in Fig 2.10.
Fig 2.10 regenerative braking events analysis for SUV and car [10]
Despite of the fact that the biggest amount of total available braking energy is in 2UDDS driving cycle, the braking events with the highest energy and power peaks are in US06 cycle for both the vehicles. Since the power and energy capacity of the energy storage system has to be determined during design phase, these figures above are fundamental to determine the size of the battery pack that better fits the driving cycles characteristics.
As mentioned before, the braking phase analysis has a critical role. In the next paper [11] the braking energy characteristics on the vehicle speed and braking power in typical urban cycle have been investigated. After the determination of the test vehicle parameters, reported in Table 2.4, the driving power is calculated by means of
𝑃 = 1000 ∗ (𝑀 ∗ 𝑔 ∗ 𝑓 −𝑉 12 ∗ 𝐶𝑑 ∗ 𝐴𝑓∗ 𝜌 ∗ 𝑉2− 𝑀𝛿𝑑𝑉𝑑𝑡 ) (2.4)
The power 𝑃 > 0 for traction phases, whereas 𝑃 < 0 for braking phases. By integrating equation (2.4) it is possible to obtain the braking energy and traction energy profiles during any driving cycle. In this case the power profile has been obtained for the FTP75 urban driving cycle. This profile, along with the velocity profile, is reported in Fig 2.11.
26 Table 2.4: vehicle parameters
Fig 2.11 FTP75 urban driving cycle, [10] .
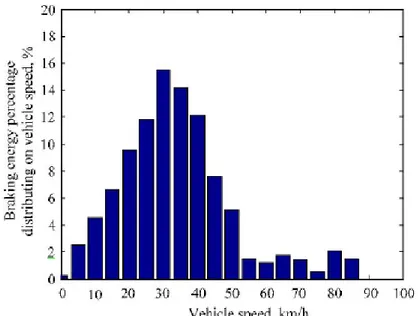
In this analysis of driving cycles, every braking event has been characterized by means of the quantification of energy and vehicle speed at which the phase started. This can be helpful for optimal design and control of braking system As result, the Fig 2.12 has been obtained for the FTP75 urban driving cycle.
27 Fig 2.12 Braking energy distribution on vehicle speed in FTP75 urban driving cycle
Moreover, by means of every single braking event analysis, the braking energy distribution versus braking power over all the driving cycle has be evaluated. This approach can be helpful for power capacity design of the storage system. In Fig 2.13 the braking energy percentage versus braking power is reported for US-FTP75 driving cycle. It shows that using a 15 kW storage system, it is possible to recovery about 85% of available braking energy in all driving cycle. In Table 2.5 the same analysis is reported for different driving cycles.
Fig 2.13 The braking energy percentage at the braking power range that are greater than the power shown in the horizontal axis for FTP75
28 The determination of an energy storage system design methodology implies that the way to analyze the input data to obtain the system optimal design is set, but the results strictly depend on the driving cycle that represents the typical vehicle use. In [12], the impact of several driving cycles in the definition of hybrid plug-in vehicle requirements has been shown. After the vehicle main design methodology definition, several driving cycles have been considered to size the components: Japan1015, Highway EPA Cycle (HWFET), New European Drive Cycle (NEDC), SC03, LA92, and US06. In Fig 2. 14 and Fig 2.15 the main kinematic characteristics of driving cycles are shown: the average and maximum values of velocity and acceleration.
Fig 2. 14:average and maximum velocity over several driving cycle profiles
Fig 2.15: average and maximum velocity over several driving cycle profiles
The vehicle components sizing process is realized for the mentioned driving cycles considering the 10 AER (all electric range) criteria: it means that the hybrid vehicle should be able to drive in all electric mode for a range of 10 miles before the operating mode change and engine turns on. In Fig 2.16 the components size over several driving cycles are reported. From that figure, it is worth to notice:
• the engine power is almost constant since it is only sized to meet gradeability requirements (6% grade at 65 mph).
• electric motor and energy storage system sizes fluctuate a lot because the power capabilities are meant to match the maximum power requirements of the driving cycles.
29 Fig 2.16: components size over several driving cycles expressed as maximum power
In [13], the energy storage system for an hybrid vehicle is investigated. A comparison between a battery based storage system and a mechanical storage system is proposed. In order to do it the US-FTP75 driving cycle is analyzed to extract energy-related information. The driving cycle velocity profile versus time is reported in Fig 2.17.
Fig 2.17: US-FTP75velocity profile
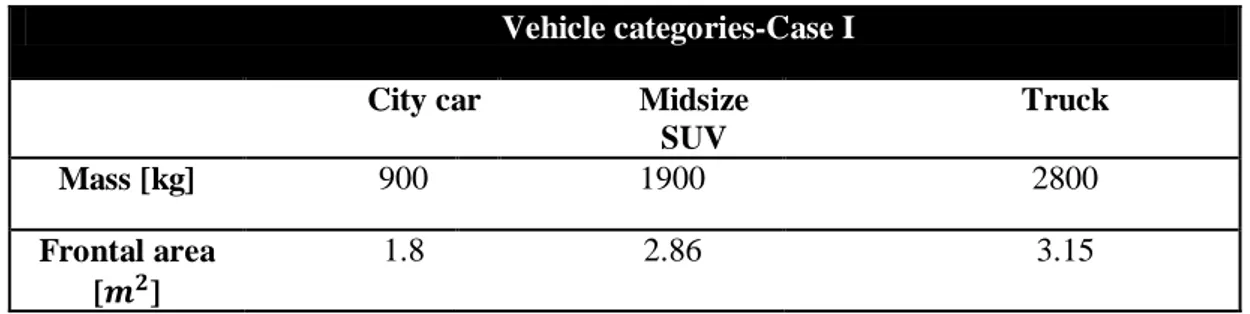
In the US-FTP75 driving cycle, the braking events have been identified. Adopting an exemplary typical vehicle mass of 1900 Kg, the amount of energy lost during each braking phase has been evaluated. Then the distribution of energy over the cycle is obtained as in Fig 2.18: for each considered energy interval, the events occurrences are calculated. As it is possible to notice, in this cycle this biggest part of braking events has a small amount of energy.
30 Fig 2.18:Energy distribution
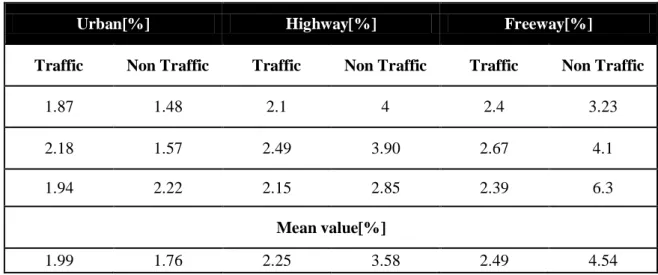
The same analysis based on braking events energy determination and classification is done for a representative real world driving cycle in Fig 2.19. The data marked as “Delta KE” represent the change of kinetic energy of the vehicle in each braking event. But this energy evaluation does not take into account the losses caused by: aero drag, rolling resistance and efficiency of energy storing components. The data marked as “Recoverable” take these factors into account causing energy distribution changes.
31
2.2.1 Principle of Machine Components Design
The energy storage system design methodology needs inputs representing the right typical use of the vehicle to properly size the components. In the same way, machines mechanical components design is based on possible load profiles determination. Machines are composed by multiple components and each of them, during duty cycles, is subject to different stresses that can be static or dynamically variable. The components design is essentially based on a criteria that takes into account the expected stresses and experimental test results. Experimental tests are an essential part in the design process, since from them it is possible to obtain materials characterization caused by several possible uses and working conditions. It was proven that a machine part can withstand static stresses of high magnitude but it can fail if these stresses fluctuate. The safe limits in design analysis of a machine part subject to fluctuating load must be below static loading limits: this discovery prompted the definition of a new property called the fatigue limit.
In design of machine components subject to fluctuating load, the first step is the determination of its life span. In fact, it can withstand the load for an infinite fatigue life span or for a finite number of cycles. Then, the main concern is the typical loading profile definition that represents the target use. Every mechanical component design starts from the foreseen use of it, indeed.
In [14], the authors deal with the necessity of pursuing fatigue reliability to the design of machine tools components. Machine-tools components are subject to variable loads and a design based just on maximum static loads is not sufficient. It is then necessary to base the design on a typical use.
First of all, by means of a large numbers of experimental tests using specimens at each stress level in a planned sequence, the curves R-S-N with constant reliability are obtained. In Fig 2.20 such exemplary curves are shown.
32 Fig 2.20 Exemplary R-S-N curves, where T is load and N cycles to failure
In the machine tools operating process the shear stress, work speed and loading change. By means of the use of a large quantity of tests and data, the loading spectrum and speed spectrum are obtained in Fig 2.21 and in Fig 2.22.
Fig 2.21 Power spectrum, 𝛼𝑣, operation time ratio;𝐶𝑣, power utilization ratio
Fig 2.22 Speed spectrum. 𝛽𝑢., operation time ratio; z, speed step
By means of the knowledge of the characteristic fatigue loading spectrum and the R-S-N curves in Fig 2.23, the reliability analysis is done according to the Palmgren-Miner rule of linear cumulative damage :
∑ 𝐶𝑖 𝑁
𝑖𝑅
�
𝑁
𝑖=1 = 1 (2.5)
where 𝐶𝑖 is the actual number of cycles of the load 𝑇𝑖 and 𝑁𝑖𝑅 is the number of cycles to failure with a specified reliability R at the load 𝑇𝑖.
33 Fig 2.23 Loading spectrum and fatigue damage. T, load; C,
number of cycles
The design for reliability methodology starts from the knowledge of loadings that can be obtained by means of statistical data or by means of experiments to properly size machine components.
2.3 Overview of Modeling Approach for ESS
In the previous sections, an overview about energy storage system methodologies design and driving cycles analysis methodologies have been presented. In this paragraph a modeling approach overview for ESS is treated. In particular it focuses on hydraulic energy storage system and main components modeling. This system modeling is the base for the simulations processed in the following chapters of this work.
The energy storage systems is implemented in the vehicle power train to allow for a dynamic energy buffer that can be used to optimize the energy flows on board and, ultimately, the fuel efficiency of the vehicle [15]. From a system standpoint, power and energy flows through the energy storage system can be represented by means of some fundamental system components:
• Power connection node: this element, physically represented by a clutch/transmission component, allows one to physically connect the ESS to the vehicle powertrain, enabling for a bi-directional flow of power.
• Energy converter: this element converts the power flows at the summation node into a suitable form of energy that can be stored. The conversion process occurs with energy losses, which must be correctly accounted for in order to conduct energy analysis.
34 • Energy storage: this element is able to store energy and release it when required by the control system. From a dynamic system standpoint, the amount of energy stored at a given time represents the state variable of the system.
Prime Mover Transmission Energy Conversion Device Energy Storage Device Wheels Power Summation
Fig 2.24: Energy flow scheme
2.3.1. Hydraulic Energy Storage System Model Components Description
In this section an overview of the main subsystem models of an hydraulic energy storage system is presented.
a) Hydraulic Pump/Motor
The pump/motor has the main function to provide the requested torque by moving the fluid from the reservoir to the accumulator, working as a pump, or from the accumulator to the reservoir, working as motor. The variable displacement pump/motor was modeled by means of using technical data and information available from manufacturers. In this model the flow rates are based upon the speed and displacement of the pump. The block diagram is shown in Fig 2.25.
35
Hydraulic
Pump
Torque
Command Torque
Fluid In Fluid Out Parameters: - Displacement - Efficiency
Fig 2.25: hydraulic pump model The mathematical formulations of the model are
pump pump P D T = *∆ *
η
(2.6) P k DQ= pump*
ω
pump − leak *∆ (2.7)where ) , ( pump pump = f T w η (2.8)
In the above equations 𝐷𝑝𝑢𝑚𝑝 is the pump displacement, ∆𝑃 is the pressure difference between pump outlet and inlet, 𝜂𝑝𝑢𝑚𝑝 is the pump efficiency, 𝑤𝑝𝑢𝑚𝑝is the pump speed, 𝑘𝑙𝑒𝑎𝑘is a coefficient that considers the leaks, Q is the pump flow and T is the torque.
The overall efficiency is based on a lookup table from published pump data from Parker-Hannifin. Since pump efficiency data is only published for maximum displacement, an adjustment in efficiency must be made for cases where the pump displacement is reduced. The approach used refers to a common industry practice: pump leakage is assumed to be constant for a given pressure and pump speed, regardless of displacement. The leakage can be calculated for maximum displacement and applied to all other displacement settings. The resultant reduction in volumetric efficiency for non-maximum displacement conditions can be calculated.
36 b) Accumulator/Reservoir
The accumulator/reservoir stores energy in the form of pressurized hydraulic fluid. The model of this component operates by means of integrating the volumetric flow rate to determine the change in fluid volume. The resulting pressure is calculated based on the initial volume, total volume, pre-charge pressure, and ratio of specific heats. The model block is reported in Fig 2.26.
Accumulator
Fluid Flow Pressure
Parameters: - Volume - Pre-Charge Pressure
Fig 2.26: hydraulic accumulator model The mathematical formulations of the model are:
γ γ 2 2 1 1*v p *v p = (2.9)
The previous equation can be transformed to a more useful form in the following way:
) ) ( 1 ( * 1 k pr A f p p V V = − (2.10)
Where 𝑉𝑓 is the fluid volume, 𝑉𝐴 is the accumulator capacity, 𝑝 is the inlet gauge pressure, 𝑝𝑝𝑟 is the pre-charge pressure and 𝑘 is the ratio of specific heats.
c) Hydraulic Valve (Flow Restriction)
Since the flow changes direction because of the pump/motor working mode changes, the hydraulic valve is necessary. It is modeled as a flow restriction causing a pressure drop depending on the flow rate. The magnitude of the pressure drop is found via lookup table for a given valve. Data published by Parker-Hannifin for an appropriately sized valve was used in the model. The model block is reported in Fig 2.27.
37 Poppet Valve Fluid Flow In Pressure In Parameters: - Flow to pressure correlation
Fluid Flow Out
Pressure Out
Fig 2.27: poppet valve model
After the models overview, the powertrain layout of the hydraulic hybrid simulator is reported in Fig 2.28 . In this configuration the energy storage system is installed in a parallel configuration. The pump is coupled to the powertrain shaft of the transmission.
Fig 2.28: Hydraulic Hybrid Powertrain Layout
2.3.2. Operation of Short-term ESS
In the previous section the hydraulic energy storage system modeling overview has been presented. These models are used to perform simulations over tested driving cycles considering a regenerative braking strategy. The goal is to evaluate the energy and power flow between the storage system and the power train. This flow is bi-directional,
Fuel Tank Engine
Transmission Hydraulic Pump Drive Axle Fuel Energy ICE Power ICE Power Combined Power Braking Power Mechanical Power Summation Power to Wheels Accumulator Reservoir Fluid Power Fluid Power Pump Power
38 depending on the vehicle phase over the cycle: during braking phases, the energy flow is directed towards the storage system, while during the traction phases the energy flows towards the power train to provide torque to the wheels. The target use of the short-term ESS involves storing energy during the braking phase and the complete energy release during the following traction phase.
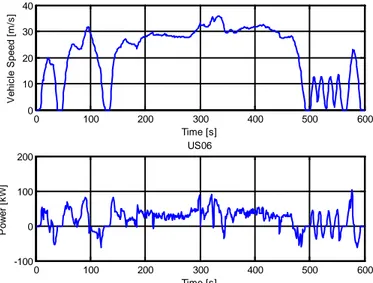
An exemplary operation of the hydraulic ESS use is shown in the figures below. In Fig 2.29 an exemplary driving cycle, US-FTP, is considered and the power profile for a generic mid-size SUV is obtained.
Fig 2.29: US-FTP driving cycle velocity profile and power profile for the
From these profiles it is possible to individuate a typical braking phase followed by a traction phase can be considered as reported in Fig 2.30 and highlighted by a red line. Both driving cycle velocity profile and power profile are reported. It possible to notice the decelerating phase followed by a vehicle rest and then an accelerating phase.
0 200 400 600 800 1000 1200 1400 1600 1800 2000 0 20 40 60 Time [s] V ehi c le S peed [ m ph] 0 200 400 600 800 1000 1200 1400 1600 1800 2000 -50 0 50 Time [s] P ow er [ k W ]
39 Fig 2.30: typical braking and traction phase velocity and
power profiles
In the first phase, highlighted by a red line, the energy flows from the power train to the accumulator. The hydraulic pump coupled to the power train transforms mechanical energy into pressure energy moving the fluid from the reservoir to the accumulator. In the following traction phase, highlighted by a green line, the fluid flows from the accumulator to the reservoir. The torque is provided to wheels by means of the pump working in this phase as motor.
2.3.3. Hydraulic ESS Literature Review
In the previous section the model of a hydraulic ESS and the main use in a regenerative braking strategy have been shown. In literature a lot of papers treat the hydro accumulator modeling. Hydraulic regeneration systems have been considered by the automotive industry for implementation in hybrid vehicles for a number of years. A seminal study on this subject is presented in [16], describing an analytical model of a
4900 500 510 520 530 540 5 10 15 20 25 30 35 Time [s] V ehi c le S peed [ m ph] FTP 490 500 510 520 530 540 -25 -20 -15 -10 -5 0 5 10 15 [K W] [s]
40 hydraulic regeneration system consisting of an accumulator, an oil reservoir, a variable-displacement pump/motor and connecting lines. The modeling approach adopted allows for determining several variables, including accumulator pressure and temperature, pump/motor torque and efficiencies, pressure losses, and flywheel speed. Power losses and round-trip efficiencies are also determined. The results are indicative that improvements are needed to increase the energy density of hydraulic accumulators in many applications where space, weight, and power are critical.
The University of Michigan has developed various prototypes of hydraulic hybrid, using models and HIL (Hardware In the Loop) systems for experimental and prototyping studies. Recently published are [16] [17] focus on the modeling, simulation, design optimization and control of a series hydraulic hybrid (SHH) propulsion system. The study is performed in simulation, considering a series hybrid propulsion system of a four-wheel drive off-road downsized Diesel truck. In the SHH, the engine is directly coupled to a hydraulic pump/motor. Traction pump/motors are connected to the wheels to provide propulsion, and a hydraulic accumulator allows energy storage (max. operating pressure of 35-45 MPa). A low-pressure is also present in the system, primarily to enable transfer of fluid to-and-from the accumulator. The energy storage model is largely based on the energy-based model developed in [16]. In order to operate such system, a thermostatic controller was implemented. The simulation studies presented compare the SHH to the conventional vehicle, showing an overall fuel economy improvement of about 50% on the FUDS cycle.
The Center for Compact and Efficient Fluid Power (CCEFP) at the University of Minnesota works on light-duty hybrid vehicles. In [19] an attempt at improving the energy density of hydraulic accumulators is made. Conventional accumulators operate as closed systems, where the gas enclosed in the chamber is alternatively compressed and expanded. As the system must contain the expanded gas and the hydraulic oil displaced, the optimal energy density occurs at a modest expansion ratio, resulting in a small energy density. By adopting an open accumulator approach, allowing intake and exhaust of compressed and expanded air from and to the atmosphere, a potential increase in energy density is available. The paper reports analysis and simulation results to illustrate the advantages and challenges of such system.
A different approach to hybrid hydraulic systems is proposed in [20], where a Hydraulic Launch Assist (HLA) system is illustrated. Similarly to the starter/alternator technology of mild hybrids, the HLA captures energy during vehicle deceleration by compressing fluid in a hydraulic accumulator system. The hydraulic accumulator system can then be
41 used to provide torque at a subsequent vehicle launch. The HLA system is connected to the driveline with a clutch. The paper focuses on the implementation of such system (normally designed for heavy-duty applications) to small road vehicles in urban driving conditions. Simulation results show fuel economy savings in the order of 7-10% in standard urban driving cycles.
A similar approach is presented in [21], where a Hydraulic assist power system (HAPS) concept uses the existing hydraulic pump of the transmission unit as the motor/pump set directly. This solution leads to reduced size, lower weight and less cost of a conventional hydraulic system, and enables for vehicle energy recovery, engine restart, and hill-holding.
2.4 Introduction to the Work
In this literature review some energy storage systems design methodologies have been presented in order to give a design approaches overview. It is possible to affirm that the most of the design procedures focuses on electric hybrid vehicle and plug-in hybrid vehicles. They mainly treat issues related to the electric components requirements determination. Each of them has a specific method to analyze driving cycles that are considered to represent a typical system use and to extract information. Their common design approach is to seek in the driving cycle the most extreme energy-related conditions and to match the system requirements to them. So the design is realized with the goal to match the cycle maximum power requirements or to match the power requirements of the worst pre-defined events. In other terms they base the energy storage system design worst-case scenario over the cycle. This approach is suitable for long-term energy ES but are not for short-term ES systems. A short-term ESS based on this criterion would bring to system components oversized respect to the real requirements. Although it could be useful to store big amounts of energy it would have great drawbacks. The determination of the energy storage system components has to consider physical and practical aspects as components masses and volumes indeed. The maximization of main storing units, as the flywheel for the mechanical system or the accumulator for the hydraulic system, implies masses and volumes increase. If on the hand these increases give the chance to store more energy and then to theoretically reduce the fuel consumption, on the other hand they can increase the expenses to carry
42 on the project and they can bring disadvantage in fuel economy because of the increased weight of the vehicle.
The work developed in this thesis proposes a design methodology for short-term energy storage systems, such as mechanical, hydraulic and pneumatic systems. The procedure starts from the extraction of statistical information from the driving cycle adopting several criteria. Then, using these information as design inputs, several system designs are obtained.
This thesis focuses specifically the driving cycle analysis methodology. This is the first part of the short-term ES system design procedure and it synthesizes the design inputs of the design procedure. Despite of the presence of several driving cycles analysis methodologies shown in the literature review, it was necessary to create a new one suitable for this design procedure. The driving cycle analysis is a key element in the design approach and it diverges from the other approaches. In fact, as explained in the following chapter 3, it presents an innovative way to analyze the cycle and to synthesize the cycle information. In chapter 4, the complete short-term ESS design methodology is explained and applied to an exemplary hydraulic system. In chapter 5, by means of using the complete design procedure applied to the hydraulic energy storage system, the design procedure is validated. Since from the design procedure several system designs can be obtained, a final system designs comparison is done considering efficiency values over testing driving cycles.
43
3. Driving Cycle Analysis Methodology
The literature review chapter has outlined several design methodologies for energy storage system. Most of the approaches presented consider design metrics based on driving cycles information, from which a “worst-case” scenario is defined to determine the system design specifications. Such methods are suitable for long-term energy storage systems but not for short-term systems, since the use of the two systems is different.
The Ohio State University has developed a design methodology to target short-term energy storage systems, in particular mechanical and hydraulic systems.
This design approach, shown in detail in Fig 3.1, is based on:
• Application of data analysis and clustering techniques to identify characteristic driving events;
• Utilize characteristic events to set design targets and constraints; • Using parametric models of ESS to determine design attributes; • Evaluate design on energy-based hybrid vehicle model.
Fig 3.31: ESS design methodology flow chart
The preliminary phase of the design methodology is the driving cycle analysis, which defines the ESS design specifications in terms of energy and power requirements. In this chapter a driving cycle analysis and synthesis methodology is proposed to produce the Design Inputs for the definition of the ESS design parameters. Fig 3.1 shows the flow chart of the design procedure. The innovation of the driving cycle analysis methodology is related to the different way to analyze the cycle and to synthesize the extracted information. At first, the methodology focuses on the braking
1. Design Inputs 2.Design Targets 3.Design Constraints 4. Components Sizing 5.Design Attributes 6. Design Evaluation
44 and acceleration events of the driving cycle. Then, the extracted driving data are statistically processed to build characteristic stop/start events which define the Design Input for the design process.
In the first part of this chapter, road-load analysis of driving cycles is proposed and illustrated for the US06 cycle. The aim of the procedure is to extract information on the most relevant dynamic and energy-related variables. At the end of this analysis it will be possible to define a “statistically” relevant event that will define the size of the energy storage system.
In the second part, the “statistically” relevant event will be analyzed by means of a sensitivity test varying the vehicle mass and front area values. Then the “statistically” relevant event identification process will be applied to several different driving cycles, although the methodology is completely independent on the nature of the driving cycle.
In the last part, three statistically relevant cycles representative of “real-world” commuting scenarios are presented. The patterns obtained are then processed to define design targets that will be the input of the following part of the design procedure of the energy storage system.
45
3.1 Development of a Driving Cycles Analysis Tool
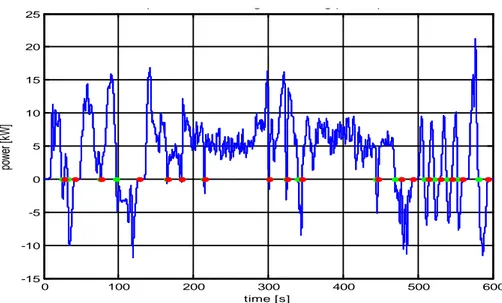
In order to define the design requirements for AESS, a tool for the analysis of driving cycles was built. The developed tool allows one to determine the vehicle power and energy demand at the wheel for a prescribed driving profile. Further, a decomposition in events is made to determine the characteristics of deceleration/ acceleration maneuver that is the statistically most representative of the entire driving profile.
The analysis tool includes the following tasks:
• calculation of the traction power at the wheel based upon a simplified model of the longitudinal dynamics of the vehicle;
• identification and classification of the cycle events;
• calculation of the distribution of the dynamic and energy-related variables;
• synthesis of the distributions of such variables to create a statistically representative event of the driving cycle
First of all, a brief introduction to regulatory and “real world” driving cycles is necessary, since they both have been used to test the analysis tool.
3.1.1. Driving Cycles
Driving cycles are generally characterized by a velocity vs. time profile and represent a driving route. These cycles can be modeled on data acquired during real driving experiences or can be synthesized from model. They are usually adopted to perform many different vehicles tests on the dynamometer, where the force at the wheels is chosen to emulate the vehicle energy losses while driving that specific route.
a) Regulatory Cycles
Worldwide vehicles emissions and consumption tests are based on regulatory driving cycles, whose profiles depend on the most common routes characteristics of each specific country. The most common test cycles to determine fuel economy and emission levels are the New European drive Cycle (NEDC),the Japan 10-15 cycle and the U.S. CAFE cycles. Although many others countries use these cycles, each one is designed to represent vehicle velocity profiles characteristic of given country, with different mean
46 and top velocity, duration, length and stop numbers. In this analysis the considered driving cycles are the US06, FTP-75 and NEDC.
b) Real-world Driving Cycles
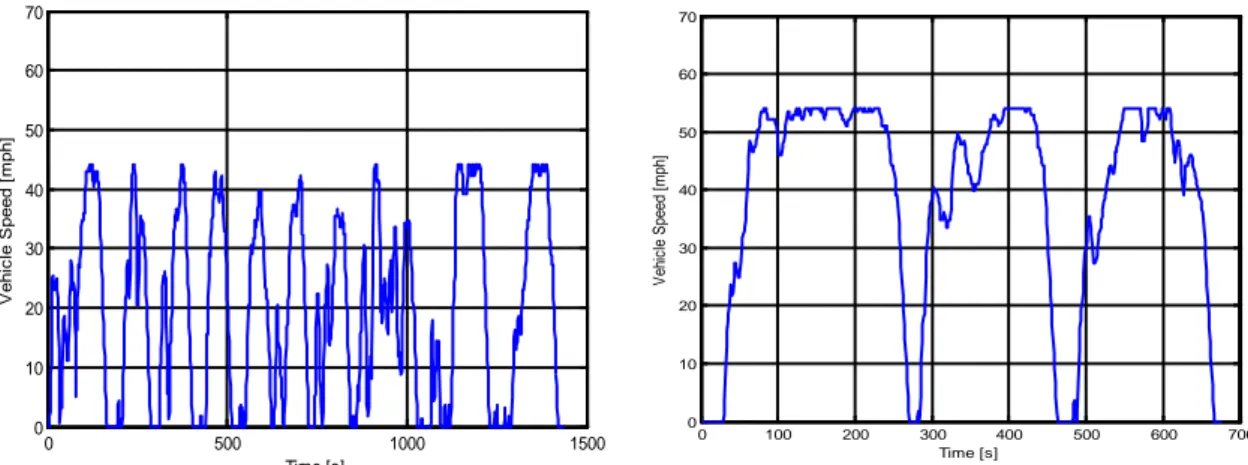
In this work, the analysis and synthesis of design requirements has been extended also to “real-world” cycles [23]. Real-world driving data are different from regulatory cycles. Though regulatory cycles are used by national authorities to test and homologate vehicles, “real-world” cycles are more representative of real world driving conditions. They consist of synthetic vehicle velocity segments, generated stochastically on the basis of acquisition of on-road vehicle speed vs. time data during one year period. By means of a clustering process and Markov-chain model application, it is possible to generate stochastic velocity segments. During the generation process, by imposing different boundary conditions (maximum velocity, average velocity and stops per mile), the segments are grouped into three main driving pattern categories: urban, freeway and highway. Moreover, it is possible to represent for each category also traffic and no traffic conditions by means of small variation in the boundary conditions values. The input data were chosen in consideration of typical daily commuting scenarios for urban or sub-urban driving in the United States. Table 3.1 shows the patterns created for this study. Every segment has one mile length.
Table 3.6 Input data to create “real cycles”
Pattern Average
velocity [mph]
Minimum velocity [mph]
Stops per mile
Urban No traffic (UNT) 15 35 1
Traffic (UT) 5 20 10
Highway No traffic (HNT) 40 55 0.5
Traffic (HT) 20 45 2
Freeway No traffic (FNT) 50 70 0.1
Traffic (FT) 30 55 1
47
Fig 3.32 Example of custom urban driving cycle with traffic condition
Fig 3.33 Example of custom urban driving cycle with no traffic condition
Fig 3.36 Example of custom freeway driving cycle with traffic condition
Fig 3.37 Example of custom freeway driving cycle with no traffic condition
In the figures above it is possible to notice the “real-world” segments different characteristics depending on the pattern. In Fig 3.2 the urban cycle with traffic conditions is characterized by low speed and frequent stops, while in Fig 3.7, the freeway cycle with no traffic has high speed and one stop.
0 200 400 600 800 1000 1200 1400 1600 1800 0 10 20 30 40 50 60 70 Time [s] V ehi c le S peed [ m ph] 0 100 200 300 400 500 600 0 10 20 30 40 50 60 70 Time [s] V ehi c le S peed [ m ph] 0 500 1000 1500 0 10 20 30 40 50 60 70 Time [s] V ehi c le S peed [ m ph] 0 100 200 300 400 500 600 700 800 0 10 20 30 40 50 60 70 Time [s] V ehi c le S peed [ m ph]
Fig 3.34 Example of custom highway driving cycle with traffic condition
Fig 3.35 Example of custom highway driving cycle with no traffic condition 0 500 1000 1500 0 10 20 30 40 50 60 70 Time [s] V ehi c le S peed [ m ph] 0 100 200 300 400 500 600 700 0 10 20 30 40 50 60 70 Time [s] V ehi cl e S peed [ m ph]
48 3.1.2. Driving Cycles Analysis
A first analysis of the driving data can be made by identifying the average and maximum velocity values, along with the duration, length and number of stops. In particular, the following metrics are computed:
• Average and maximum acceleration; • Average and maximum deceleration; • Average and maximum velocity; • Cycle length;
• Cycle duration;
• Stop number (not accounting the final vehicle stop); • Number of stops/km.
Such metrics are reported in Table 3.2 for some important regulatory cycles, such as US06, FTP Highway and FTP Urban.
Table 3.7:velocity metrics for some regulatory driving cycles
US06 FTP highway FTP urban
Average velocity [m/s] 21.49 21.58 9.48 Average acceleration [m/s^2] 0.67 0.19 0.51 Average deceleration [m/s^2] -0.73 -0.22 -0.57 Top speed [m/s] 35.9 26.78 25.35 Maximum acceleration [m/s^2] 3.75 1.43 1.48 Maximum deceleration [m/s^2] -3.08 -1.21 -1.47 Stop number 4 0 21 Cycle time [s] 600 765 1874 Cycle length [km] 12.88 16.51 17.77 Number of stops/km 0.31 0 1.19
A second step in the analysis consists in the determination of vehicle forces and power requirements. To this extent a vehicle model has to be introduced starting from the elementary equation that describes the longitudinal dynamics of a road vehicle.
49
3.1.2.1. Vehicle Longitudinal Dynamic
Considering a generic vehicle with velocity 𝑉 travelling on a road with grade 𝛼, the equation that determines the net traction force required at the wheels to propel the vehicle is given by:
where 𝑚𝑣 is the system mass, 𝐹𝑡 is the net traction force, 𝐹𝑎 is the aerodynamic friction force, 𝐹𝑟 the rolling friction force, 𝐹𝑔 the force caused by gravity when driving on non-horizontal roads [24].
a) Aerodynamic Friction
The aerodynamic resistance 𝐹𝑎 acting on a vehicle in motion is caused on one hand by the viscous friction of the surrounding air on the vehicle surface. For a standard passenger car, the car body causes approximately 65% of the aerodynamic resistance. The rest is due to the wheel housings (20%), the exterior mirrors, eave gutters, window housings, antennas, etc. (approximately 10%), and the engine ventilation (approximately 5%) [25]. The equation generally considered to capture this action is:
𝐹𝑎 =12 ∗ 𝜌𝑎∗ 𝐴𝑓∗ 𝐶𝑑∗ 𝑉2 (3.2)
where 𝑉 is the vehicle speed, 𝜌𝑎 the density of the ambient air, 𝐴𝑓 is the vehicle frontal area and the parameter 𝐶𝑑 is the aerodynamic friction coefficient, generally estimated using CFD programs or experiments in wind tunnels.