INFLAMMATION IN CROHN’S DISEASE PATIENTS
Michele Scagliarini1
Department of Statistical Sciences, University of Bologna, Bologna, Italy
Andrea Belluzzi
Gastroenterology Unit, S. Orsola-Malpighi Hospital, Department of Medical and Surgi-cal Sciences, Bologna, Italy
Eleonora Scaioli
Gastroenterology Unit, S. Orsola-Malpighi Hospital, Department of Medical and Surgi-cal Sciences, Bologna, Italy
Carla Cardamone
Gastroenterology Unit, S. Orsola-Malpighi Hospital, Department of Medical and Surgi-cal Sciences, Bologna, Italy
1. Introduction
The new goal in treating Crohn’s Disease (CD) patients is not only the im-provement of symptoms and the induction of clinical remission but also the achievement of endoscopic and histological remission, with a reduced need of hospitalization and CD-related surgery (Pariente et al., 2011).
Faecal calprotectin (F C) is a non-invasive biomarker currently used for mon-itoring inflammatory bowel disease (IBD) activity (Røseth et al., 1999). Levels of F C have been shown to correlate well with both endoscopic and histological parameters of the disease activity in patients with CD (Sipponen et al., 2008).
In particular a F C level ≥ 150µg/g intercepts endoscopically and histologi-cally active disease (i.e. evident mucosal inflammation) and identifies patients in clinical remission but with active disease and prone to clinical relapse (Gisbert et al., 2009).
The question of scientific interest in this study is to propose a method for identifying patients at high risk of symptomless but ongoing inflammation: the ability to discriminate subjects in this way would allow clinicians to improve the management of CD patients.
In this framework a key role is played by the Crohn’s Disease Activity Index (CDAI) (Best et al., 1976) which is the gold standard for monitoring clinical activity in CD patients (Yoshida, 1999).
In clinical practice, CDAI scores < 150 are associated with quiescent (asymp-tomatic) or clinically non-active disease. CDAI scores ≥ 150 are indicative of clinically active disease, while scores over 450 indicate extremely severe disease. The issue concerning the potential usefulness of Crohn’s Disease Activity Index for assessing the endoscopic activity of the disease has been largely debated without achieving a definite conclusion (Brignola et al., 1986; Cellier et al., 1994; Jones et al., 2008; af Bj¨orkesten et al., 2012).
The aim of the present work is to set out the problem from a statistical point of view involving: a multivariate approach, which enables us to consider the joint role of CDAI and other clinical covariates using a single model; a logistic regression model, which allows us to quantify the risk of F C ≥ 150µg/g (i.e. an endoscopic active disease).
The results indicate that the proposed model provides a clear picture of the relationship among the selected predictors and the outcome of interest and has a very appreciable ability for identifying patients at high risk of symptomless but persistent inflammation.
The paper is organized as follows. The following Section introduces the data and describes materials and methods. Section 3 contains the estimation of the multivariate regression model and the and the assessment of its performance. Section 4 reports results and discussion. Finally, Section 5 contains our conclud-ing remarks.
2. Data, materials and methods
The data set consists of 193 consecutive Crohn’s Disease patients attending an outpatient clinic, between January 2013 to December 2013, according to the following inclusion and exclusion criteria.
Inclusion criteria: age from 16 to 89 years; Crohn’s Disease diagnosed at least 6 months previously. Exclusion criteria: patients with overlapping infectious, enterocolitis from Salmonella, Shighella, Campylobacter, Clostridium difficile or Cytomegalovirus; patients with a pouch; patients with a colostomy; patients with known neoplasia.
During the visit a blood sample and a sample of faeces were collected. The faecal sample was stored in a refrigerator at 2◦C−8◦C for a maximum of 48 hours before being sent to the central laboratory of Sant’Orsola Hospital, Bologna, where the calprotectin assay was performed using a quantitative, enzyme-linked immunosorbent assay (ELISA). The blood sample was also analysed at the Sant’Orsola Hospital central laboratory to determine hematocrit values.
During the same visit, clinical parameters were recorded, using validated questionnaires, which, together with the hematocrit value, were used to deter-mine the Crohn’s Disease Activity Index. A summary of the clinical character-istics of our population study is shown in Table 1.
3. The model
Logistic regression is well suited for studying the relation between a categorical or qualitative outcome variable (Y ) and one or more predictors.
Consider a collection of p independent variables denoted by the vector x′ = (x1, x2, ..., xp) and let the conditional probability that the outcome is present be
TABLE 1
Clinical characteristics of CD patients. (PUFAs, polyunsaturated fatty acids; CDAI, Crohn’s disease activity index; TNF-α, tumor necrosis factor-α)
Patient characteristics Continuous Variables
(median;min-max;mean ± SD ) Categorical Variables n (%)
Age (years) 36.5; 18 − 75; 41 ± 15.05
Duration of disease (years) 4; 1 − 36; 7.1 ± 8.1
CDAI 84.8; 32 − 401.6; 93.3 ± 50.8 Faecal Calprotectin (µg/g) 112; 4 − 1231; 199.4 ± 218.86 Gender Male 87 (45.1%) Female 106 (54.9%) Disease Location Ileum 83 (43%) Colon 27 (14%) Ileocolon 83 (43%) Prior Surgery Yes 87 (45.1%) No 106 (54.9%) Smoker Yes 58 (30.1%) No 135 (69.9%) Disease behaviuor Inflammatory 88 (45.6%) Stenosing 59 (30.6%) Penetrating 46 (23.8%) Ongoing Treatement no medication 31 (16.1%) 5-aminosalicylic acid 57 (29.5%) n-3 PUFAs 2 (1.0%) corticosteroids 29 (15.0%) thiopurine 34 (17.6%) methotrexate 3 (1.6%) TNF-α antagonist 37 (19.32%)
TABLE 2
Estimation results for the F C model
Predictors Estimate Std. Err. z-value p-value
Intercept −1.6667 0.5594 −2.9791 0.0029
DIS LOC −2.5826 0.9803 −2.6345 0.0084
CDAI 0.0147 0.0057 2.5834 0.0098
DIS LOC×CDAI 0.0257 0.0095 2.7017 0.0069
denoted by π (x) = P r (Y = 1|x).
The multivariate logistic regression model has the general form
π (x) = 1
1 + exp{−g (x)} (1)
where g (x) = β0+ β1x1+ β2x2+ ... + βpxp is the logit of the model, β0 is the intercept and βj (j = 1, 2, ..., p) are the slope parameters.
For our purposes, using the F C threshold usually adopted in clinical practice (150µg/g), we define as dichotomous outcome the variable Y ”dichotomised calprotectin” which assumes the following values: yj= 0 if subject j has F C < 150µg/g; yj = 1 if subject j has F C ≥ 150µg/g (j = 1, 2, ..., n).
Crohn’s Disease is a complex disease influenced by several factors thus, with the aim of finding the best fitting and most parsimonious clinically interpretable model, we initially fit a multivariate logistic model including all clinically and intuitively relevant covariates.
The results showed that: Age and Duration of disease, considered as continu-ous covariates, did not result statistically significant; Disease behavior, Ongoing treatment, Prior surgery and Smoking considered as a polychotomous covariates and included in the model using design variables (two design variables for Dis-ease behavior, six design variables for Ongoing treatment, one design variable for Prior surgery and one design variable for Smoking) did not result statistically significant; all interaction effects did not result statistically significant (Hosmer et al., 2013).
The logistic regression analysis showed that two clinical covariates and their interaction effect are significant in estimating the probability of F C ≥ 150µg/g (i.e. the probability of an endoscopically and/or histologically active disease):
1. Disease location with two levels, Ileum and Colon or Ileocolon, coded in the model with the design variable DIS LOC: DIS LOC = 0 for Ileum; DIS LOC = 1 for Colon or Ileocolon;
2. CDAI score as a continuous covariate.
The estimated logistic regression coefficients with the corresponding standard errors are shown in Table 2.
Summarizing the estimated logit (or risk score) is
bg (x) = − 1.6667 − 2.5826 · DIS LOC + 0.0147 · CDAI+
0 100 200 300 400 0.0 0.2 0.4 0.6 0.8 1.0 CDAI
Estimated probability of Y=1
Ileum (DIS_LOC=0)
Colon or Ileocolon (DIS_LOC=1)
Observed prop. of Y=1 among Ileum
Observed prop. of Y=1 among Colon or Ileocolon
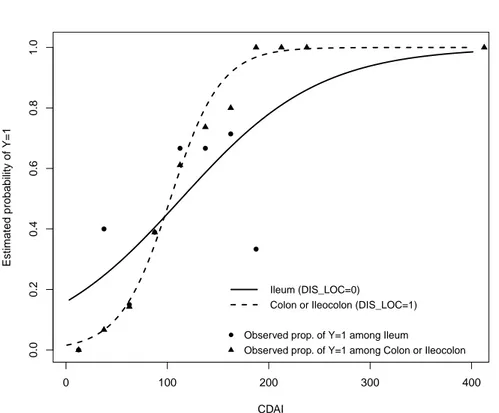
Figure 1 – Estimated probability curves and observed proportions stratified for DI S LOC versus CDAI score
3.1. Model performance assessment
For the evaluation of model performance we consider overall performance, cali-bration and discrimination.
The model likelihood ratio, which assesses the overall significance of the model, is L.R. = 59.23 (p-value< 0.0001) and the goodness of fit test is z = 0.1384, p-value= 0.8899 (le Cessie and van Houwelingen, 1991). Therefore we can conclude that there is no evidence of lack of fit (Harrell, 2014; Agresti, 2002). The model calibration, i.e. the agreement between predicted probabilities and observed frequencies of the event of interest, can be assessed by means of Figures 1 and 2.
Figure 1 shows the estimated probability curves for subjects with DIS LOC = 0 (Ileum) and for those with DIS LOC = 1 (Colon or Ileocolon) as a function of the CDAI score. Figure 1 also shows the observed proportions of subjects with F C ≥ 150µg/g among those patients with DIS LOC = 0 (triangles) and patients with DIS LOC = 1 (circles) obtained by grouping the data into CDAI intervals (≤ 25], (25, 50], ..., (400, 425]).
Figure 2 shows the validation graph for the estimated model: ”Non-parametric” is a smoothed function of observed events plotted versus predicted probabilities while ”Ideal” is the ideal 45-degree line and the triangles indicate the outcomes
0.0 0.2 0.4 0.6 0.8 1.0 0.0 0.2 0.4 0.6 0.8 1.0 Predicted risk of FC>=150 Obser v ed propor tions Ideal Nonparametric Grouped patients Intercept Slope C (ROC) Brier scaled R2 0.00 1.00 0.80 0.27 0.36 FC>=150 FC<150
Figure 2 – Validation graph for the estimated model: ”Non-parametric” is a smoothed function of observed events plotted versus predicted probabilities; ”Ideal” is the ideal 45-degree line; triangles indicate the outcomes for deciles of prediction with their 95% confidence intervals
for deciles of prediction with their 95% confidence intervals. Several perfor-mance measures complete the legend (Steyerberg et al., 2010; Royston and Alt-man, 2010). Examining Figures 1 and 2 we note a very appreciable agreement between predicted probabilities and observed frequencies of the event of interest. The model’s ability to discriminate between those subjects who experience the outcome of interest versus those who do not, can be assessed by means of several measures. The concordance (c-index) statistic is the most commonly used performance measure to indicate the discriminative ability of generalized linear regression models (Royston and Altman, 2010). It is the proportion, among all pairs of patients with different outcomes, in which the event probabilities predicted by the model are in the same order as the actual outcomes. The c-index is thus the probability, across all patients, that a model will be correct in predicting that one patient has a higher probability of the outcome than another patient. For a binary outcome, the c-index is identical to the AUC: the Area Under the Receiver Operating Characteristic (ROC) Curve.
Usually, the outcome prediction is bY = 1 when bπ(x) > π0 and bY = 0 when b
π(x) ≤ π0, where π0 is the cut-off probability. Let us denote with T P the number of true positives (i.e. bY = 1 when Y = 1 ), T N the true negatives (i.e.
b
Y = 0 when Y = 0 ), F P the false positives ( bY = 1 when Y = 0) and F N the false negatives ( bY = 0 when Y = 1 ). Sensitivity and specificity are defined in terms of T P , T N , F N and F P :
sensitivity = T P
0.0 0.2 0.4 0.6 0.8 1.0 0.0 0.2 0.4 0.6 0.8 1.0 1 − specificity sensitivity c−index (AUC) = 0.8047
Figure 3 – ROC curve for the fitted logistic regression model
specif icity = T N
T N + F P (4)
The ROC curve plots the sensitivity against one minus specificity for a range of possible cut-off probabilities.
The ROC curve for the fitted model is shown in Figure 3. In our case AUC=0.8047 (95%CI: 0.7429−0.8666) which indicates that the estimated model has an excellent discrimination ability.
4. Results and discussion
The estimation results show that DIS LOC and CDAI are significantly associ-ated with F C ≥ 150µg/g and that a significant interaction effect is present: for DIS LOC = 0 (Ileum location) the estimated risk of F C ≥ 150µg/g (Y = 1) is relatively high for low values of CDAI and shows a moderate increasing-rate; for DIS LOC = 1 (Colon or Ileocolon) the estimated risk of F C ≥ 150µg/g has a very different behaviour since it assumes low values for low CDAI scores but increases rapidly when CDAI increases (Figure 1).
The presence of a significant statistical interaction have important implica-tions: the relationship between each of the interacting covariates (CDAI and Disease location) and the risk of having a mucosal inflammation depends on the value of the other interacting predictor (i.e. is not simply additive). This is evident in the odds ratio for DIS LOC which is not constant over the levels of CDAI.
TABLE 3
Estimated Odds Ratios (OR), with 95% confidence limits, for DIS LOC as a function of CDAI CDAI Estimated OR 95% CI 50 0.27346 0.09116-0.82027 100 0.98938 0.50121-1.95301 110 1.27955 0.62106-2.63623 120 1.65483 0.73796-3.71085 130 2.14018 0.85057-5.38502 140 2.76786 0.96042-7.97682 150 3.57965 1.06975-11.97841 200 12.95139 1.66996-100.44462 TABLE 4
Estimated odds ratio (with 95% confidence limits) for several increments in the predictor CDAI for disease locations Ileum and Colon or Ileocolon
DIS LOC=0 DIS LOC=1
CDAI increments OR 95% CI OR 95% CI 5 1.07603 1.01784-1.13755 1.22369 1.13537-1.31889 10 1.15785 1.03600-1.29402 1.49743 1.28907-1-73947 15 1.24588 1.05448-1.47202 1.83240 1.46357 2.29416 20 1.34061 1.07329-1.67450 2.24229 1.66170-3.02574 25 1.44254 1.09244-1.90483 2.74388 1.88665-3.99062 30 1.55222 1.11193-2.16684 3.35768 2.14205-5.26318
In Table 3 we show the estimated odds ratios and the corresponding 95% confidence intervals for DIS LOC = 1, versus DIS LOC = 0 for several values of CDAI. It can be noted that the estimated odds ratio increases from a value of about 0.27 at CDAI = 50 and becomes significant approximately at CDAI = 150, where the lower confidence limit drops above 1.
As far as the covariate CDAI is concerned we have that also the odds ratio for CDAI increments are influenced by the disease location. In Table 4 are reported the estimated odds ratios for several increments in CDAI for the dif-ferent disease locations considered. Examining these results, it can be seen that for an increment of 20 points in the CDAI score, the odds of having a mucosal inflammation are estimated to increase: of 1.34 times (95%CI: 1.07 − 1.67) for Ileal disease location; of 2.24 times (95%CI: 1.66 − 3.03) for colonic or ileocolonic disease location (Table 4).
Furthermore it is worth noting that the estimated model is able to quantify the risk of symptomless but ongoing inflammation since CDAI scores ranging from 100 to 150, which conventionally indicate a ”clinically non-active” disease, are actually associated with a relevant probability of persistent mucosal inflam-mation. Specifically our model shows that when CDAI = 120 the estimated probability that F C ≥ 150µg/g is:
• 0.52 (95% CI: 0.38 − 0.66) if DIS LOC = 0; • 0.64 (95% CI: 0.51 − 0.76) if DIS LOC = 1. When CDAI = 140 these probabilities are:
These results conveniently contextualized in a clinical field are of significant value: as an example a symptomless CD patient with a CDAI = 140 with an ileal disease location has a 60% chance of having an endoscopically and/or histologically-evident ”active disease”; while for a patient with the same CDAI score, but with a colonic or ileocolonic disease, the estimated risk having a mucosal inflammation rises up to 80%. A similar reasoning can be applied with regard CDAI = 120.
4.1. Cut-off analysis
The discrimination ability of the estimated model is very appreciable (AU C = 0.8047). Therefore, even with several cautions, we shall explore the potentialities of a diagnostic decision rule based on the estimated model.
The optimal probability cut-point π0 for the purposes of classification is usually chosen according several criteria among which we mention:
• a) the criterion based on Youden’s J -statistic (Youden, 1950) where the optimal cut-off point is the one that maximizes the sum of sensitivity and specificity minus one
J = max(sensitivity + specif icity − 1) (5)
• b) the cut-off which minimizes the distance d between the curve and the upper left corner of the graph, where
d =p(1 − sensitivity)2+ (1 − specif icity)2 (6) • c) the cut-off which maximizes both sensitivity and specificity.
For the fitted model: the probability cut-off that satisfies criteria a) and b) is π0= 0.392262 for which J = 0.51604 and d = 0.342519 (sensitivity = 0.768293, specif icity = 0.747748); the cut-off which maximizes both sensitivity and speci-ficity is π0 = 0.399818 , this ”optimal” choice for the probability cut-point is approximately where the sensitivity and specificity curves cross (sensitivity = 0.743902 and specif icity = 0.747748). These results are summarized in Figure 4 and 5 respectively.
Thus, if the objective is to choose an optimal probability cut-off for the purposes of classification, one might select as cut-off point π0= 0.392262 (criteria based on J -index and upper left corner distance), which corresponds to a 77% of correct classification for true positives and a 75% of true negatives.
Choosing as cut-off π0= 0.392262, the corresponding value of the risk score is gπ0(x) = −0.43781. The estimated risk-score (2) equals the value gπ0(x) = −0.43781 when CDAI = 94.40 for subjects with DIS LOC = 0 and when CDAI = 83.84 for subjects with DIS LOC = 1.
Thus, contextualizing these findings in a diagnostic framework, a patient with a CDAI score less than 94.40 with an ileal disease location is classified by
0.0 0.2 0.4 0.6 0.8 1.0 0.0 0.2 0.4 0.6 0.8 1.0 probability cut−off J−inde x and distance J−index distance cutoff=0.392262
Figure 4 – Plot of Youden’s J statistic and d (top-left corner distance) versus all possible probability cut-off points.
0.0 0.2 0.4 0.6 0.8 1.0 0.0 0.2 0.4 0.6 0.8 1.0 probability cutoff
sensitivity and specificity
sensitivity specificity
cutoff=0.399818
or histologically active disease.
Similarly, a person who has a colonic or ileocolonic disease with a CDAI score less than 83.84 is classified as bY = 0: a patient that likely does not have an inflammation. Finally, a patient who has the same disease location, but with CDAI ≥ 83.84 likely does have an active mucosal inflammation.
It should be noted that in this work we do not propose changing the CDAI threshold currently used in clinical practice. Rather, the results emphasize that values of CDAI usually considered as not clinically relevant (< 150) actually correspond to situations in which there is a high risk that Crohn’s Disease is endoscopically and/or histologically active.
5. Concluding remarks
To our knowledge, this is the first study that investigated the relationship among Crohn’s Disease Activity Index, Disease location and Faecal calprotectin in a large cohort of CD patients.
Naturally we are aware that the results obtained are valid only for the pa-tients of our population study, and that therefore some caution is required before extending our results in general. Keeping this caution in mind, we can conclude that our proposal could provide a useful clinical decision aid.
The estimated model with CDAI and disease location as predictors allows to estimate the probability of F C ≥ 150µg/g: a situation that is strongly indicative of endoscopically and /or histologically active disease. Furthermore, it is worth noting that the proposed model allows to take into account that the effect of one predictor variable on the response variable is different at different values of the other predictor. To facilitate the use and interpretation of our results we provide a nomogram (Appendix) which allows to compute the probability of having faecal calprotectin ≥ 150µg/g.
Finally, the estimated model, besides having an excellent discrimination abil-ity, is able to intercept the presence of a symptomless inflammation since the results indicate that CDAI scores ranging from 100 to 150, which convention-ally indicate a ”clinicconvention-ally non-active” disease, are actuconvention-ally associated with a high probability of the presence of mucosal inflammation.
This ability is potentially very useful for improving patient management, scheduling invasive procedures at the right time and tailoring the best treatment strategy in order to control the clinical evolution of CD in such a way to reduce hospitalization, CD-related surgery and future disability.
Acknowledgements
The authors are grateful to the Editor and the Reviewers for their valuable suggestions which helped in improving the paper.
Appendix
A nomogram (Figure 6) is a convenient graphical tool to compute the probability of an outcome of interest (Harrell, 2014; R Core Team, 2013).
Points 0 10 20 30 40 50 60 70 80 90 100 CDAI (DIS_LOC=0) 0 70 160 260 360 CDAI (DIS_LOC=1) 0 30 60 90 130 170 210 250 290 330 370 Total Points 0 10 20 30 40 50 60 70 80 90 100 Risk Score −6 −4 −2 0 2 4 6 8 10 12 Prob(FC>=150) 0.01 0.04 0.1 0.3 0.5 0.8 0.95 0.99 0.999
Figure 6 – Nomogram for computing the estimated risk of an active disese
The location disease establishes which CDAI scale must be used. Therefore based on the CDAI score the corresponding total point value can be read on the ”Total Points” axis. Therefore, the probability of F C ≥ 150µg/g for each subject can be calculated from the scale presented on the bottom line.
For instance, let us consider a patient who has the disease localized in the ileum with a CDAI score of 130: this subject has about 28 points and the corresponding estimated probability of F C ≥ 150µg/g is about 0.56. Similarly, a patient who has colonic or ileocolonic disease and with a CDAI score of 130 has about 33 points and the corresponding estimated probability of having an active disease about 0.73.
nen, M. F¨arkill¨a (2012). Surrogate markers and clinical indices, alone or combined, as indicators for endoscopic remission in anti-TNF-treated luminal Crohn’s disease, 47(5), pp. 528-537.
A. Agresti (2002). Categorical Data Analysis, 2nd ed. Wiley, Hoboken.
W. Best, J. Becktel, J. Singleton, F .Jr Kern (1976). Development of
a Crohn’s disease activity index. National Cooperative Crohn’s Disease Study. Gastroenterology, 70(3), pp. 439-444.
C. Brignola, G. Lanfranchi, M. Campieri, G. Bazzocchi, M. Devoto,
P. Boni, P. Farruggia, S. Veggetti, A. Tragnone (1986). Importance
of laboratory parameters in the evaluation of Crohn’s disease activity. Journal of Clinical Gastroenterology, 8(3), pp. 245-248.
C. Cellier, T. Sahmoud, E. Froguel, A. Adenis, J. Belaiche, J. Bre-tagne, C. Florent, M. Bouvry, J. Mary, R. Modigliani(1994). Corre-lations between clinical activity, endoscopic severity, and biological parameters in colonic or ileocolonic Crohn’s disease. A prospective multicentre study of 121 cases. The Groupe d’Etudes Thrapeutiques des Affections Inflammatoires Digestives. Gut, 35(2), pp. 231-235.
J. Gisbert, F. Bermejo, J. Prez-Calle, C. Taxonera, I. Vera, A. McNicholl, A. Algaba, P. Lpez, N. Lpez-Palacios, M. Calvo, Y. Gonzlez-Lama, J. Carneros, M. Velasco, J. Mat´e (2009). Faecal cal-protectin and lactoferrin for the prediction of inflammatory bowel disease re-lapse. Inflammatory Bowel Diseases, 15(8), pp. 1190-1198.
F. E. Jr Harrell (2014). rms: Regression Modeling Strategies. R package version 4.1-1. http://CRAN.R-project.org/package=rms.
D. W. Jr Hosmer, S. Lemeshow, R. X. Sturdivant(2013). Applied Logistic Regression 3rd edn. Wiley, Hoboken.
J. Jones, E. Jr Loftus, R. Panaccione, L. Chen, S. Peterson, J. Mc-Connell, L. Baudhuin, K. Hanson, B. Feagan, S. Harmsen, A. Zins-meister, E. Helou, W. Sandborn (2008). Relationships between disease activity and serum and fecal biomarkers in patients with Crohn’s disease. Clin-ical Gastroenterology and Hepatology, 6(11), pp. 1218-1224.
J. Langhorst, S. Elsenbruch, J. Koelzer, A. Rueffer, A. Michalsen, G. Dobos (2008). Noninvasive markers in the assessment of intestinal in-flammation in inflammatory bowel diseases: performance of fecal lactofer-rin, calprotectin, and PMN-elastase, CRP, and clinical indices. The American Journal of Gastroenterology, 103(1), pp. 162-169.
S. le Cessie, J. C. van Houwelingen (1991). A Goodness-of-Fit Test for Binary Regression Models, Based on Smoothing Methods. Biometrics, 47, pp.1267-1282.
B. Pariente, J. Cosnes, S. Danese, W. Sandborn, M. Lewin, J. Fletcher, Y. Chowers, G. D’Haens, B. Feagan, T. Hibi, D. Hommes, E. Irvine, M. Kamm, E. Jr. Loftus, E. Louis, P. Michetti,
P. Munkholm, T. Oresland, J. Pan´es, L. Peyrin-Biroulet, W.
Reinisch, B. Sands, J. Schoelmerich, S. Schreiber, H. Tilg, S. Travis, G. van Assche, M. Vecchi, J. Mary, J. Colombel, M. Lmann (2011). Development of the Crohn’s disease digestive damage score, the Lmann score. Inflammatory Bowel Diseases, 17(6), pp. 1415-1422.
R Core Team (2013). R: A Language and Environment for Statistical Com-puting, R Foundation for Statistical, Vienna, Austria. URL http://www.R-project.org/.
R. Royston, D. G. Altman (2010). Visualizing and assessing discrimination in the logistic regression model. Statistics in Medicine, 29, pp.2508-2520. A. Røseth, P. Schmidt, M. Fagerhol (1999). Correlation between faecal
excretion of indium-111-labelled granulocytes and calprotectin, a granulocyte marker protein, in patients with inflammatory bowel disease. Scandinavian Journal of Gastroenterology, 34(1), pp. 50-54.
T. Sipponen, E. Savilahti, K. Kolho, H. Nuutinen, U. Turunen, M. F¨arkkil¨a (2008). Crohn’s disease activity assessed by faecal calprotectin and lactoferrin: correlation with Crohn’s disease activity index and endoscopic findings. Inflammatory Bowel Diseases, 14(1), pp. 50-46.
E. W. Steyerberg, A. J. Vickers, N. R. Cook, T. Gerds, M. Gonen,
N. Obuchowski, M. J. Pencina, M. W. Kattan (2010). Assessing the
Performance of Prediction Models A Framework for Traditional and Novel Measures. Epidemiology, 21, pp.128-138.
E. Yoshida(1999). The Crohn’s Disease Activity Index, its derivatives and the Inflammatory Bowel Disease Questionnaire: a review of instruments to assess Crohn’s disease. Canadian journal of gastroenterology, 13(1), pp. 65-73. W. J. Youden(1950). Index for rating diagnostic tests. Cancer, 3, pp.32-35.
Summary
In Crohn’s Disease it is extremely important to detect the presence of symptomless mucosal inflammation in such a way as to prevent the evolution of the disease. The aim of this study is to identify predictor variables for estimating the risk of the presence of mucosal inflammation. The results show that the estimated model provides a clear picture of the relationship among the selected predictors and the outcome of interest and has a very appreciable ability for identifying patients at high risk of symptomless but persistent inflammation.
Keywords: Logistic Regression; Odds Ratio; Risk Assessment; Diagnostic Rule; Crohn’s Disease.