Aging behavior in Cu–Al–Be shape memory alloy
Alberto Somoza and Ricardo Romero
IFIMAT, Universidad del Centro de la Provincia de Buenos Aires, Pinto 399, 7000 Tandil, and Comisio´n de Investigaciones Cientı´ficas de la Provincia de Buenos Aires, Argentina
Lluı´s Man˜osa and Antoni Planesa)
Departament d’Estructura i Constituents de la Mate`ria, Facultat de Fı´sica, Universitat de Barcelona, Diagonal 647, E-08028 Barcelona, Catalonia, Spain
~Received 15 December 1997; accepted for publication 25 September 1998!
This article reports positron annihilation spectroscopy and calorimetric measurements of the aging behavior in a Cu–Al–Be shape memory alloy. An excess of single vacancies is retained in the alloy as a result of a quench. All vacancies in excess disappear after long aging time, and a migration energy EM51.060.1 eV for this process has been found to be larger than in other Cu-based shape memory alloys. The good correlation found for the concentration of vacancies and the shift in the martensitic transition temperature demonstrates that, in Cu–Al–Be, changes in the transition after a quench are deeply related to the excess of vacancies. © 1999 American Institute of Physics. @S0021-8979~99!02101-5#
I. INTRODUCTION
The martensitic transformation is a diffusionless struc-tural transition between crystalline phases.1Due to the spon-taneous symmetry breaking at the transition, a single crystal of the high temperature phase splits into several twin-related domains which configure a complex heterophase. Many characteristic features of martensites, including shape memory properties, are a direct consequence of the interplay between these domains.2Among the different materials dis-playing these peculiar thermomechanical properties, the Cu-based alloys are receiving increasing attention.3In the range of compositions of practical interest, in these systems the martensitic transition takes place from an ordered bcc phase ~or bphase! to an 18R structure.4In general, the bphase is the equilibrium phase at high temperature but it can be re-tained as a metastable phase at low temperature by means of a quench.4 During the quench, Cu-based alloys get configu-rationally ordered; the order–disorder transitions have been investigated in relation to the martensitic transition in a num-ber of alloys.4–6
Among Cu-based shape memory alloys, Cu–Al–Be is the one that has been developed more recently and is unique because of its adaptability for high as well as low tempera-ture actuator applications.7Indeed, this potentiality is the re-sult of the drastic effect of a small addition of Be to the Cu–Al system, which strongly reduces the martensitic tran-sition temperature and leaves practically unaltered the low temperature limit of stability of thebphase~eutectoid point!, as well as the order–disorder transition line.6,7
Above room temperature, aging effects represent a seri-ous limitation on the actual applications of shape memory alloys.8 In several Cu-based alloys, such as the Cu–Zn–Al and Cu–Al–Ni systems, these effects have been extensively studied and are well understood in terms of ordering
processes.9,10On the contrary, in the case of the Cu–Al–Be alloy, only few works have been devoted to this problem which still remains unclear. Notwithstanding, very recent neutron diffraction experiments11 have undoubtedly demon-strated that in this alloy the influence of aging on the mar-tensitic transition cannot be attributed to changes in long range atomic order in the system. Moreover, it has been found that the concentration of vacancies is strongly depen-dent upon the quenching temperature.12These results suggest that aging effects in Cu–Al–Be could have their origin in the effect of vacancies on the martensitic transition. The goal of this article is to provide experimental evidence in support of such a statement.
Positron annihilation spectroscopy has been used for the study of vacancies. This is acknowledged to be the most powerful method for the study of point defects in metals and alloys.13In the present work, the positron lifetime technique is employed in order to characterize the properties of quenched-in vacancies in Cu–Al–Be. In addition to the sig-nificant interest in relation to the aging problem, the subject is also of fundamental importance since experimental infor-mation concerning vacancy migration energies in b -Cu-based alloys is still scarce.14,15On the other hand, the mar-tensitic transition has been studied by differential scanning calorimetry measurements. This technique has been widely used in the characterization of this kind of transitions in shape memory materials.
II. EXPERIMENTAL PROCEDURE
The sample investigated was a single crystal of compo-sition Cu-22.72 at % Al-3.5 at % Be, grown by the Bridgman method. The order–disorder ~from a DO3, space group Fm3m, to a disordered phase, space group Im3m! and nominal martensitic transition temperatures are 793 and 145 K, respectively. Samples of 15 mm diameter and 1.5 mm thickness for both positron lifetime measurements and calo-a!Electronic mail: [email protected]
JOURNAL OF APPLIED PHYSICS VOLUME 85, NUMBER 1 1 JANUARY 1999
130
0021-8979/99/85(1)/130/4/$15.00 © 1999 American Institute of Physics
rimetry, were cut from the original rod using a low speed diamond saw. The damaged surface was etched away with a solution of 50% HNO3in water.
For positron annihilation spectroscopy measurements, two identical samples were sandwiched with a 20 mCi 22NaCl positron source evaporated onto a 1.14 mg/cm2 Kap-ton foil. The lifetime measurements were carried out using a fast–fast timing coincidence system with a time resolution of 255 ps in operating conditions. The lifetime spectra, each containing at least 106 counts accumulated in a time interval of 7200 s, were analyzed by theRESOLUTIONand POSITRON-FIT computer programs.16 After subtracting background and source contribution ~the source contributes to the spectra with only one component,tS5382 ps, IS512.5%!, all
spec-tra could be fitted with one or two components, depending on the aging time. Prior to the measurements, the sample was maintained at 1073 K for 7200 s, and subsequently it was quenched into an ice–water mixture. This quenching tem-perature was chosen both to retain a high vacancy concen-tration and to minimize the time, after quenching, during which the positron signal remains in the saturation regime ~when all positrons are annihilated in vacancies12!. After the quench, the sample was isothermally aged at 323, 333, 343, 358, and 373 K for different aging times taging. In all cases the positron measurements have been performed at room temperature.
Calorimetric measurements have been carried out using a highly sensitive differential scanning calorimeter.17 Imme-diately after the quench, the sample was mounted into the calorimeter, and a first calorimetric run was conducted. The time elapsed between the quench and the beginning of the cooling cycle was around 200 s. After this first run, the sample was annealed inside the calorimeter at a temperature of 323 K. Additional calorimetric runs were performed at selected aging times. We have not studied different aging temperatures because the experimental system was not pre-pared for working at higher annealing temperatures. In the cooling cycle, the calorimeter was cooled from 323 K down to liquid nitrogen temperature in less than 150 s. From this temperature, it was heated up to;160 K at a rate ;1 K/min, and calorimetric data were acquired at ;1 Hz. The run was completed by heating the calorimeter as fast as possible ~av-erage rate 1 K/s! up to 323 K. Such an experimental proce-dure minimized the uncontrolled time spent by the sample at temperatures where thermally activated phenomena can oc-cur, and hence it ensured that the measured aging time at 323 K was comparable to that measured in positron annihilation experiments.
III. RESULTS AND DISCUSSION
Positron annihilation results have been analyzed accord-ing to the procedure followed in previous studies.12,18–20 First of all, we have obtained the aging time variation of the average positron lifetime ^t& for different moderate aging temperatures Taging. In general,
^
t&
5I1t11I2t2, where I1 1I251, I1 and I2 are the intensities of the first and second lifetime components, and t1 and t2, the short- and long-lived lifetimes, respectively. As mentioned above, in somecases, depending on the aging time, a two terms decomposi-tion was not appropriate and in these cases ^t& has been considered to be the lifetime component. This is consistent with the standard trapping model: when short-lived lifetimes t1 are shorter than 40 ps and I1 or I2 are less than 10%, the fitting procedure cannot resolve a two-decomposition process.21The extreme cases correspond to a near free-defect annihilation regime (I1;1) and to a saturation defect trap-ping regime (I2;1).
In our experiments, in the whole range of the investi-gated aging temperatures and times, we have obtained, within the experimental scatter, a constant value of the long-lived lifetime t2. By averaging data corresponding to constrain-free analysis we obtained t2517061 ps. Conse-quently, in all data analysis, the lifetime of the long-lived component has been fixed to this value. In all cases, the average lifetime value monotonously decreases with increas-ing agincreas-ing time taging from its initial value of about 170 ps. After long enough aging time, the original bulk lifetime, tf 5119 ps, is recovered. Besides, we have observed that the higher the aging temperature, the faster the decrease of ^t&. This behavior suggests that thermally induced point defects are frozen-in by the quench, and they anneal-out completely after aging. Moreover, it is worth mentioning that no detect-able amount of precipitates of other phases within the b-matrix phase after the thermal treatment has been found.
Assuming that after a quench the retained defects are mainly single vacancies (t25tv) and according to the well-known standard trapping model ~STM! ~see Ref. 22!, the product of the defect concentration Cv and the positron spe-cific trapping rate mv can be determined from
mvCv5 1 tf
^
t&
2tf tv2^
t&
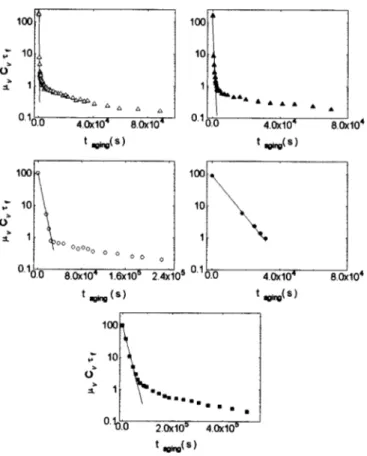
. ~1!In Fig. 1 the values ofmvCvtf are shown versus tagingin a semilogarithmic plot for the five aging temperatures inves-tigated. Since mv and tf can be considered to be constant,
these plots are equivalent to Cv vs tagingplots.
In b Cu-based alloys, the vacancy formation energy is estimated to be about 0.5 eV or higher,23,24 therefore, the equilibrium vacancy concentration for the aging tempera-tures of this study can be considered negligible. Conse-quently, the variation of vacancy concentration during aging can be described by
dCv/dt52Cvrn0 exp~2EM/kTaging! ~2! where Cv is the single vacancy concentration,n0 is the vi-brational frequency,ris the atomic concentration of vacancy sinks, and EM, an activation energy. When the atomic con-centration of vacancy sinks is assumed to be constant in Eq. ~2!, a linear behavior of ln(Cv) as a function of aging time is
expected for each constant Taging. All curves in Fig. 1 show an initial fast decay followed by a crossover to a very slow regime. As can be observed in Fig. 1, a linear fit in the time interval in which the vacancy concentration falls, at least two orders of magnitude is quite satisfactory in all cases ~see solid lines!. In this case, it is important to point out that for all aging temperatures the first experimental points of mvCvtf corresponding to the almost saturation
defect-131 J. Appl. Phys., Vol. 85, No. 1, 1 January 1999 Somozaet al.
trapping regime, are affected by a significant error associated with the use of Eq. ~1!; however, the extrapolation of the solid lines corresponding to the linear fit in the region of the fast decrease of the experimental data, is in good agreement with the initial vacancy concentration data obtained for each aging temperature.
For this region of fast decrease shown in Fig. 1, the evolution of the vacancy concentration with the aging time can be described by
Cv}exp~2taging/u!, ~3!
whereuis an average relaxation time characterizing the time scale of the evolution towards equilibrium. We assume thatu is proportional to exp(EM/kT), where EM is an effective mi-gration energy of vacancies. The logarithm ofu21as a func-tion of 1/T, is for all aging temperatures represented in Fig. 2. From the slope of a least-square straight line fit (lnu21 526.47– 11766/T) the migration energy is obtained. The re-sult of this calculation is EM5(1.060.1)eV. It is worth
not-ing that, in spite of the experimental scatter, the present EM
value is considerably higher than that obtained for b Cu– Zn–Al, EM5(0.6560.03 eV)14 and for b Cu–Zn, EM5(0.61 eV).15
The thermal curves recorded during the reverse marten-sitic transition at different aging times are shown in Fig. 3~a!. It is apparent from the figure that upon increasing the aging time, the transition shifts towards lower temperatures. We
have used the temperature of the peak in the thermogram (TA) as the characteristic temperature for the transition~the
associated error is60.2 K!.
It is acknowledged that successive cycling of a shape memory alloy through the martensitic transition can result in a modification of the martensitic transition characteristics. Therefore, the temperature shift of the thermograms at dif-ferent aging times can be affected by this phenomenon. In order to account for this effect, we have investigated the influence of thermal cycling in the same sample, after being quenched and annealed for a period of long enough time~;1 week! to reach the equilibrium state. The recorded thermo-grams are shown in Fig. 3~b!. A slight shift in the transition temperature towards lower values on increasing the number of cycles is found. We have corrected the measured values of TA at each aging time, by the shift associated with the
cor-responding number of cycle. In Fig. 4, we have plotted these corrected values of TA and the concentration of vacancies as
a function of aging time. We have used the value of the FIG. 1. Evolution of the vacancy concentration Cvin semilogarithmic scale
as a function of aging time at 323 K~squares!, 333 K ~filled circles!, 343 K
~open circles!, 358 K ~filled triangles!, and 373 K ~open triangles!. The solid
line is a fit to the experimental data corresponding to short aging time.
FIG. 2. Arrhenius plot of the logarithm of the inverse of relaxation timeuas a function of 1/T. The straight line is a least-square linear fit.
FIG. 3. Thermal curves recorded during the reverse martensitic transforma-tion:~a! at different aging times (Taging5323 K), and ~b! during successive thermal cycling of a long time aged sample.
132 J. Appl. Phys., Vol. 85, No. 1, 1 January 1999 Somozaet al.
specific trapping rate mv51.631015s21 recently obtained for the B2 structure FeAl.25 The behavior of TA with aging
time seems to exhibit two different regimes: a fast initial decay, followed by a long tail. This is qualitatively similar to the dependence of the vacancy concentration with aging time. Nevertheless, the decay of the transition temperatures in the initial regime is faster than in the concentration of vacancies. Such a different behavior cannot be attributed to changes in the long-range atomic order;11 it may be due to local atomic order rearrangements. In any case, the results presented here seem to indicate that in Cu–Al–Be, the most important source of the changes in the martensitic transition during aging is the evolution of the concentration of vacan-cies in the alloy. The results found for Cu–Al–Be are in contrast to the behavior observed for Cu–Zn–Al. In that al-loy, changes in the transition temperature during aging arise from a variation in the degree of long-range order.4,11 We argue that the influence of vacancies on the transition occurs via a modification of the effect of Be on the transition tem-perature. Actually, it has been proposed26that the strong ef-fect of Be arises from a mass–disorder efef-fect owing to the small mass of Be in comparison with that of Cu and Al. Since the excess of vacancies induces a decrease in the ef-fective Be concentration, the change in the transition tem-perature during aging is expected to be proportional to this vacancy excess. This prediction is consistent with the results given in Fig. 4. From the data shown in the figure it is ob-tained that dTA/dCv'104 K. This value conforms to the
measured dependence of TA with Be concentration. 7
IV. SUMMARY AND CONCLUSIONS
In this article we have characterized the aging behavior of the Cu–Al–Be shape memory alloy by positron annihila-tion and calorimetric techniques. It has been shown that after the quench there is an elimination of quenched-in vacancies.
The migration energy of vacancies (EM51.060.1 eV) has
been found to be higher than in other Cu-based alloys. In addition, the correlation found for the concentration of va-cancies and the shifts in the transition temperatures, is an experimental evidence that the concentration of vacancies has an important contribution in determining the evolution of the martensitic transition characteristics during the post-quench aging of Cu–Al–Be. This result shows that the physical origin of the aging phenomena observed in Cu– Al–Be is completely different from that in other Cu-based shape–memory alloys.
ACKNOWLEDGMENTS
This work has received partial financial support from the CICyT~Spain!, Project No. MAT95-504, Consejo Nacional de Investigaciones Cientı´ficas y Te´cnicas ~PIP/BID No. 4318/97!, Comisio´n de Investigaciones Cientı´ficas de la Pro-vincia de Buenos Aires, Fundacio´n Antorchas and Secretarı´a de Ciencia y Te´cnica~UNCentro!, Argentina.
1A. L. Roitburd, Solid State Physics: Advances in Research and
Applica-tions, edited by H. Ehrenreich, F. Seitz, and D. Turnbull~Academic, New
York 1978!, Vol. 33, p. 1. 2
L. Delaey, Materials Science and Technology, Phase Transformations in
Materials, edited by P. Haasen~VCH, Weinheim, 1991!, Vol. 5, p. 339.
3See, Proceedings ICOMAT’95, Part II, edited by R. Gotthardt and J. van Humbeeck~Les Editions de Physique, Les Ulis, 1995!.
4
M. Ahlers, Prog. Mater. Sci. 3, 135~1986!.
5V. Recarte, O. A. Lambri, R. B. Pe´rez-Sa´ez, M. L. No, and J. San Juan, Appl. Phys. Lett. 70, 3513~1997!.
6M. Jurado, T. Casta´n, L. Man˜osa, A. Planes, J. Bassas, X. Alcobe´, and M. Morin, Philos. Mag. A 75, 1237~1997!.
7
S. Belkahla and G. Gue´nin, J. Phys. IV 1, C4~1991!. 8X. Ren and K. Otsuka, Nature~London! 389, 579 ~1997!. 9A. Abu Arab and M. Ahlers, Acta Metall. 36, 2627~1988!.
10I. Hurtado, D. Segers, J. Van Humbeck, L. Dorikens-Vanpraet, and C. Dauwe, Scr. Metall. Mater. 33, 741~1995!.
11L. Man˜osa, M. Jurado, A. Gonza`lez-Comas, E. Obrado´, A. Planes, J. Zarestky, C. Stassis, R. Romero, A. Somoza, and M. Morin, Acta Mater.
46, 1045~1998!.
12R. Romero, A. Somoza, M. A. Jurado, A. Planes, and L. Man˜osa, Acta Mater. 45, 2101~1997!.
13T. Hehenkamp, T. Kurschat, and W. Lu¨hr-Tanck, J. Phys. F 16, 981
~1986!.
14J. Van Humbeek, D. Segers, and L. Delaey, Scr. Metall. 19, 477~1985!. 15
J. S. Clark and N. Brown, J. Phys. Chem. Solids 19, 291~1961!. 16
P. Kirkegard, N. J. Pedersen, and M. Eldrup, PATFIT-88 Program, Riso”
M-2740, Riso” National Laboratory ~Roskilde, Denmark, 1989!.
17A simplified version of the calorimeter is described in L. Man˜osa, M. Bou, C. Calles, and A. Cirera, Am. J. Phys. 64, 283~1996!.
18
R. Romero, W. Salgueiro, and A. Somoza, Phys. Status Solidi A 133, 277
~1992!.
19W. Salgueiro, R. Romero, A. Somoza, and M. Ahlers, Phys. Status Solidi A 138, 111~1993!.
20
R. Romero, W. Salgueiro, and A. Somoza, Mater. Sci. Forum 175–178,
497~1995!.
21M. Franz, T. Hehenkamp, J.-E. Kluin, and J. D. McGervey, Phys. Rev. B 48, 3507~1993!.
22H.-E. Schaeffer, Phys. Status Solidi A 102, 47~1987!. 23
H. Fukushima and M. Doshama, J. Phys. F 6, 677~1976!. 24S. Chabik and B. Rozenfeld, Appl. Phys. 25, 143~1981!.
25J. Wolff, A. Broska, M. Franz, B. Ko¨hler, and T. Hehenkamp, Mater. Sci. Forum 255–257, 593~1997!.
26P.-A. Lindgård, J. Phys. III 5, C2~1995!. FIG. 4. Shift in the transition temperature ~triangles!, corrected from the
effect of cycling, and concentration of vacancies~squares!, as a function of aging time at Taging5323 K. Cv has been obtained using mv51.6
31015 s21.
133 J. Appl. Phys., Vol. 85, No. 1, 1 January 1999 Somozaet al.