www.nat-hazards-earth-syst-sci.net/9/1201/2009/ © Author(s) 2009. This work is distributed under the Creative Commons Attribution 3.0 License.
and Earth
System Sciences
An analysis of the evolution of hydrometeorological extremes in
newspapers: the case of Catalonia, 1982–2006
M. C. Llasat1, M. Llasat-Botija1, M. Barnolas1, L. L´opez2, and V. Altava-Ortiz1
1Meteorological Hazards Analysis Team (GAMA), Department of Astronomy & Meteorology, Faculty of Physics, University
of Barcelona, Av. Diagonal 647, 08028 Barcelona, Spain
2Group for Atmospheric Physics, IMARNB, University of Le´on, Spain
Received: 14 November 2008 – Revised: 23 March 2009 – Accepted: 7 July 2009 – Published: 17 July 2009
Abstract. This contribution analyzes the evolution of per-ception of certain natural hazards over the past 25 years in a Mediterranean region. Articles from newspapers have been used as indicator. To this end a specific Spanish journal has been considered and an ACCESS database has been created with the summarized information from each news item. The database includes data such as the location of each specific article in the newspaper, its length, the number of pictures and figures, the headlines and a summary of the published information, including all the instrumental data. The study focused on hydrometeorological extremes, mainly floods and droughts, in the northeast of the Iberian Peninsula. The num-ber of headlines per event, trends and other data have been analyzed and compared with “measured” information, in or-der to identify any bias that could lead to an erroneous per-ception of the phenomenon. The SPI index (a drought index based on standardized accumulated precipitation) has been calculated for the entire region, and has been used for the drought analysis, while a geodatabase implemented on a GIS built for all the floods recorded in Catalonia since 1900 (IN-UNGAMA) has been used to analyze flood evolution. Re-sults from a questionnaire about the impact of natural haz-ards in two specific places have been also used to discuss the various perceptions between rural and urban settings. Results show a better correlation between the news about drought or water scarcity and SPI than between news on floods in Cat-alonia and the INUNGAMA database. A positive trend has been found for non-catastrophic floods, which is explained by decrease of the perception thresholds, the increase of pop-ulation density in the most flood-prone areas and changes in land use.
Correspondence to: M. C. Llasat ([email protected])
1 Introduction
In the past few years there has been a growing interest in climate change and its consequences in the form of natural hazards. Until now, not enough evidence had been gath-ered to confirm a general and significant increase in the fre-quency and intensity of natural hazards. However, it seems that the societal impact of natural disasters is indeed higher now. This fact has been linked to a higher vulnerability, a lower acceptable risk threshold and a higher social percep-tion. Apart from this fact, the last IPCC (2007) points to an increase in extreme values which, in conjunction with the previous considerations, would imply an increase in the nat-ural risks occurrence, like as floods or droughts.
When public perception about natural risks and its evolu-tion are analyzed it is necessary to distinguish between the different factors that could be involved in it (Brilly and Polic, 2005). A factor analysis allows a distinction to be drawn between two main factors: those related to the perception as such (Slovic, 1992, 1997; Slovic and Weber, 2002), and those related to the own natural risk occurrence. Here in turn, risk has to be broken down into hazard and vulner-ability (Varnes, 1984; Renn, 1992; Crozier, 1993; Slovic, 2000; Cardona, 2004; Smith, 2004). Following the UNISDR (United Nations, International Strategy for Disaster Reduc-tion) terminology (2009) the term “hazard” refers to a dan-gerous phenomenon, substance, human activity or condition that may cause loss of life, injury or other health impacts, property damage, loss of livelihoods and services, social and economic disruption, or environmental damage”, while the term “vulnerability” refers to “the characteristics and cir-cumstances of a community, system or asset that make it susceptible to the damaging effects of a hazard”. Depend-ing on the nature of the hazard, people can react to a greater or lesser extent. The vulnerability is proportional to the po-tential damage that could be caused in a specific zone when
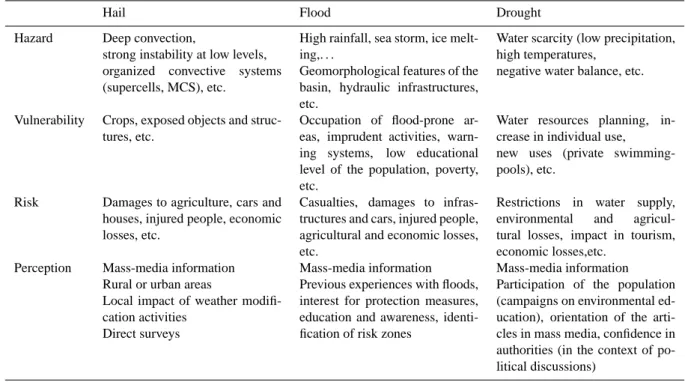
Table 1. Different factors related to hail, floods and droughts, their risk and perception.
Hail Flood Drought
Hazard Deep convection,
strong instability at low levels, organized convective systems (supercells, MCS), etc.
High rainfall, sea storm, ice melt-ing,. . .
Geomorphological features of the basin, hydraulic infrastructures, etc.
Water scarcity (low precipitation, high temperatures,
negative water balance, etc.
Vulnerability Crops, exposed objects and struc-tures, etc.
Occupation of flood-prone ar-eas, imprudent activities, warn-ing systems, low educational level of the population, poverty, etc.
Water resources planning, in-crease in individual use, new uses (private swimming-pools), etc.
Risk Damages to agriculture, cars and houses, injured people, economic losses, etc.
Casualties, damages to infras-tructures and cars, injured people, agricultural and economic losses, etc.
Restrictions in water supply, environmental and agricul-tural losses, impact in tourism, economic losses,etc.
Perception Mass-media information Rural or urban areas
Local impact of weather modifi-cation activities
Direct surveys
Mass-media information Previous experiences with floods, interest for protection measures, education and awareness, identi-fication of risk zones
Mass-media information Participation of the population (campaigns on environmental ed-ucation), orientation of the arti-cles in mass media, confidence in authorities (in the context of po-litical discussions)
the potential risk was triggered, giving rise to a catastrophe. Vulnerability includes exposure, knowledge and risk man-agement. The term “exposure” refers to “People, property, systems, or other elements present in hazard zones that are thereby subject to potential losses” (UNISDR, 2009). Some disciplines (i.e. geology) consider the risk consisting of haz-ard, vulnerability and exposure, independently of each other (Lastoria et al., 2006; Blaikie et al., 1994). In their turn, the individual and social perception are essential in defining the term “risk”, because this term acquires full meaning only in relation with a number of cultural considerations (Burton et al., 1978; Garc´ıa Codr´on and Sili´o Cervera, 2000). From the 1980s, a large number of studies have focused on the fact that the perception of risks is built socially (Beck, 1996; Hoff-man and Oliver-Smith, 2002; Peretti-Watel, 2001). Several authors claim that the social perception of risks and the lev-els of acceptance of these risks are constructed collectively, in much the same way as language or aesthetic judgments (Douglas and Wildavsky, 1982). In consequence, this per-ception will depend on the dominant patterns and beliefs in a particular society, i.e., on its culture. This explains why the perception thresholds with respect to certain risks vary so much from one society to another (Ouarda et al., 1998). When values of a resource (i.e. water) are above the upper perception threshold (i.e. flood) or below the lower percep-tion threshold (i.e. water scarcity) they have negative con-sequences for the population. These situations are usually recorded in newspapers, in people’s memory or in archives.
On the other hand, risks that are constructed socially are experienced differently by different individuals or group of individuals within one particular society, thereby leading to multiple individual perceptions of one and the same event (Oliver-Smith, 2002). Therefore, it is important to consider the scale of normative and subjective values of each indi-vidual. This scale defines, in last term, how the relation-ship person-risk will be. Surveys application is one of the more used methods to obtain such information (Brilly and Polic, 2005). It is interesting to compare this information with “measured information” like that provided by the mete-orological records (Delitala, 2005).
As an example, Table 1 shows some features related to the factors that can act in this risk perception for three hy-drometeorological risks: hail, floods and droughts. Floods, droughts and hail are the most important hydrometeorolog-ical risks in the analyzed region (Llasat-Botija et al., 2006). Floods affected mainly the coastal zone, while hail events can produce strong damages in the western and southern part, where the most important culture areas are placed. However, the impact of these hail events in newspapers is very hetero-geneous and, for this reason, it has not been analyzed in this paper. On the contrary, in order to show the different percep-tion between rural and urban areas, hail has been considered in the perception survey.
Suppose, for instance, an increase in hail risk perception. This increase could be due only to an increase of perception, but not to the actual risk. There are already some previous
studies that argue the case for use of the press to estimate the social perception of natural risks or climate change (Delitala, 2005; Lacey and Longman, 1997; Rowe et al., 2000; Fis-cher, 1998; Llasat-Botija et al., 2007; T`abara, 2008). On the basis of this relationship, this increase in hail risk percep-tion could be caused by an increase of the press coverage of each event. In its turn, press coverage could be influenced by external events such as political declarations, elections, the economic situation or other events (Llasat-Botija et al., 2007). But it could also be related to changes in the sensitiv-ity of the population to certain natural hazards, for instance, as a consequence of a strong campaign related to weather modification by cloud seeding. Both cases would lead the population to think that there was an increase of such natu-ral risk, without taking into consideration the actual change it has undergone. Another possibility could be related to a vulnerability increase. Changes in the kind of crops or in the size of the cultivated area pertaining to a hail-prone region may have brought about a change in the vulnerability factor. Finally, a substantial increase of meteorological situations fa-vorable to hail storms could also have altered the hazard and, consequently, the hail risk and perception.
The objective of this paper is to assess the evolution of the societal perception of floods and droughts through the press in Catalonia (NE Spain), and to relate this information with meteorological/climatic data. A second objective is to evaluate the appropriateness of using the press as indicator of hydrometeorological risk evolution. In order to achieve these objectives, the paper presents the databases used for analysing the evolution of droughts and floods as well as the questionnaire distributed among two different types of population in order to assess the urban and rural compo-nents. After this, the news evolution on floods and droughts is analyzed and compared with the evolution estimated from the flood geodatabase and the Standard Precipitation Index (SPI), respectively, for the period 1982–2006. An in-depth analysis of some flood events and droughts is also undertaken in order to discuss the main factors that can be involved in press coverage.
2 Data and methodology
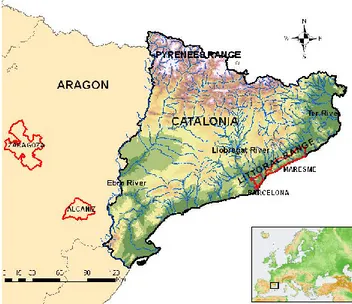
The region of study includes Catalonia and the Ebro Valley (the northeast part of the Iberian Peninsula). To the east, it borders on the Mediterranean Sea, to the north on the Pyre-nees, and to the west on Aragon (Fig. 1). The most signifi-cant topographic features are the Pyrenees, which rise to over 3000 m, the Littoral range and the Pre-littoral system, both running parallel to the coast and rising to higher than 700 m and 1700 m, respectively. The hydrographical network in-cludes small torrential catchments that cause frequent local floods in the towns/cities of the coast, and in major basins such as those of the Llobregat, Ter and Ebro rivers. Some dams built on these rivers act as reservoirs for water
man-Fig. 1. Map of Catalonia and the Ebro Valley Region, showing the
location of the places cited in the text (red) as well as the main catchments (black).
agement as well being able to act on flood lamination. The proximity to the Mediterranean Sea and its complex orogra-phy plays an important role in rainfall and flood production in this region (Llasat, 2009). The climate is characterized on average by two wet seasons (autumn and spring) and two dry seasons (winter and summer). Usually, water scarcity is caused by precipitation deficiency during spring and autumn, although the summer can play a secondary role due to its pre-cipitation contribution to the Pyrenean region.
2.1 News database
A preliminary description of the news database can be found in Llasat-Botija et al. (2007), and the complete one will be published in Llasat et al. (2009). It is an ACCESS database that includes all the news related to natural risks and climate change, starting in 1982 and continuing down to today. These news items are classified following the criteria shown in Ta-ble 2. More than 14 000 news items for the period 1982–2007 have been analyzed and entered into this ACCESS database. From this study, and data from insurance companies, it is concluded that floods are the most important natural hazard in the region. However, factors such as the season of the year, the proximity of the affected region to the capital, topical is-sues at the time and the presence of other important news must be considered when the impact in the press is analyzed. Added to which the average number of headlines per event can be different depending on the kind of risk. For instance, the rate number of headlines/event for topics 1 and 4 is, re-spectively, 5.7 and 6.4 (Llasat-Botija et al., 2007). This fact can be related to the major duration of drought periods and will be discussed in the Conclusions. For this paper, all the
Table 2. Codes used to group the news.
Code Type and description
1 Flood: Heavy rainfalls, floods and landslides caused by rainfalls 2 Wind storms: Wind storm, gale, tornado, hurricane, dust storm 3 Snow and cold: Snowfalls, cold waves, snow avalanches
4 Agrometeorological risks: Forest fires, drought, hail, heat waves, frost 5 Sustainable development: Climate change, pollution
6 Alert chain: Prevention, statistics, alerts, forecasts, training 7 Others: Earthquake, volcanoes
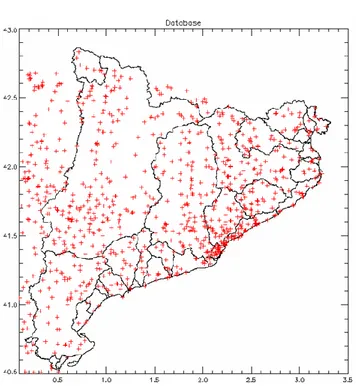
Fig. 2. Map of Catalonia and its surrounding regions showing the
total number of pluviometric stations with monthly data partially or totally available for the period 1948–2007.
news items of types 1 and 4 published by the La Vanguardia daily newspaper for the period 1982–2006 (25 years) were considered. To focus this analysis more closely, floods and droughts were extracted from groups 1 and 4. Other stud-ies that deal with the utilization of Spanish newspapers to evaluate climatic factors can be found in Duce D´ıaz (1995), Anillo and Guti´errez (2006), Hern´andez Varela et al. (2003) and T`abara et al. (2004).
2.2 Flood database
A complete description of the INUNGAMA flood database spanning the 20th century for the whole of Catalonia (NE Spain) can be seen in Barnolas and Llasat (2007a). In synthesis, this database, which has been updated, includes
documentary information (affected areas and damage) and instrumental information (meteorological and hydrological records) for all floods recorded since 1901, from the minor but most frequent ones to the most catastrophic but less fre-quent floods. These data have been organized into a rela-tional database in ACCESS normalized to the third normal form with the aim of being implemented on a Geographical Information System (GIS). A total of 260 flood events were identified for the period 1900–2006. Flash floods are the most frequent cases; they are produced by very convective events of short duration but high intensity, usually associated with mesoscale convective systems and multicell systems (Rigo and Llasat, 2004) that affect the coastal region, where short but torrential rivers drain the Littoral Mountains. Au-tumn is the season that concentrates the highest flood event occurrence in all Catalan regions.
Regarding spatial distribution, the most severely affected areas are located in the northeast of Catalonia and in coastal regions with high population density. The trend analysis has shown a smooth increase in the frequency of floods in the Littoral Region, with a positive slope of two floods per cen-tury at the end of the series. This positive trend is mainly associated with increased vulnerability (greater exposure) as well as changes in land use as a consequence of urbanization and new roads and highways. This increase is not observed in the Pyrenees and inland regions, where no such changes have taken place. These results are consistent with those ob-tained for the longest periods, which show a positive trend for extraordinary floods for the last two centuries but no trend in the case of catastrophic floods (Llasat et al., 2003, 2005). In fact, the population of Catalonia has risen from 5 956 414 in-habitants in 1981 to 7 134 697 inin-habitants in 2006. Besides this, a movement of population towards the coast and outside the capital, Barcelona, has increased the population density in some flood-prone regions (Llasat et al., 2008). This fact will have a strong influence in the press coverage of natural risks that affect the region.
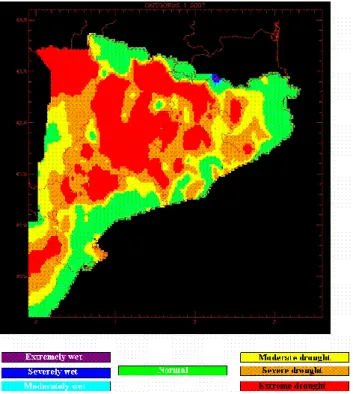
Fig. 3. Map of Catalonia and its surrounding regions showing the
SPI distribution for the month of January 2007.
2.3 Drought database
There is a wide variety of definitions associated with the con-cept “drought” that may or may not take account of all the factors involved in water management. In this study, the con-cept of “drought” will be related to water scarcity due to a negative anomaly of precipitation, and the Standard Precipi-tation Index (SPI) will be used as indicator.
Monthly rainfall data was provided by the Spanish Na-tional Meteorological Institute (INM, currently the Spanish Meteorology Agency, AEMET) as well as the Catalan Me-teorological Service (SMC). On the basis of both sources, it is possible to find more than 850 stations that totally or partially cover the period 1948–2007 (Fig. 2). From their monthly data a pluviometric grid of 0.02◦×0.02◦ has been built for this period, using the kriging methodology. In order to undertake the present work, the series corresponding to the period 1982–2006 was extracted.
Once the monthly precipitation has been built for each pixel it is possible to calculate the SPI for each one of them. The SPI was developed by McKee et al. (1993) and is a drought index based only on standardized precipitation. In this paper a monthly precipitation data set was drawn up for a period of 60 years (1948–2007), and monthly values were aggregated for periods of 12 months using a mobile window of one month. The aggregated series was standardized and fitted to the Gamma function to define the relationship of probability to precipitation. Once the relationship of
prob-Table 3. Hydric regimes resulting from different SPI values.
SPI value Hydric regime
≥2.00 Extremely wet (H3) 1.50 to 1.99 Severely wet (H2) 1.00 to 1.49 Moderately wet (H1) −0.99 to 0.99 Normal (N) −1.00 to −1.49 Moderate drought (S1) −1.50 to −1.99 Severe drought (S2) ≤−2.00 Extreme drought (S3)
ability to precipitation has been established from the historic records, the probability of any observed precipitation data point for the period 1982–2006 is calculated and used along with an estimate of the inverse normal to calculate the precip-itation deviation for a Gaussian probability distribution func-tion. Once a time series of SPI (1982–2006) had been ob-tained for each pixel, the average value was calculated for the entire region, in order to compare it with the press database.
On the basis of the SPI values it is possible to distin-guish seven kinds of situations (Lloyd-Hughes and Saunders, 2002), from wettest to driest (Table 3). Figure 3 shows an example of SPI spatial distribution, corresponding to the last severe drought to have affected Catalonia and that ended in May 2008. Although the coastal region lies within the nor-mal range, most of the river basins that serve most of the population as well as agriculture show extremely dry condi-tions.
2.4 Perception test
In order to have a preliminary estimation of the different per-ception of droughts between rural and urban areas, a ques-tionnaire has been built in the framework of the National Project SEVERUS, devoted to the analysis of heavy rainfalls and hail storms in Catalonia and Aragon. The questionnaire was distributed between the populations of one town and one village, located to the west of Catalonia: Zaragoza (urban area) and Alca˜niz (rural area). Both places are located in the Ebro Valley, and have a similar climate and orography fea-tures to the west of Catalonia (see Fig. 1). The questionnaire included questions about the following items:
– Personal information:
Age range; education; sex; town. – General ideas about storms:
Kinds and effects of storms; meteorological hazards af-fecting their home town; media reliability with respect to weather forecasts; weather forecasts utility; resilience measures and insurance responsibilities; confidence in the scientific knowledge about the physical mechanisms
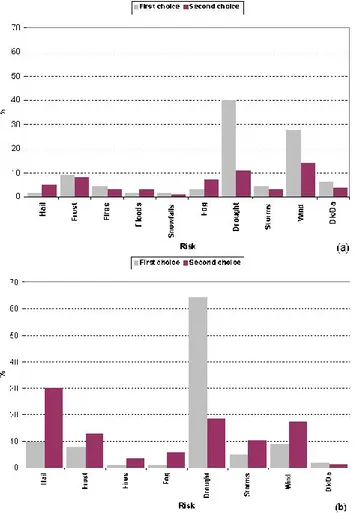
Fig. 4. Importance of meteorological risks as perceived by the
pop-ulation (1st and 2nd), evaluated by conducting questionnaires in
(a) Zaragoza, (b) Alca˜niz.
that cause a storm; degree of potential intervention vis-`a-vis a storm.
– Attitude to risks:
Listening to the weather forecast; source of informa-tion (TV, radio, internet and so on); required time to be warned before the start of a severe storm; personal safety measures that they would adopt if a severe storm was approaching their home; fearful attitude to severe storms.
– Knowledge of their region:
Number and kind of events that have affected their vil-lage/town and its hinterland; perception of damage pro-duced by storms in their village/town; potential climate change impact in their region; zones most affected by natural hazards in their region; preparedness of their re-gion for natural hazards.
This questionnaire was completed by 100 subjects in Alca˜niz and 85 in Zaragoza. Out of the whole population of subjects,
70% were women. This is due partly to the high percentage of women living in rural areas, and partly to the type of sur-vey (telephone interviews). As far as the age range of the in-formants is concerned, the following distribution was found: between 18 and 25 (5.5%), between 25 and 45 (35.3%), be-tween 45 and 70 (43.2%) and over 70 (14.3%). With respect to the educational level, the results are the following: no ed-ucation (8.8%), primary eded-ucation (33.5%), secondary edu-cation (30.6%) and university eduedu-cation (25.8%).
3 Drought perception in rural and urban environments The results of the preliminary perception test show important differences in the perception of meteorological risks between rural and urban environments (Fig. 4). In Zaragoza (urban environment) 40% of the population considers droughts to be the main meteorological hazard, followed by strong winds (28%), and frost (9%). Hailstorms are considered to be an important hazard by only 5%. The interviews conducted in the rural show that droughts are also the hazard most widely perceived as such, with 60% of the total. Next score hail-storms with 10%, and strong winds come next with 9%. In this area storms were mentioned as the second most impor-tant meteorological hazard (30% of the population).
The effects of droughts vary in accordance with the vul-nerability of the population. In rural areas most of the pop-ulation work in jobs related to agriculture and have closer contact with the real need of water for crops, thus being more concerned by the state of rivers and lakes. Small villages in rural areas have relatively small freshwater tanks, and lim-ited supplies from wells and reservoirs for irrigation. As a result, small villages are more vulnerable to meteorological droughts. In contrast, in the cities there is not such a close contact with nature, and as a consequence droughts are only perceived as important after a number of everyday activities are restricted, such as the filling of private swimming-pools, or the irrigation of private gardens, or even restrictions in household water supplies. In despite of this different vulner-ability, droughts are perceived as the more important risk in both towns, while the other risks do not follow a similar dis-tribution. Although it is only a preliminary result, this fact could show a homogeneous perception of droughts in both environments, that probably will lead to a specific impact in the drought coverage given by the newspapers.
4 Flood evolution versus news about floods
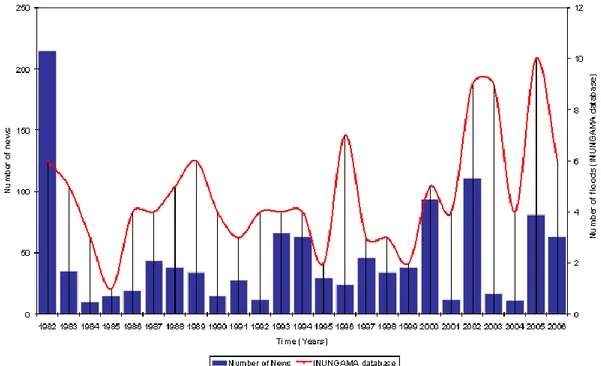
Figure 5 shows a comparison between the number of news items about floods recorded in the press and the number of floods recorded in the INUNGAMA database. The num-ber of news items includes all the headlines about floods recorded in each year; the newspaper for a specific day may have more than one headline for the same event. A flood event is usually reported immediately after the event, but
Fig. 5. Flood evolution estimated from the number of news items and from hydrometeorological and impact information, for the period
1982–2006.
there may be subsequent news about the same event. How-ever, a flood event is characterized by the day (or period of days) on which the flood or heavy rain took place; accord-ingly, two floods affecting two rivers on the same day are considered as the same event. There is not any threshold to select flood events: all those cases that produce a rise in wa-ter level that affects the population are included. Following the classification proposed in Barriendos et al. (2003) and ap-plied to analyse the floods in Catalonia since the 14th century (Llasat et al., 2005; Barnolas and Llasat, 2007b), the consid-ered floods can be ordinary, extraordinary or catastrophic, depending on the damage caused. No systematic flow data can be used due to the specific features of some rivers where no gauges are in place.
In this sense, a clear positive trend of 0.12 flood/year has been found in the flood evolution, mainly conditioned by the last five years and by the increase of ordinary and ex-traordinary floods at the coast (Fig. 6). Indeed, immigrations of population to flood-prone areas located near the coast, as well as the increase of total population and tourism, have led to increased pressure on the territory and higher vulnerability (Llasat et al., 2008). Tingsanchali and Karim (2005) suggest that the vulnerability factor is proportional to population den-sity. Besides the temporary or permanent occupation of the soil near the non-permanent rivers (“wadis”), changes in the landscape have occurred that have affected the geomorpho-logical and hydraulic characteristics of the region. Floods have increased mainly during the late summer season (Au-gust and September) when the maximum concentration of
Fig. 6. Municipalities affected by floods during the period 1982–
2006.
population at the coast occurs and short and local heavy rain-falls occur. This positive trend found for extraordinary and ordinary floods is consistent with this other one obtained for Barcelona city as well as the nearby coastal region over re-cent re-centuries and it is explained by changes in the uses of soil and infrastructural preventive measures as well as the de-crease of the perception threshold (Berga, 1995; Coeur and Lang, 2000; EEA, 2001; Plate, 2002; Barriendos et al., 2003; Llasat et al., 2005; Barrera et al., 2006).
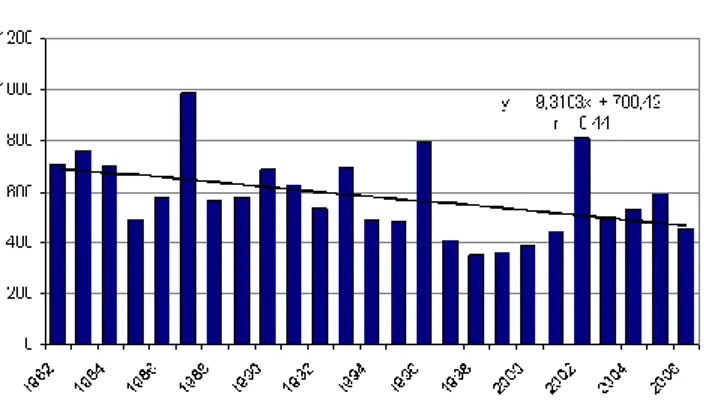
Fig. 7. Annual rainfall evolution in Barcelona for the period 1982–
2006.
The comparison with rainfall evolution corroborates this conclusion. Figure 7 shows the annual rainfall evolution for Barcelona city between 1982 and 2006; it can be dis-cerned that neither annual precipitation nor autumn precipi-tation have undergone any increase. On the contrary, a neg-ative trend has been found as a consequence of the last dry period, although with a very low correlation (r<0.4). This negative trend is also found when the evolution of annual rainfall is analysed for other cities located in the Maresme region (Fig. 8). Although in this case only data for the period 1996–2007 were available, the two anomalous rainy years 1996 and 2002 are clearly identified in Fig. 7. The year 1996 was extraordinarily wet throughout Catalonia, and being the first year of the series it leads to a negative trend that cannot be attributed currently to climate change. However, analysis of the maximum daily rainfall as well as the number of rain-fall days for the Maresme region does not show any trend (Fig. 9), which fact points to the existence of factors other than precipitation as a cause of this flood increase. This lack of positive trend in the annual rainfall in this region has been also found for longer periods than analysed here (Barrera et al., 2006; Barrera and Llasat, 2004; Gonzalez-Hidalgo et al., 2008).
The press news evolution shown in Fig. 5 does not show any clear trend. The large number of news items correspond-ing to the year 1982 is significant. This major coverage is consistent with the facts: between 6 and 9 November 1982, the most catastrophic flood event recorded in the last 50 years had occurred (although in terms of casualties the worst was the September 1962 event). This event affected the entire Northeastern part of Spain, Andorra and the Southeast of France. More than 500 mm were recorded in 24 h in the Pyre-nees region and rivers such as the Llobregat and the Segre, in Spain, or the Tˆet and the Tech in France overflowed (Llasat, 2009). Severe landslides as well as wind storms also char-acterized this event. A total of 184 news items were col-lected for it (from a total of 215 news items corresponding to 10 events recorded in 1982), a figure that is far from the 94
Fig. 8. Annual rainfall evolution in Arenys de Munt (Maresme
re-gion) for the period 1996–2007.
Fig. 9. Annual maximum daily rainfall evolution (bars) and
num-ber of rainfall days evolution (continuous line) in Arenys de Munt (Maresme region) for the period 1996–2007.
news and 111 flood news items recorded for the years 2000 and 2002, respectively. The year 2000 produced two catas-trophic flood events in Catalonia: the June flash-flood that mainly affected the Llobregat basin, with a maximum rain-fall of 220 mm in less than 6 h (Llasat et al., 2003), and the October flood event that affected the south of Catalonia and the eastern side of Spain, with more than 319.2 mm/h. The case of the year 2002 is a clear example of an extraordinary flood event with considerable social impact (Llasat, 2004). Between 8 and 10 October 2002, flooding occurred in a very densely populated area near the mouth of the Llobregat River. The rainfalls reached a maximum of 196.5 mm/24 h and also affected the highway and the airport. A total of 60 news items were published by La Vanguardia newspaper in rela-tion to this event, a figure very close to the 59 news items published about the catastrophic flood of June 2000. Again, between 9 and 12 April 2002 an extraordinary flood event affected the Northeastern part of Catalonia, with a maximum of 321.7 mm in 24 h, though in this case the same newspa-per carried only 13 headlines. These three cases serve to illustrate the discussion about hazard, vulnerability, risk and perception initiated in the introduction:
Fig. 10. Comparison between the flood events identified in the
IN-UNGAMA database and the number of events obtained following the printed news media.
– The November 1982 flood event affected a broad region and was provoked by a very exceptional meteorological situation due to its extension, though the floods that oc-curred had return periods of less than 50 years in some places (high hazard level). Unlike in the case of An-dorra where it affected the most important cities, in the case of Catalonia it mainly affected a lightly populated region (low social vulnerability). It arose in the frame-work of an economic depression, a month after a catas-trophic flood that had affected the east of Spain (mainly the Valencia region) and on the same date as, one year later (6–8 November 1983), another flood event affected Catalonia; these factors favoured the number of news items and raised its social perception.
– The April 2002 flood event affected the region that has the highest frequency of rainfall events above 200 mm (high heavy rainfall hazard), where tourism, services and agriculture are the most important eco-nomic sources, but with a low density of population (moderate vulnerability). In contrast with the damage produced, press coverage was low (low social percep-tion), probably as a consequence of the high frequency of this kind of events in this region and the adaptation of the population to them.
– The October 2002 flood event was produced by a typical situation associated with local heavy rainfalls in autumn in Catalonia (moderate hazard), but in one of the most vulnerable zones of Catalonia due to the high density of population, industries and agriculture (great vulnerabil-ity). At the same time, a political confrontation about the new airport in the affected region favoured the high press coverage (high perception). The events of the year 2002 did not leave any casualties, whereas more than 25 people died as a consequence of the floods recorded in November 1982. The existence of casualties is another fact that triggers the number of news items.
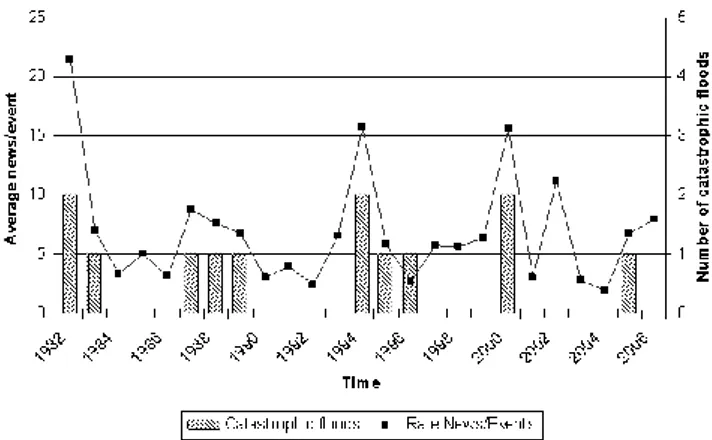
Fig. 11. Comparison between the average number of news items
per event and catastrophic floods for the period 1982–2006.
Bearing in mind the above comments, it is possible to explain the low correlation found between the number of headlines and the number of flood events shown in Fig. 5 (ρ=0.396, significant at the 95% confidence level using the Spearman test). Figure 10 shows the correlation between the flood events mentioned in the newspapers in comparison with those recorded in the INUNGAMA database. A correla-tion of ρ=0.462 (significant at the 99% confidence level) has been found, as well as an overestimation of the number of events by the press (the mass-media frequently identify high rainfalls with floods). Finally, a comparison between the yearly average number of news items/event and catastrophic floods has been made (Fig. 11). All the years with catas-trophic floods have recorded an average of above five news items/event. The years 1982, 1994 and 2000 have the most catastrophic events recorded; this fact is in accordance with the yearly press coverage.
5 Drought evolution versus news evolution
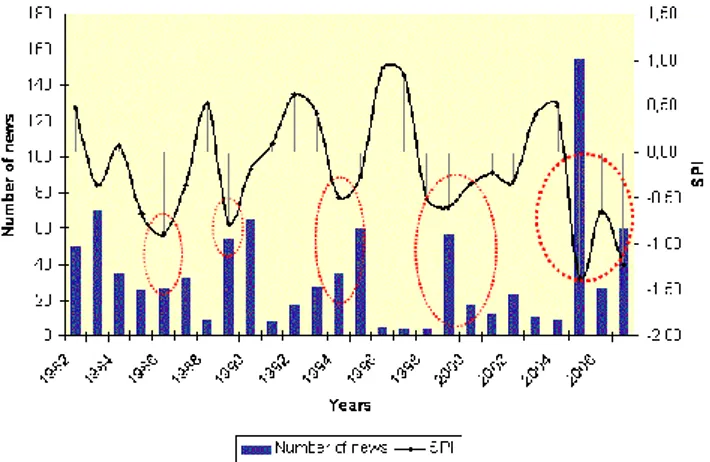
In order to obtain a representative drought index to compare with the news coverage, an averaged SPI value for all Cat-alonia and for each month has been calculated. Figure 12 shows the correlation between the number of news items and the SPI index for the last four years, characterized by some months with very dry conditions. The figure also includes the first months of 2008, to show the extraordinary rise of news as a consequence of two facts: the changing political decisions about the water supply to the Barcelona city had the drought persisted, and the general elections in Catalo-nia. When only the period January 2004–December 2007 is considered, a good correlation of −0.60 (significant at the 99.9% confidence level) is obtained between the monthly se-ries. This correlation further improves when only dry years are considered. For instance, the correlation for the year 2005 is −0.877 (99.9% confidence level).
Fig. 12. Evolution of the monthly number of news items and SPI
for the period January 2004–April 2008.
These good correlations slightly decrease to ρ=−0.538 (99.9% confidence level) when yearly values of SPI and news are compared for the period 1982–2007 (Fig. 13), charac-terized by both rainy and dry periods. A severe drought is identified by the two sources in the year 2005. The moder-ate droughts of 1998–1999 and 1989 are also well correlmoder-ated. On the other hand, the moderate droughts of 1986 and 1994 are not so well identified by the press. Both years had a com-mon factor: the catastrophic forest fires that burnt down more than 50 000 hectares, and particularly on Montserrat Moun-tain, the leading shrine of Catalonia. The drought story faded then, to be replaced by the forest-fire headlines.
6 Discussion and conclusions
Traditionally, press news has been used to build risk maps (Guzzetti and Tonelli, 2004; Petrucci and Polemio, 2003) or to analyse the evolution of certain natural hazards, mainly when not enough instrumental data were available. The present study has demonstrated that press news can be used as estimator of flood or drought evolution, though bearing in mind some factors that can generate a bias or an anomalous perception. The correlation between headlines and SPI and floods is close to −0.6 (period 1982–2007) and 0.4 (period 1982–2006) respectively with a level of confidence above 95%. The drought correlation improves during dry years (0.88), while the flood correlation is better when the num-ber of events identified from news and those from the IN-UNGAMA database are compared (0.46). This correlation could be improved if the news published in specific peri-ods of time after the event would be considered (i.e. only the news published one month after the flood event). This anal-ysis will be taking into account in future work. This better correlation for droughts than for floods is due to the differ-ent temporal and spatial scales for the two risks. Floods are the most common natural hazard in the region of study; their economic and human impact, as well as their total press cov-erage are also the most significant (Llasat-Botija et al., 2006).
Fig. 13. Evolution of the annual number of news items and SPI in
Catalonia for the period 1982–2007.
This high frequency leads to less news coverage per event (Llasat-Botija et al., 2007). Besides this, the most frequent floods in Catalonia are local flash-floods and their impact in the news coverage is stronger or weaker depending on the accompanying socio-political context, the existence of asso-ciated casualties, the standard of living of the affected region or its strategic location (airport, etc.). On the other hand, droughts affected a wider region and lasted for a longer time. The results of a preliminary perception survey have shown that the drought perception is strong, independently of a ru-ral or urban environment, a fact that might also explain the better press coverage. However, in order to assure this last conclusion, this perception test is going to be applied to other towns in Catalonia.
The use of press news is also a good indicator to assess the social perception of natural risk, and particularly floods and droughts. In turn, social factors can have an impact on the press coverage of any natural risk or disaster. In this sense, lack of water is a natural risk with increasing social implica-tions. The ATLL (“Aguas del Ter y Llobregat”) with respect to the metropolitan area of Barcelona forecasts a deficit of water of around 350 hm3/year in 2025. This deficit (65% of the current use) would be generated by the following causes:
1. population growth of 11%
2. increase in use per inhabitant of 17%
3. population displacement towards areas farther away from the city center
4. decrease of 35% of the water resources currently avail-able due to pollution
Water shortage is conditioned by several factors such as droughts, changes in the organization and distribution of wa-ter usage and changes in the societal perception of droughts. The high number of articles in the regional press reflects
a growing sensitivity to the lack of water, hydrological re-sponses to changes in the basin, changes in the social inter-pretation of the uses of water resources, and the use of this issue as a factor in political confrontation. Impacts and the vulnerability when facing a drought vary greatly from one region to another. This variation is probably greater than the physical-spatial variation of rain patterns due to regional dif-ferences in the ways water uses are organized and the cultural perception. Usually droughts are more readily perceived in rural areas with economies strongly dependent on agricul-ture. The perception of the urban population, on the other hand, is mainly linked with the mass-media coverage, which in its turn usually increases when restrictive measures may be applied in urban areas. Finally, the rising awareness about climate change and its potential impacts is driving to a ma-jor press coverage on natural risks that could be involved in this climate change, a major sensibility about these problems and a positive trend in the total number of news about these topics (Llasat and Llasat-Botija, 2008).
Acknowledgements. This research was supported by the Sixth Framework Programme European Commission FLASH project (no. 036852) as well as the Spanish project SEVERUS (CGL2006-13372-CO2-02). The authors thank METEOCAT (Catalan Meteorological Service) and AEMET (Spanish Meteorological Meteorology Agency) for the rainfall data. Thanks to the Forest Fires Prediction Service for the information provided. The authors would also like to thank Ana Rodr´ıguez, Aitor Atencia, Albert Zaragoza and J. Corominas, for their collaboration, and Thomas Molloy for English language revision.
Edited by: U. Ulbrich
Reviewed by: J. Krywkow and two other anonymous referees
References
Anillo, C. and Guti´errez, L.: Temporales de nieve en Cantabria (2004–2005), in: Estudio de la repercusi´on social a trav´es de la prensa, Clima, sociedad y medio ambiente, Publicaciones de la Asociaci´on Espa˜nola de Climatolog´ıa (AEC), 733–743, 2006. Barnolas, M. and Llasat, M. C.: A flood geodatabase and its
clima-tological applications: the case of Catalonia for the last century, Nat. Hazards Earth Syst. Sci., 7, 271–281, 2007a,
http://www.nat-hazards-earth-syst-sci.net/7/271/2007/.
Barnolas, M. and Llasat, M. C.: Metodolog´ıa para el estudio de in-undaciones hist´oricas en Espa˜na e implementaci´on de un SIG en las cuencas de Ter, Segre y Llobregat, Ministerio de Fo-mento, ISBN: 978-84-7790-449-0, NIPO: 163-07-016-0, 264 pp., 2007b.
Barriendos, M., Coeur, D., Lang, M., Llasat, M. C., Naulet, R., Lemaitre, F., and Barrera, A.: Stationarity analysis of historical flood series in France and Spain (14th–20th centuries), Nat. Haz-ards Earth Syst. Sci., 3, 583–592, 2003,
http://www.nat-hazards-earth-syst-sci.net/3/583/2003/.
Barrera, A. and Llasat, M. C.: Evoluci´on regional de la precip-itaci´on en Espa˜na en los ´ultimos 100 a˜nos. Ingenier´ıa Civil, 135, 105–114, 2004
Barrera, A., Llasat, M. C., and Barriendos, M.: Estimation of ex-treme flash flood evolution in Barcelona County from 1351 to 2005, Nat. Hazards Earth Syst. Sci., 6, 505–518, 2006,
http://www.nat-hazards-earth-syst-sci.net/6/505/2006/.
Beck, U.: Teor´ıa de la sociedad del riesgo, in: Las consecuencias perversas de la modernidad. Modernidad, contingencia y riesgo, Josexto Beriain, Anthropos, Barcelona, 201–222, 1996. Berga, L.: La problem´atica de las inundaciones en Catalunya, in: El
Agua en Catalunya, edited by: Berga, L., Barcelona, 237–256, 1995.
Blaikie, P., Cannon, T., Travis, I., and Wisner, B.: At Risk: Natural Hazards, People’s vulnerability and Disasters, New York, Rout-ledge, 1994.
Brilly, M. and Polic, M.: Public perception of flood risks, flood forecasting and mitigation, Nat. Hazards Earth Syst. Sci., 5, 345– 355, 2005,
http://www.nat-hazards-earth-syst-sci.net/5/345/2005/.
Burton, I., Kates, R. W., and White, G. E.: The environment as hazard, Oxford University Press, 239 pp., 1978.
Cardona, O. D.: The Need for Rethinking the Concepts of Vul-nerability and Risk from a Holistic Perspective: A Necessary Review and Criticism for Effective Risk Management, in: Map-ping vulnerability: disasters, development and people, edited by: Bankoff, G., Frerks, G., and Hilhorst, D., Earthscan, London, 2004.
Coeur, D. and Lang, M.: L’information historique des inondations: l’histoire ne donne-t-elle que des lec¸ons?, La Houille Blanche, 2, 79–84, 2000.
Crozier, M. J.: Management Issues Arising from Landslides and Related Activity, New Zealand Geographer, 49(1), 35–37, 1993. Delitala, A. M. S.: Perception of intense precipitation events by public opinion, Nat. Hazards Earth Syst. Sci., 5, 499–503, 2005, http://www.nat-hazards-earth-syst-sci.net/5/499/2005/.
Douglas, M. and Wildavsky, A.: Risk and culture. An Essay on the Selection of Technological and Environmental Dangers, Univer-sity of California Press, Berkeley, Los ´Angeles, 1982.
Duce D´ıaz, E.: Riesgos clim´aticos y la prensa: los efectos de los fen´omenos meteorol´ogicos sobre la agricultura en Espa˜na, en el diario La Vanguardia, entre 1985 y 1990. Situaciones de Riesgo Clim´atico en Espa˜na, Publicaciones de la Asociaci´on Espa˜nola de Climatolog´ıa (AEC), 223–232, 1995.
European Environment Agency: Sustainable water use in Eu-rope, Part 3: Extreme hydrological events: floods and droughts, Copenhagen, 2001.
Fischer, H. W.: Response to disaster: Fact versus Fiction and its perpetuation: The sociology of disasters, New York, University Press of America, 1998.
Garc´ıa Codr´on, J. C. and Sili´o Cervera, F.: Riesgos Naturales en los Andes: Cambio Ambiental, Percepci´on y Sostenibilidad, Bolet´ın de la A.G.E., 30, 69–84, 2000.
Gonzalez-Hidalgo, J. C., Lopez-Bustins, J. A., Stepanek, P., Martin-Vide, J., and de Luis, M.: Monthly precipitation trends on the Mediterranean fringe of the Iberian Peninsula during the second-half of the twentieth century (1951–2000), Int. J. Climatol., avail-able online, doi:10.1002/joc.1780, 2008.
Guzzetti, F. and Tonelli, G.: Information system on hydrological and geomorphological catastrophes in Italy (SICI): a tool for managing landslide and flood hazards, Nat. Hazards Earth Syst. Sci., 4, 213–232, 2004,
http://www.nat-hazards-earth-syst-sci.net/4/213/2004/.
Hern´andez Varela, L., Lozano Valencia, M. A., and Soleto Garc´ıa, C.: Estudio de los acontecimientos meteorol´ogicos extraordinar-ios en la comunidad aut´onoma del Pa´ıs Vasco (1870–1954) a trav´es de la prensa, Investigaciones Geogr´aficas, 30, 165–180, 2003.
Hoffman S. and Oliver-Smith, A.: Catastrophe and Culture. The Anthropology of Disaster, School of American Research-James Currey Ltd., Santa Fe, Oxford, 2002.
IPCC: Climate Change 2007, Impacts, Adaptation and Vulnerabil-ity, Cambridge Univ. Press, 986 pp., 2007.
Lacey, C. and Longman, D.: The press as public educator. Cul-tures of understanding, culCul-tures of ignorance, University of Lu-ton Press, LuLu-ton, 1997.
Lastoria, B., Simonetti, M. R., Casaioli, M., Mariani, S., and Mona-celli, G.: Socio-economic impacts of major floods in Italy from 1951 to 2003, Adv. Geosci., 7, 223–229, 2006,
http://www.adv-geosci.net/7/223/2006/.
Llasat, M. C.: La vuln´erabilit´e en Catalogne et la perception sociale, La Houille Blanche, 6, 71–75, 2004.
Llasat, M. C.: High magnitude storms and floods, in: The Physical Geography of the Mediterranean, J.C. Woodward, Oxford Uni-versity Press, Oxford, 513–540, 2009.
Llasat, M. C., Barriendos, M., Barrera, A., and Rigo, T.: Floods in Catalonia (NE of Spain) since the 14th Century. Climatological and meteorological aspects from historical documentary sources and old instrumental records, Special Issue of J. Hydrol., Appli-cations of palaeoflood hydrology and historical data in flood risk analysis, 313, 32–47, 2005.
Llasat, M. C., L´opez, L., Barnolas, M., and Llasat-Botija, M.: Flash-floods in Catalonia: the social perception in a context of changing vulnerability, Adv. Geosci., 17, 63–70, 2008,
http://www.adv-geosci.net/17/63/2008/.
Llasat, M. C., L´opez, L., and Llasat-Botija, M.: Social perception of floods in northeastern Spain through press data, Nat. Hazards Earth Syst. Sci., in review, 2009.
Llasat, M. C. and Llasat-Botija, M.: Climate change and the per-ception of the risk of flooding in Catalonia, in: Public perper-ception and policy of climate change in Catalonia, edited by: T`abara, J. D., CADS, Barcelona, 55–69, 2008.
Llasat, M. C., Rigo, T., and Barriendos, M.: The ‘Montserrrat-2000’ flash-flood event: A comparison with the floods that have oc-curred in the Northeastern Iberian Peninsula since the 14th Cen-tury, Int. J. Climatol., 23, 453–469, 2003.
Llasat-Botija, M., L´opez, L., and Llasat, M.C.: Percepci´on social de los riesgos naturales en Catalu˜na a partir de la informaci´on de prensa. Clima, sociedad y medio ambiente, Publicaciones de la Asociaci´on Espa˜nola de Climatolog´ıa (AEC), Serie A, 5, 777– 786, 2006.
Llasat-Botija, M., Llasat, M. C., and L´opez, L.: Natural Hazards and the press in the western Mediterranean region, Adv. Geosci., 12, 81–85, 2007,
http://www.adv-geosci.net/12/81/2007/.
Lloyd-Hughes, B. and Saunders, M. A.: A drought climatology for Europe, Int. J. Climatol., 22, 1571–1592, 2002.
McKee, T. B., Doesken, N. J., and Kleist, J.: The relationship of drought frequency and duration to time scales. Eight Conference on Applied Climatology, 17–22 January, Anaheim, California, 1993.
Oliver-Smith, A.: Theorizing Disasters. Nature, power and Cul-ture?, in: Catastrophe and Culture. The Anthropology of Dis-aster, edited by: Hoffman, S. M. and Smith, O., School of Amer-ican Research-James Currey Ltd., Santa Fe y Oxford, 23–47, 2002.
Ouarda, T. B. M. J., Rasmussen, P. F., Bobee, B., and Bernier, J.: Use of historical information in hydrologic frequency analysis, Rev. Sci. Eau/J. Water Sci., 11, suppl., 41–49, 1998.
Peretti-Watel, P.: Sociologie du risque, A. Colin, Paris, 2001. Petrucci, O. and Polemio, M.: The use of historical data for the
char-acterisation of multiple damaging hydrogeological events, Nat. Hazards Earth Syst. Sci., 3, 17–30, 2003,
http://www.nat-hazards-earth-syst-sci.net/3/17/2003/.
Plate, E. J.: Flood risk and flood management, J. Hydrol., 267, 2– 11, 2002.
Renn, O.: Concepts of risk: a Classification, in: Social Theories of Risk, edited by: Krimsky, S. and Golding, D., Praeger, Westport, 1992.
Rigo, T. and Llasat, M. C.: A methodology for the classification of convective structures using meteorological radar: Application to heavy rainfall events on the Mediterranean coast of the Iberian Peninsula, Nat. Hazards Earth Syst. Sci., 4, 59–68, 2004, http://www.nat-hazards-earth-syst-sci.net/4/59/2004/.
Rowe, G., Frewer, L., and Sj¨oberg, L.: Newspaper reporting of haz-ards in the UK and Sweden, Public understand, Science, 9, 59– 78, 2000.
Slovic, P.: Perception of risk: reflections on the psychometric paradigm, in: Social theories of risk, edited by: Krimsky, S. and Golding, D., New York, Praeger, 117–152, 1992.
Slovic, P.: Perception of risk, Science, 236, 280–285, 1997. Slovic, P.: Perception of Risk, in: The perception of risk, edited by:
L¨ofstedt, R. E., Earthscan, London, 220–315, 2000.
Slovic, P. and Weber, E. U.: Perception of Risk posed by extreme events. In: Risk Management strategies in an Uncertain World, Palisades, New York, 12–13 April 2002.
Smith, K.: Environmental hazards: Assessing risk and reducing dis-aster, Routledge, London, New York, 306, 2004.
T`abara, J. D. (Coordinator): Public perception and policy of climate change in Catalonia, J. David T`abara, CADS, Barcelona, 108 pp., 2008.
T`abara, J. D., Costej`a, M., and Woerden, F.: Las culturas del agua en la prensa espa˜nola. Los marcos culturales en la comunicaci´on sobre el Plan Hidrol´ogico Nacional, Paper 73, 153–179, 2004. Tingsanchali, T. and Karim, M. F.: Flood hazard and risk analysis
in the southwest region of Bangladesh, Hydrol. Processes, 19, 2055–2069, 2005.
UNISDR: UNISDR Terminology on Disaster Risk Reduc-tion, available at: http://www.unisdr.org/eng/terminology/ terminology-2009-eng.html, 2009.
Varnes, D. J.: Landslides hazard zonation: a review of principles and practice, UNESCO, Paris, 63, 1984.