1
A 3D measurement of the offset in paleoseismological studies
Marta Ferrater1, Anna Echeverria1, Eulàlia Masana1, José J. Martínez-Díaz2, Warren D. Sharp3
1
RISKNAT Group. GEOMODELS. Departament de Geodinàmica i Geofísica, Facultat de Geologia, Universitat de Barcelona, c/ Martí i Franquès, s/n, 08028 Barcelona, Spain.
2
Departamento de Geodinamica, Universidad Complutense, Instituto de Geociencias IGEO (UCM, CSIC), 28040 Madrid, Spain
3
Berkeley Geochronology Center, Berkeley, CA 94709, USA Email: [email protected]
ABSTARCT
The slip rate of a seismogenic fault is a crucial parameter for establishing the contribution of the fault to the seismic hazard. It is calculated from measurements of the offset of linear landforms, such channels, produced by the fault combined with their age. The three-dimensional measurement of offset in buried paleochannels is subject to uncertainties that need to be quantitatively assessed and propagated into the slip rate. Here, we present a set of adapted scripts to calculate the net, lateral and vertical tectonic offset components caused by faults, together with their associated uncertainties. This technique is applied here to a buried channel identified in the stratigraphic record during a paleoseismological study at the El Saltador site (Alhama de Murcia fault, Iberian Peninsula). After defining and measuring the coordinates of the key points of a buried channel in the walls of six trenches excavated parallel to the fault, we a) adjusted a 3D straight line to these points and then extrapolated the tendency of this line onto a simplified fault plane; b) repeated these two steps for the segment of the channel in the other side of the fault; and c) measured the distance between the two resulting intersection points with the fault plane. In doing so, we
2
avoided the near fault modification of the channel trace and obtained a three-dimensional measurement of offset and its uncertainty. This methodology is a substantial modification of previous procedures that require excavating progressively towards the fault, leading to possible underestimation of offset due to diffuse deformation near the fault. Combining the offset with numerical dating of the buried channel via U-series on soil carbonate, we calculated a maximum estimate of the net slip rate and its vertical and lateral components for the Alhama de Murcia fault.
Keywords: 3D offset, paleoseismological trenches, adjust 3D line, strike-slip, buried
channel
1. Introduction
One of the fundamental parameters used to characterize the seismic potential of a fault is its net slip rate, as fast moving faults produce earthquakes more frequently than slow faults (e.g. Masana et al., 2001; Liu-Zeng et al., 2006; Rockwell et al., 2009). In strike-slip faults, the strike-slip rate may be obtained from the offset of a linear feature (not necessarily straight linear) that crosses the fault (such as a channel, a limit of an alluvial fan, fluvial terrace risers, etc.) whose age is constrained (e.g. Gold et al., 2011; Salisbury et al., 2012; Frankel et al., 2007; Van der Woerd et al., 2002; Hall et al., 1999; Wesnousky et al., 1991). Channels are commonly used because they are widespread in the landscape. Moreover, in a simplified way, their intersection with the fault is a point, yielding a unique three-dimensional (3D) restitution (and thus a unique 3D offset) between the two correlated segments of the channel (one in each block of the fault; in
3
the methodological part of this paper, we use “fault block” to refer to either the hanging or the foot wall of a fault). Paleoseismological studies use two different approaches to measure the channel offsets: 1) surface analysis (using tectonic geomorphology) and 2) subsurface analysis of buried stratigraphic sequences in which the offset of a buried channel is estimated (using 3D trenching). These two approaches tend to underestimate the net offset because they often measure only the lateral component of the offset (e.g. Rittase et al., 2014; Liu-Zeng et al., 2006; Chevalier et al., 2016; Cowgill, 2007; Gold et al., 2011).
In the geomorphological approach, the offset measurement takes into account the far-field tendency of a channel and projects it into the fault (Wallace, 1968; Sieh, 1978; Salisbury et al., 2012; Zielke et al., 2012; Haddon et al., 2016). In this case, the precise morphology of the channel near the fault is not important. Different methods are used to define the general trending of the channel (or the terrace raisers associated with it) and project this tendency onto the fault plane (Van der Woerd et al., 2002; Cowgill, 2007; Gold et al., 2011; Ferrater et al., 2015a). Zielke and Arrowsmith (2012) created a Graphical User Interface (GUI) for Matlab (Lateral Displacement Calculator, LaDiCaoz) updated recently (LaDiCaoz_v2; Zielke et al., 2015; Haddon et al., 2016) which measures the offset based on the perpendicular profile and the general trending of the channel.
In contrast, the offset of buried paleochannels identified in trenches is measured directly next to the fault by excavation of progressive exposures (examples of 3D trenches in McCalpin et al., 1996). A long trench is usually dug parallel to the fault in each side to define the target channel and is progressively expanded towards the fault along the channel feature to expose the piercing points on the fault plane. This technique allows
4
measurement of the lateral offset of one (e.g. Wesnousky et al., 1991) or more channels (e.g. Hall et al., 1999; Liu et al., 2004; Liu-Zeng et al., 2006; Marco et al., 2005). Zooming too much into the fault area, as is the case in trenching studies, may underestimate the offset owing to: 1) the possible distributed deformation next to the fault (i.e. not a unique fault line but different secondary faults which may be separated several meters or more from the fault), or 2) the smoothing of the erosive path of the channel within time since materials across the fault are easily eroded (Ouchi, 2004). In this study, we adapted the geomorphological approach to project the three-dimensional far-field trend of a buried paleochannel onto the fault. Our aim was to avoid underestimation of the net offset produced by disregarding 1) the vertical component of the fault, and 2) near-fault modifications of the channel course (Huang, 1993). In the first part of the paper, we provide a group of modified scripts (Supplementary material, OffsetMeasurement3D) based on Matlab language to automate the calculation of the net, lateral and vertical offsets of buried channels. The proposed methodology includes: a) the acquisition of the coordinates of the points belonging to a buried channel feature; b) the adjustment of 3D straight lines to the selected points; c) the calculation of the intersection points between these lines and the fault; and d) the measurement of the net, lateral and vertical offsets and their uncertainties. The main advantage of these scripts is that they allow assessing the general three-dimensional trending of a likely irregular feature whose exact direction is unknown. In the second part, we apply this method to a 3D paleoseismic trenching study in the seismogenic Alhama de Murcia fault (Southeastern Spain; Martínez-Díaz et al 2003; Masana et al 2004; Ortuño et al 2012), where we identified a buried channel on both sides of the fault. Slip rate calculation of this fault represents a paleoseismological
5
challenge, as 1) the ratio between its lateral and vertical components is unknown and, 2) previous estimations of the slip rate contain large uncertainties.
2. Methodology
The proposed method of offset determination consists of five steps: 1) trench design and excavation, 2) data acquisition, 3) computation of the piercing points and 4) estimation of the uncertainties, and, 5) calculation of the offset value. This approach is trustworthy for channels with low sinuosity or for channels whose sinuosity wavelengths are small, i.e. those cases where a straight line may be adjusted to the channel shape.
2.1.Trenching survey
At least one trench dug perpendicular to the fault is needed to locate the fault. After defining the fault position and its characteristics (orientation, dip and fault zone width), two trenches parallel to the fault, one in each side of the fault, are needed to identify the target channel in the stratigraphic sequence. A minimum of one additional parallel trench is required on each side to yield enough points for the analysis along each piercing line. In this way, the channel should be identified in the sedimentary record in two trenches per fault block, i.e. total of eight trench walls.
2.2.Data acquisition
A channel can be simplified into a line (not indispensable to be straight) on a small scale but is more complex at a detailed scale. The channel bed is curved and may be decomposed into an infinite number of lines, including the channel margins, the channel thalweg, and the lateral margins of distinctive depositional units that fill the channel (Fig. 1A). Henceforth, straight lines are specified in the text, otherwise lines may present some sinuosity. In paleoseismology, a piercing element (a line) is a feature that used to be continuous but has been offset by fault activity (Fig. 1B). Every linear
6
channel feature constitutes a piercing line. The intersection between a piercing line and the fault plane defines a piercing point, whereas the intersection of every linear (not necessarily straight) channel feature with the trench wall is a reference point. Thus, every trench wall exposes a reference point belonging to each piercing line (Fig. 1B). For at least two trenches on both sides of the fault, we identify one reference point for each channel feature (Fig. 1B). In the field, we survey the coordinates (x, y and z in UTM coordinates) of every reference point together with their epistemic uncertainty. The epistemic uncertainty refers to the incertitude when locating the exact position of the reference points, as channel bed may be smooth and the curvature of the thalweg or the margins very lax. We assume that the uncertainty values in x and y are the same. Thus, we decompose the horizontal uncertainty into two identical values. We group all reference points belonging to the same channel feature on each fault block (margins or thalweg) in a .txt file (Supplementary material, OffsetMeasurement3D). This file has six columns (x, y, z, uncertainty in x, uncertainty in y and uncertainty in z) and as many rows as reference points for every channel feature that is identified. The fault plane file is a .txt file with four columns, one for each parameter of the general equation for a three-dimensional plane (Ax+By+Cz+D = 0).
8
Figure 1. Theoretical assumptions applied in the methodological workflow. A) Nomenclature of channel features (reference points in section); B) nomenclature of all the elements intervening in space (reference points, piercing lines and piercing points), and their situation in the ideal case study; C) sketch of the resulting piercing lines and channel cross-sections when the channel is slightly sinuous, in this case the offset of the piercing point pairs differs from each other; and D) schema of how the uncertainties are calculated by projecting them onto the fault: hundreds of random possible piercing lines within the area of the individual reference point uncertainties are projected against the fault.
2.3.Piercing point calculation
Channel exposures are not identical in all trench walls, which differ in sectional shape due to channel sinuosity (Fig. 1C). This results in reference points that are not perfectly aligned. The 3D straight line that best adjusts to the all identified reference points in each side of the fault is the line that represents the average orientation of each channel section. Accordingly, this straight line (representing the trending of the channel feature) is projected onto the fault. We obtain the xyz location of every piercing point by calculating the intersection between the fault (simplified as a plane) and the averaged piercing line (Supplementary material, OffsetMeasurement3D).
2.4.Determination of the uncertainties
To calculate the uncertainty of each piercing point location, we assume the uncertainty of the fault plane simplification to be negligible in comparison to the reference points coordinates. Thus, we focus on the epistemic errors associated with the acquisition of the points. We apply the statistical Monte-Carlo method to calculate the piercing points for a combination of hundreds of random possible straight lines that can be adjusted within the limits of the uncertainty ellipse of the reference point (Fig. 1D). We use a normal distribution of the random points within the uncertainty ellipse to calculate the possible random piercing straight lines (Supplementary material,
9
OffsetMeasurement3D). The uncertainty of the piercing point is the standard deviation of all resulting random piercing points.
2.5.Offset measurements on the fault plane. Distance between piercing points
The final step is to measure the distance between piercing point pairs (that refer to the same channel feature but from each fault block). These distances are the offsets for each channel piercing straight line (margins or thalweg). The net, lateral and vertical offsets are calculated, together with their associated uncertainties (Supplementary material, OffsetMeasurement3D). As piercing lines from the same channel may differ in orientation, the offsets calculated from them are likely also dissimilar (Fig. 1C). To obtain the channel offset we apply the displacement density functions proposed by Zechar and Frankel (2009) to resolve the final estimates of slip. These functions yield the mean, the median and the statistical bounds of the three offset elements in which the channel was simplified (margins and thalweg).
3. Case study: a buried channel offset by the Alhama de Murcia fault
The new methodology of offset determination was used at the Alhama de Murcia fault to estimate the net, lateral and vertical slip components affecting a faulted buried channel. U-series dating of soil carbonate developed in gravels of the buried channel provided an estimate of the channel’s age that was used to calculate slip rates.
3.1.Geological setting
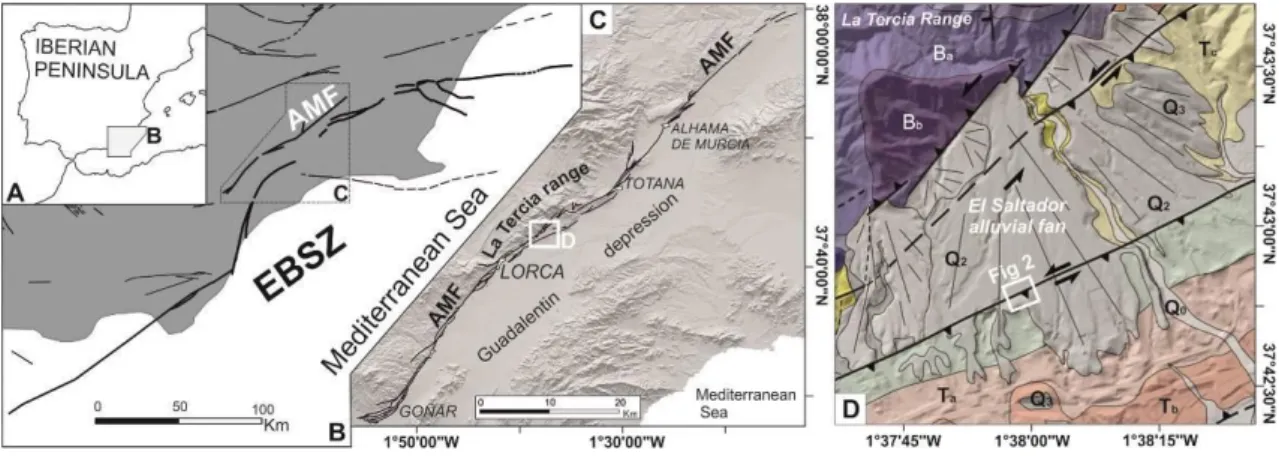
The Alhama de Murcia Fault (AMF) is a left-lateral strike-slip fault with an apparently minor reverse component (Bousquet, 1979; Martínez-Díaz, 1998), situated in the SE of the Iberian Peninsula (Figure 2). It is part of the Eastern Betics Shear Zone (EBSZ), which plays a major role in the Iberian plate by absorbing part of the convergence between the African and Euroasiatic plates (De Larouziére et al., 1988; Masana et al.,
10
2004). The AMF is 87 km long and has been subdivided into four segments according to its seismic signature, geomorphological evidence, and geological history (Silva, 1994; Martínez-Díaz et al., 2012). The four segments, from south to north, are: a) Góñar–Lorca, with a horse tail termination to the south; b) Lorca–Totana, where the fault, N060E in trend, splits into several sub-parallel fault traces and shows the maximum concentration of seismicity; c) Totana–Alhama de Murcia, where the fault recovers its NE-SW trend but still shows several strands; and 4) Alhama de Murcia– Alcantarilla, where the geomorphic manifestation of the fault is diffuse.
A number of studies have focused on calculating the seismic parameters of the AMF (Silva et al., 1997; Martínez-Díaz, 1998; Martínez-Díaz et al., 2003; Masana et al., 2004; Ortuño et al., 2012; Echeverria et al., 2013; Ferrater et al., 2015b; Ferrater et al., submitted). Several attempts to estimate the slip rate of the AMF have been done. Ortuño et al. (2012) suggested 0.16–0.22 mm/yr of vertical slip rate and 0.95–1.37 mm/yr of lateral slip rate on the southern termination of the fault (in the southernmost fault segment) acknowledging huge uncertainties in their assumptions and using markers of different ages. In the Lorca–Totana segment, Masana et al. (2004) examined two trenches, and proposed a first estimation of the lateral slip rate (0.06–0.53 mm/yr for the past 30 ka) based on i) the estimation of the vertical offset (measured as the vertical step of the alluvial fan surface) and ii) on the orientation of slickensides. These results contained large uncertainties mostly linked to the assumption that the topographical step observed in the fan surface was mostly produced by the dip slip movement of the fault, minimizing the lateral offset of a non-horizontal (i.e. the conic shape of a fan) surface; Martínez-Díaz et al. (2003) calculated 0.21 mm/yr of lateral slip rate for the Upper-Pleistocene by measuring offset channels on a fan surface assuming the channels to be formed close to the middle-Upper Pleistocene boundary. By means of
11
an archeoseismic study, Ferrater et al. (2015b) suggested a lateral slip rate of 0.024– 0.039 mm/yr for one strand of the Totana–Alhama de Murcia segment based on an offset wall of the Argaric culture (approx. 4000 years old). The different approaches used for the aforementioned authors, together with the suppositions made, result in a wide range of lateral slip rates for the AMF (from 0.02 to 1.37 mm/yr) that need to be better constrained.
The El Saltador site, the focus of our study, is located in the southernmost strand of the Lorca–Totana segment that shows geomorphic evidence of lateral slip (SAMF; Martínez-Díaz, 1998; Ferrater et al., 2015a). This strand strongly dips to the south (> 80 º), and has a reverse component that uplifts the hanging wall. As a result, a smooth elongated NE-SW range is created. This small relief partially dams the drainage coming from the La Tercia Range running down to the Guadalentín depression, making the site an optimum location for a paleoseismological study. Geologically, the site is at the place where the El Saltador alluvial fan crosses the fault (Fig. 2D).
The 3D trenching survey consisted of the excavation of a total of ten trenches, four of them perpendicular to the fault, and six parallel to the fault. The former (TR 6, 7, 11 and 15) were intended to locate the fault and to identify paleoseismic events, whereas the latter (TR 5, 8, 10, 12, 13 and 14) were designed to identify buried offset channels in the stratigraphic sequence. The AMF has a diffuse deformation zone more than 5 meters wide, outcropping in the perpendicular trenches. This precluded the use of widespread 3D trenching techniques that progressively excavate trenches towards the fault zone, as the offset measured in the main fault would underestimate the total offset. To solve this problem, and to use a similar geomorphic criterion to that used by Ferrater et al. (2015a) to measure geomorphologic offsets in the same fault, we projected the
three-12
dimensional tendency of the channel considering a mid-distance (between 5 and 30 m) from the fault onto the fault plane, avoiding the near fault deformation.
Figure 2. A) Alhama de Murcia fault (AMF) in the Iberian Peninsula; B) the AMF is a part of the Eastern Betics Shear Zone (EBSZ faults in bold line); C) structural map of the AMF; D) geological map of the El Saltador alluvial fan: Ba-b, Palaeozoic basement rocks; Ta-c, Upper-Messinian rocks; Q0-4, Quaternary alluvial phases from older (3) to younger (0). The white square indicates the El Saltador trenching site. Figure from Ferrater et al., submitted.
3.2.U-series dating of pedogenic carbonate
Pedogenic carbonate generally forms in regions with annual precipitation of less than about 750-1000 mm, is common over a wide range of climates on more than half of the earth’s land surface, and generally accumulates most markedly within soil profiles at depths of 0.3 to 2.0 meters (Birkland, 1984). If less than about 0.5 Myrs old, dense and relatively pure pedogenic carbonate is amenable to U-series dating. Carbonate-rich clast-coatings that begin to form on the bottoms of clasts in the earliest stages of carbonate accumulation in gravelly soils can consist of dense, pure, laminated carbonate that is highly suitable for U-series dating (e.g., Ludwig and Paces, 2002; Sharp et al., 2003). Samples of carbonate coatings developed on gravels of the offset buried channel (unit D) were collected on both sides of the fault and dated at the Berkeley Geochronology Center using methods similar to those of Sharp et al. (2016).
13
3.3.Results
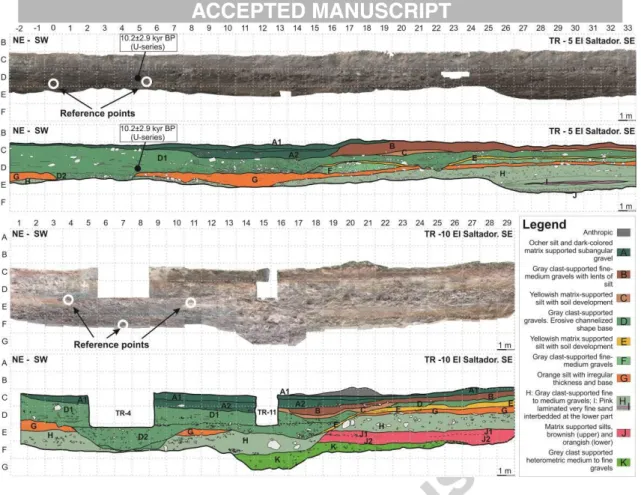
The trenches exposed an alluvial fan sequence that alternates heterometric gravels and sands with defined levels of fine orange sands and silts. Within the gravels we identified two buried alluvial paleochannels, one in unit D and the other, much smoothed, in unit B (Fig. 3). To measure the offset of the channel in unit D we followed the proposed methodology. Given the particularities of channel B, we deal with its analysis as a special case.
Unit D comprises heterometric subangular clast–supported gravels (Fig. 3). The lower part of the unit is entrenched and filled with coarse and chaotic facies, whereas the upper part presents tractive structures, such as laminar bedding, and local cross–bedding and clast imbrication. The correlation of the identified channel on either side of the fault is accomplished using stratigraphic criteria, such as sedimentary position, shape and facies. Numerical dating provided by U-series (Ferrater et al., submitted) supported the interpretation; the U-series ages of the pedogenic carbonate yielded reproducible ages of 12.39 ± 0.83 kyr in the hanging wall and 10.2 ± 2.9 kyr in the foot wall (Fig. 3), confirming the correlation of the channel on both sides of the fault (Ferrater et al., submitted). The channel was identified in four wall trenches in the foot wall (TR 5 and 10) and in four walls in the hanging wall (TR 13 and 14). The channel was approx. 5 m wide and 1.75 m deep, and its top was at a depth of 2 m in the foot wall and at 1 m in the hanging wall (SE).
14
Figure 3. Example of the used reference points for channel D identified in trenches 5 (SE wall) and 10 (SE wall). Due to the depth of trench 5, the thalweg of the channel was not identified.
15
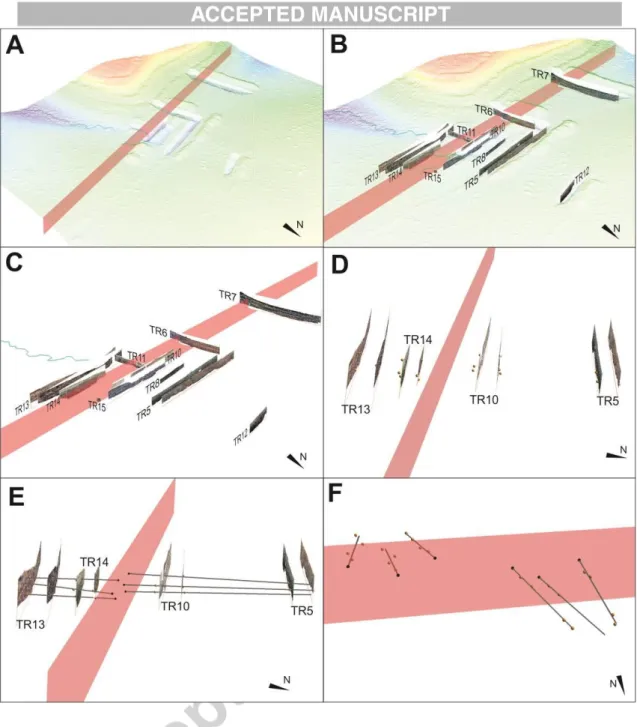
Figure 4. Visualization of the 3D trenching. A) Point cloud acquired from airborne lidar data in 2013 including the simplified vertical fault plane; B) photomosaics and orthophotography of the exposed trenches in the point cloud; C) photomosaics and orthophotography of the exposed trenches; D) parallel view of the trenches in which the channel was identified (reference points in orange); E) position of the adjusted 3D straight piercing lines (grey lines) with respect to the trench walls; F) simplified fault, reference points (in orange), straight piercing lines (in grey) and piercing points (in black). Notice that the straight piercing lines do not contain the reference points.
Three channel features were used for reference in the channel of unit D: the two margins (where the channel facies changes from chaotic to laminated facies) and the
16
channel thalweg. In the southeastern block (hanging wall), all channel features were surveyed in all four trench walls. However, in the northwestern block (foot wall), the margins were surveyed in four trench walls, but the thalweg in just two of them (Fig. 4). In the field, the coordinates of each reference point were surveyed using a differential GPS (Leica Zeno 5) together with the epistemic uncertainty of its 3D location (ranging from 5 cm to 2 m horizontally and 1 to 40 cm vertically). GPS error was considered negligible, as it was just 2 cm on the vertical axis and less than 2 cm on the horizontal axis. In the case of the SAMF, we projected the channels onto a vertical fault plane due to the high (near 90 º) variable dipping angle of the fault observed in the field in TR11 (Figure 4C). By verticalizing the fault plane, the net and the dip-slip offsets are slightly underrated, but their vertical and horizontal (lateral) components remain the same.
A 3D visualization of the elements in space was constructed using a 3D commercial program (GoCAD) to ensure that the 3D adjusted straight lines were coherent with the trench positions. Different views of the site and the trench walls are shown in Figure 4. Figure 4F shows how the reference points for each feature were not perfectly aligned. This was due to the channel irregularities (Fig. 1C) and it means that the 3D adjusted straight lines did not coincide spatially with the reference points.
The values obtained for the net, lateral and vertical offsets of the three straight piercing lines are listed in Table 1 and shown in Figure 5 (which includes only some trenches for clarity). The resulting mean minimum net offset value for unit D (2σ) was 16.0 +2.5/–0.8 m. Moreover, the mean lateral offset was 15.9 +2.5/–0.8 m and the mean vertical displacement was 1.4 +0.2/–0.1 m. These values confirm that the main component of displacement along the fault is left lateral strike-slip.
17
Figure 5. Paleoseismic interpretation. A) Plan view of the trenches; B) interpretation of the exposed units (only one wall of TR 5, 6, 10 and 13 are shown as an example for clarity). Orange lines are the calculated piercing straight lines for channel D (see Fig. 4) and purple lines are the calculated piercing straight lines for channel B. Blue line is the active channel, and its straight projection onto the fault.
Min. net offset Net uncertainty Lateral offset Lateral uncertainty Vertical offset Vertical uncertainty D eastern margin 17.25 0.60 17.19 0.60 -1.42 0.02 D thalweg 15.06 0.15 15.00 0.15 -1.34 0.02 D western margin 15.61 0.05 15.56 0.01 -1.30 0.05
Table 1. Summary of the calculated offsets (net, lateral and vertical) and their uncertainties for every channel feature: eastern margin, thalweg and western margin. Negative values indicate that the hanging wall is uplifted.
Ages of pedogenic carbonate provide a minimum estimate for the depositional age of the buried channel since accumulation of pedogenic carbonate necessarily ensues after deposition of its host. Groups of pedogenic carbonate clast-coatings from unit D were
18
collected from each side of the fault, with each group consisting of three or four sub-samples. U-series ages for the two groups yielded similar weighted mean ages of 12.39 ± 0.83 ka (SE fault block) and 10.2 ± 2.9 ka (NW fault block; Fig. 5B; errors are 95% confidence interval), consistent with the proposed correlation of the buried channel across the fault. The mean of all the dates on unit D, 12.22 ± 0.80 ka, is our preferred age for the buried channel.
The combination of all values (the net, lateral and vertical offsets and the age of unit D) using the functions of Zechar and Frankel (2009) yielded maximum net, lateral and vertical slip rates (2σ) of 1.3 +0.2/–0.1 mm/yr, 1.3 +0.2/–0.1 mm/yr, and 0.1 +0.0/–0.0 mm/yr, respectively. As expected after the offset calculation, the lateral component of the fault was much higher than the vertical one. The obtained net slip rate was much larger than proposed to date using different approaches (Martínez-Díaz, 1998; Martínez-Díaz et al., 2003; Masana et al., 2004; Ortuño et al., 2012; Echeverria et al., 2013; Ferrater et al., 2015b).
3.4.A special case: the paleochannel in unit B
The paleochannel in unit B is only preserved in the foot wall of the fault and, thus, its direct correlation with the opposite side of the fault (as the workflow describes) is not possible. However, it can be correlated with the current channel to obtain a minimum offset value. The current channel in the foot wall is actively eroding the hill on its right bank as a consequence of the left lateral movement of the fault that incrementally places the hill in front of the water inflow and therefore the position of the current channel is the maximum position for channel B in the hanging wall. On the other hand, the position of channel B could have been located more to the NE, so we only obtained a minimum offset value.
19
In the foot wall, the channel crops out in TR 5, 8 and 10. We used the margins (where the entrenchment starts) to measure the offset of the channel. Just two reference points were acquired for each channel feature (one in TR 8 and one in TR 10), because the exposure of the channel in TR 5 is very diffuse (Fig. 3). In the hanging wall, the only piercing line that could be used was the channel thalweg, since the channel morphology is very vague and the two margins are not clear. To calculate the active channel tendency, we adjusted a straight line to a channel segment running from 10 (to avoid deflection in the diffuse deformation of the fault) to 30 meters from the fault. We decided to use a 20–meter segment because a) sinuosity would be a greater influence in a smaller segment, and b) a longer segment would not be consistent with the distances used to calculate the channel D tendency in the foot wall.
We correlated two channel features in the NW with only one feature in the SE (the thalweg): the distance between the western margin of the buried channel and the current thalweg is the maximum offset, whereas the distance between the eastern margin of channel B and the thalweg is the minimum offset (Fig. 5). As a result, we fitted a trapezoidal displacement density function (Zechar and Frankel, 2009) to reflect this reality and to calculate the final offset of channel B. The obtained minimum mean net offset for channel B was 4.8 +1.1/–1.1 m (2σ). Minimum lateral and vertical offsets were 4.7 +1.1/–1.1 m and -0.7 +0.2/–0.2 m, respectively.
4. Discussion and conclusions
Geomorphological analyses show that the use of the straight full projection of linear features (such as channels or terrace risers) onto the fault provides a very good approximation of their offset. To do so, these analyses require considering the sinuosity of such features as being almost negligible. The proposed workflow to project the
20
buried channels identified in 3D paleoseismological trenches was inspired by the criterion used in geomorphological studies. This procedure is limited to measure the offsets of channels with a) low sinuosity or b) small wavelengths of sinuosity. Otherwise, more trenches would be needed in order to adjust a circular arc or a polynomial curve to the reference points. We believe this method is valid based on the previous evaluation of the present-day analogue channels (i.e. their current sinuosity or the length of segments of the streams with constant trends). Our approach avoids the measurement of offsets in the near fault zone that may be subjected to channel deflection or diffuse deformation. Measurement in such near fault areas may result in many cases in an underestimation of the offset. In the El Saltador site, where we tested this technique, the channels show very low sinuosity on the alluvial fan surfaces (Ferrater et al., 2015a) and, as a consequence, we assume that this is the shape of the buried channels identified in the stratigraphic sequence.
The final outputs of the scripts we used are the offset measurements and their uncertainties for the two components of a fault movement. The set of scripts also provides a direct way to compare the two components of slip, improving previous results of 3D trenching studies. Moreover, these scripts imply methodological advantages. As this technique needs just three (at least) reference points, we were able to minimize the laborious and expensive field work associated with the traditional three-dimensional paleoseismic surveys. In the example, we reduced the total amount of trenches parallel to the fault needed to calculate the offset of the buried channel to four.
The application of this approach to the Alhama de Murcia fault proves that the lateral component of the fault is much higher than the vertical one, implying that all previous
21
trenching studies that excavated only perpendicular to the fault and calculated the lateral component of the fault based on slickensides underestimated its seismic potential.
Acknowledgements
This research was funded by SHAKE CGL2011-30005-C02-02. The authors are grateful to all the members of the trenching team, to Cèsar Ferrater for his comments on the first versions of the manuscript and mathematical advice and to Manuel Jesús Royán for its programming advice. We also thank Olaf Zielke and an anonymous reviewer for their comments improving the original manuscript. The Ministerio de Educación, Cultura y Deporte from Spain provided funding for the predoctoral FPU fellowship of M. Ferrater.
References
Birkeland, P.W., 1984. Soils and Geomorphology. Oxford University Press, New York. Bousquet, J.C., 1979, Quaternary strike-slip faults in south-eastern Spain:
Tectonophysics, v. 52, p. 277–286.
Chevalier, M.L., Van Der Woerd, J., Tapponnier, P., Li, H., Ryerson, F.J., and Finkel, R.C., 2016, Late quaternary slip-rate along the central Bangong-Chaxikang segment of the Karakorum fault, western Tibet: Bulletin of the Geological Society of America, v. 128, no. 1-2, p. 284–314, doi: 10.1130/B31269.
Cowgill, E., 2007, Impact of riser reconstructions on estimation of secular variation in rates of strike–slip faulting: Revisiting the Cherchen River site along the Altyn Tagh Fault, NW China: Earth and Planetary Science Letters, v. 254, no. 3-4, p. 239–255, doi: 10.1016/j.epsl.2006.09.015.
Echeverria, A., Khazaradze, G., Asensio, E., Gárate, J., Martín Dávila, J., and Suriñach, E., 2013, Crustal deformation in eastern Betics from CuaTeNeo GPS network: Tectonophysics, v. 608, p. 600–612.
Ferrater, M., Arrowsmith, R., and Masana, E., 2015a, Lateral Offset Quality Rating along Low Slip Rate Faults: Application to the Alhama de Murcia Fault (SE Iberian Peninsula): Remote Sensing, v. 7, no. 11, p. 14827–14852, doi: 10.3390/rs71114827.
Ferrater, M., Silva, P.G., Ortuño, M., Rodríguez-Pascua, M.Á., and Masana, E., 2015b, Archaeoseismological Analysis of a Late Bronze Age Site on the Alhama de Murcia Fault, SE Spain: Geoarchaeology, v. 30, p. 151–164, doi: 10.1002/gea.21505.
22
Ferrater, M., Ortuño, M., Masana, E., Pallàs, R., Perea, H., Baize, S., García-Melendez, E., Martínez-Díaz, J.J., Echeverria, A., Rockwell, T.K., and Sharp, W.D. Refining seismic parameters in low seismicity areas by 3D trenching: the not so slow Alhama de Murcia fault, SE Iberia: submitted to Tectonophysiscs.
Frankel, K.L., Brantley, K.S., Dolan, J.F., Finkel, R.C., Klinger, R.E., Knott, J.R., Machette, M.N., Owen, L. a., Phillips, F.M., Slate, J.L., and Wernicke, B.P., 2007, Cosmogenic 10 Be and 36 Cl geochronology of offset alluvial fans along the northern Death Valley fault zone: Implications for transient strain in the eastern California shear zone: Journal of Geophysical Research, v. 112, no. B6, p. B06407, doi: 10.1029/2006JB004350.
Gold, R.D., Cowgill, E., Arrowsmith, J.R., Chen, X., Sharp, W.D., Cooper, K.M., and Wang, X.-F., 2011, Faulted terrace risers place new constraints on the late Quaternary slip rate for the central Altyn Tagh fault, northwest Tibet: Geological Society of America Bulletin, v. 123, no. 5-6, p. 958–978, doi: 10.1130/B30207.1.
Haddon, E.K., Amos, C.B., Zielke, O., Jayko, A.S., and Bürgmann, R., 2016, Surface Slip during Large Owens Valley Earthquakes: Geochemistry, Geophysics, Geosystems, doi: 10.1002/2015GC006033.
Hall, N.T., Wright, H., and Clahan, K.B., 1999, Paleoseismic studies of the San Francisco Peninsula segment of the San Andreas Fault zone near Woodside, California: Journal of Geophysical Research, v. 104, p. 23215–23236.
Huang, W., 1993, Morphologic patterns of stream channels on the active Yishi Fault, southern Shandong Province, Eastern China: implications for repeated great earthquakes in the Holocene: Tectonophysics, v. 219, p. 283–304.
De Larouziére, F.D., Bolze, J., Bordet, P., J., Hernández, J., Montenat, C., and Ott d’Estevou, P., 1988, The Betic segment of the lithospheric Trans-Alboran shear zone during the Late Miocene: Tectonophysics, v. 152, p. 41–52.
Liu, J., Klinger, Y., Sieh, K., and Rubin, C., 2004, Six similar sequential ruptures of the San Andreas fault, Carrizo Plain, California: Geology, v. 32, no. 8, p. 649-652, doi: 10.1130/G20478.1.
Liu-Zeng, J., Klinger, Y., Sieh, K., Rubin, C., and Seitz, G., 2006, Serial ruptures of the San Andreas fault, Carrizo Plain, California, revealed by three-dimensional excavations: Journal of Geophysical Research, v. 111, B02306, doi: 10.1029/2004JB003601.
Ludwig, K.R., and Paces, J.B., 2002, Uranium‐series dating of pedogenic silica and carbonate, Crater Flat, Nevada: Geochimica et Cosmochimica Acta, v. 66, no. 3, p. 487–506.
Marco, S., Rockwell, T.K., Heimann, A., Frieslander, U., and Agnon, A., 2005, Late Holocene activity of the Dead Sea Transform revealed in 3D palaeoseismic trenches on the Jordan Gorge segment: Earth and Planetary Science Letters, v. 234, no. 1-2, p. 189–205, doi: 10.1016/j.epsl.2005.01.017.
Martínez-Díaz, J.J., 1998, Neotectónica y Tectónica Activa del Sector Centro-Occidental de la Región de Murcia y Sur de Almería (Cordillera Bética – España): PhD thesis, Universidad Complutense de Madrid, Madrid.
23
Martínez-Díaz, J.J., Masana, E., Hernández-Enrile, J.L., and Santanach, P., 2003, Effects of repeated paleoearthquakes on the Alhama de Murcia Fault (Betic Cordillera, Spain ) on the Quaternary evolution of an alluvial fan system: Annals of geophysics, v. 46, no. 5, p. 775–791.
Martínez-Díaz, J.J., Masana, E., and Ortuño, M., 2012, Active tectonics of the Alhama de Murcia fault, Betic Cordillera, Spain: Journal of Iberian Geology, v. 38, no. 1, p. 253–270.
Masana, E., Villamarín, J.A., and Santanach, P., 2001, Paleoseismic results from multiple trenching analysis along a silent fault: The El Camp fault (Tarragona, northeastern Iberian Peninsula): Acta Geologica Hispanica, v. 36, no. 3-4, p. 329–354.
Masana, E., Martínez-Díaz, J.J., Hernández-Enrile, J.L., and Santanach, P., 2004, The Alhama de Murcia fault (SE Spain), a seismogenic fault in a diffuse plate boundary: Seismotectonic implications for the Ibero-Magrebian region: Journal of Geophysical Research, v. 109, B01301, doi: 10.1029/2002JB002359.
McCalpin, J.P., Rockwell, T.K., and Weldon, R.J., 1996, Paleoseismology of strike-slip tectonic environments. In: McCalpin, J.P. (Ed.), Paleoseismology, International Geophysics, Academic Press, 613 p.
Ortuno, M., Masana, E., García-Meléndez, E., Martínez-Díaz, J., Stepancikova, P., Cunha, P.P., Sohbati, R., Canora, C., Buylaert, J.-P., and Murray, A.S., 2012, An exceptionally long paleoseismic record of a slow-moving fault: The Alhama de Murcia fault (Eastern Betic shear zone, Spain): Geological Society of America Bulletin, v. 124, no. 9-10, p. 1474–1494, doi: 10.1130/B30558.1.
Ouchi, S., 2004, Flume experiments on the horizontal stream offset by strike-slip faults: Earth Surface Processes and Landforms, v. 29, no. 2, p. 161–173, doi: 10.1002/esp.1017.
Rittase, W.M., Kirby, E., McDonald, E., Walker, J.D., Gosse, J., Spencer, J.Q.G., and Herrs, A.J., 2014, Temporal variations in Holocene slip rate along the central Garlock fault, Pilot Knob Valley, California: Lithosphere, v. 6, no. 1, p. 48–58, doi: 10.1130/L286.1.
Rockwell, T., Ragona, D., Seitz, G., Langridge, R., Aksoy, M.E., Ucarkus, G., Ferry, M., Meltzner, A.J., Klinger, Y., Meghraoui, M., Satir, D., Barka, A., and Akbalik, B., 2009, Palaeoseismology of the North Anatolian Fault near the Marmara Sea: implications for fault segmentation and seismic hazard: Geological Society, London, Special Publications, v. 316, no. 1, p. 31–54, doi: 10.1144/SP316.3.
Salisbury, J.B., Rockwell, T.K., Middleton, T.J., and Hudnut, K.W., 2012, LiDAR and Field Observations of Slip Distribution for the Most Recent Surface Ruptures along the Central San Jacinto Fault: Bulletin of the Seismological Society of America, v. 102, no. 2, p. 598–619, doi: 10.1785/0120110068.
Sharp, W.D., Ludwig, K.R., Chadwick, O.A., Amundson, R., and Glaser, L.L., 2003, Dating fluvial terraces by 230 Th/U on pedogenic carbonate, Wind River Basin, Wyoming: Quaternary Research, v. 59, p. 139–150, doi: 10.1016/S0033-5894(03)00003-6.
24
Sharp, W.D., Mertz-Kraus, R., Vallverdu, J., Vaquero, M., Burjachs, F., Carbonell, E., and Bischoff, J.L., 2016, Archeological deposits at Abric Romaní extend to 110ka: U-series dating of a newly cored, 30meter-thick section: Journal of Archaeological Science: Reports, v. 5, p. 400–406, doi: 10.1016/j.jasrep.2015.12.015.
Sieh, K., 1978, Slip along the San Andreas fault associated with the great 1857 earthquake: Bulletin of the seismological Society of America, v. 68, no. 5, p. 1421–1448.
Silva, P.G., 1994, Evolución Geodinámica de la Depresión del Guadalentín desde el Mioceno superior hasta la Actualidad: Neotectónica y Geomorfología: PhD thesis, Universidad Complutense de Madrid, Madrid.
Silva, P.G., Goy, J.L., Zazo, C., Lario, J., and Bargají, T., 1997, Paleoseismic indications along “aseismic”fault segments in the Guadalentín depression (SE Spain): Journal of Geodynamics, v. 24, no. 1-4, p. 105–115.
Van der Woerd, J., Tapponnier, P., Ryerson, F.J., Meriaux, A., Meyer, B., Gaudemer, Y., Finkel, R.C., Caffee, M.W., Guoguang, Z., and Zhiqin, X., 2002, Uniform postglacial slip-rate along the central 600 km of the Kunlun Fault (Tibet), from 26Al, 10Be, and 14C dating of riser offsets, and climatic origin of the regional morphology: Geophysical Journal International, v. 148, p. 356–388.
Wallace, R.E., 1968, Notes on stream channels offset by the San andreas Fault southern coast ranges, california: Proceedings of conference on geologic problems of san andreas fault system, p. 6–21.
Wesnousky, S.G., Prentice, C.S., and Sieh, K.E., 1991, An offset Holocene stream channel and the slip rate along the northern reach of the San Jacinto fault zone, San Bernardino Valley, California: Geological Society of America Bulletin, v. 103, no. May, p. 700–709.
Zechar, J.D., and Frankel, K.L., 2009, Incorporating and reporting uncertainties in fault slip rates: Journal of Geophysical Research, v. 114, B12407, doi: 10.1029/2009JB006325.
Zielke, O., and Arrowsmith, J.R., 2012, LaDiCaoz and LiDARimager—MATLAB GUIs for LiDAR data handling and lateral displacement measurement: Geosphere, v. 8, no. 1, p. 206–221, doi: 10.1130/GES00686.1.
Zielke, O., Arrowsmith, J.R., Grant Ludwig, L., and Akciz, S.O., 2012, High-Resolution Topography-Derived Offsets along the 1857 Fort Tejon Earthquake Rupture Trace, San Andreas Fault: Bulletin of the Seismological Society of America, v. 102, no. 3, p. 1135–1154, doi: 10.1785/0120110230.
Zielke, O., Klinger, Y., and Arrowsmith, J.R., 2015, Tectonophysics Fault slip and earthquake recurrence along strike-slip faults — Contributions of high-resolution geomorphic data: Tectonophysics, v. 638, p. 43–62.
HIGHLIGHTS
The proposed methodologic approach modifies 3D paleoseismologic existing techniques
25
The offset of a buried channel is measured projecting its tendency into the fault
The calculated maximum net slip rate for Alhama de Murcia fault is 1.3 +0.2/– 0.1 mm/yr.