UNIVERSITÀ DEGLI STUDI DI GENOVA
SCUOLA DI SCIENZE MEDICHE E FARMACEUTICHE
CORSO DI LAUREA IN MEDICINA E CHIRURGIA
Comparison between Electrical Impedance Tomography
and Lung Ultrasound in assessing lung aeration in ICU
patients receiving mechanical ventilation
UNIVERSITÀ DEGLI STUDI DI GENOVA
SCUOLA DI SCIENZE MEDICHE E FARMACEUTICHE
CORSO DI LAUREA SPECIALISTICA IN MEDICINA E CHIRURGIA
ANNO ACCADEMICO 2019-2020
TESI DI LAUREA
Comparison between Electrical Impedance Tomography and Lung
Ultrasound in assessing lung aeration in ICU patients receiving
mechanical ventilation
RELATORE
C.mo Prof. Dr. Lorenzo Ball
CORRELATORE
Prof. Dr. Marcus J. Schultz
CANDIDATO
Simon Corrado Serafini
“
Let everything happen to you
.
Beauty and terror
.
Just keep going.
No feeling is final”
Research Thesis in Intensive Care Medicine
Amsterdam University Medical Centers, location AMC
Simon Corrado Serafini (student number: 3772001) Relatore: Lorenzo Ball
Correlatore: Marcus J. Schultz
Supervisors: Prof. dr. Marcus J. Schultz, dr. Lieuwe D.J. Bos, Luigi Pisani, MD, Marry R. Smit, MSc
Sommario
ABBREVIATIONS ... 5
RIASSUNTO ... 6
ABSTRACT ... 8
INTRODUCTION ... 10
Electrical impedance tomography ... 10
Principles of EIT ... 11
Clinical information derived from the machine ... 12
Lung ultrasound ... 13
Aim ... 18
METHODS ... 19
LUS protocol ... 19
Lung ultrasound scoring ... 20
EIT ... 21
Offline EIT analysis ... 21
Study endpoints ... 24 Statistical analysis ... 24 RESULTS ... 25 DISCUSSION ... 30 REFERENCES ... 33 ACKNOWLEDGEMENTS ... 36 RINGRAZIAMENTI ... 37
ABBREVIATIONS
BPM: beats per minute CT: computed tomography
EIT: electrical impedance tomography F: frequency
FiO2 : fraction of inspired oxygen
GI: global inhomogeneity index ICU: intensive care unit
MDL: mid-dorsal left MDR: mid-dorsal right MV: mechanical ventilation MVL: mid-ventral left MVR: mid-ventral right
PaCO2 : partial pressure of carbon dioxide in arterial blood
pH: measure of acidity or alkalinity of a substance PEEP: positive end-expiratory pressure
PSV: pressure support ventilation ROI: region of interest
RR: respiratory rate
RVD: regional ventilation delay SD: standard deviation
t: time
TV: tidal variation
TVxy: tidal variation value of the pixel with coordinates x, y VL: ventral left
VR: ventral right VT: tidal volume
RIASSUNTO Introduzione
Regioni che presentano un pattern misto di aerazione (linee A e B insieme) all’ecografia polmonare non hanno ancora un chiaro significato nei pazienti che sono ventilati meccanicamente. Una possibile spiegazione potrebbe essere l’apertura e la chiusura ciclica degli alveoli in quell’area polmonare. Il regional ventilation delay (RVD) misurato tramite tomografia ad impedenza elettrica (EIT) è in grado di valutare il reclutamento e de-reclutamento polmonare solo durante manovre di lenta insufflazione d’aria. Lo scopo di questo studio era di indagare una possibile associazione tra il RVD nell’EIT e il pattern misto A/B di aerazione dell’ecografia polmonare.
Ipotesi
È stato ipotizzato che il pattern misto A/B di aerazione fosse causato da un’apertura e chiusura ciclica del polmone, e perciò fosse correlato con il RVD nelle immagini dell’EIT.
Metodi
I pazienti arruolati presentavano un pattern misto A/B di aerazione nelle immagini all’ecografia polmonare, fatte per lo studio DARTS. Le misurazioni sono state fatte sia con EIT che con l’ecografo. Il software EITdiag è stato usato per analizzare i dati delle immagini. Le immagini ecografiche sono state salvate al letto del paziente e successivamente valutate per il numero di linee B e per la presenza del suddetto pattern. La correlazione tra le variabili è stata analizzata con test non parametrici.
Risultati
Cinque pazienti in terapia intensiva e sotto ventilazione meccanica sono stati arruolati allo studio tra Giugno e Ottobre 2019. In contrasto alla nostra ipotesi non è stato trovato
I nostri dati sperimentali, prudentemente, suggeriscono che, con i metodi usati, le regioni polmonari con il pattern misto A/B non hanno significativa correlazione con le regioni polmonari che presentano RVD, senza manovre di lenta insufflazione d’aria, e pertanto questo pattern potrebbe non essere causato dall’apertura e chiusura ciclica degli alveoli polmonari, ma avere altre cause ancora da ricercare.
ABSTRACT
Introduction
Regions with a mixed aeration pattern on lung ultrasound i.e. with coexisting A and B patterns, have been scarcely investigated in invasive mechanically ventilated patients. A possible explanation might be cyclic opening and closing of the lung area. Regional ventilation delay index (RVD) on electrical impedance tomography (EIT) can assess regional tidal recruitment and derecruitment, only during a slow flow maneuver. The purpose of this study was to investigate potential associations between RVD in EIT and A/B mixed aeration pattern in LUS.
Hypothesis
We hypothesized that a sonographic mixed aeration pattern is caused by cyclic opening and closing of the lung, and thus is correlated with RVD in EIT images.
Methods
Patients were enrolled in the study when a LUS image, performed for “bedside exhaled breath octane measurements for the diagnosis and monitoring of acute respiratory distress syndrome in invasively ventilated patients” (DARTS) study, contained an A/B mixed aeration pattern. LUS and EIT measurements were performed and images analyzed. EITdiag software was used to analyse the EIT raw data. LUS images were saved offline and subsequently scored for aeration pattern and number of B-lines. Correlation among variables was analysed with non-parametric tests.
Results
Five patients under mechanical ventilation, admitted to the ICU between June and October 2019, were enrolled in this study. In contrast to our hypothesis, RVD was not significantly increased in patients with mixed aeration pattern (P=0.915). We found no
flow maneuver, on impedance tomography-based analysis and thus might not be caused by cyclic opening and closing of the lung.
INTRODUCTION
While the computed tomography (CT) remains the gold standard1 for lung imaging, new
techniques are upcoming in intensive care unit (ICU)2. In recent years, ultrasound has
earned a growing position among imaging techniques3. Ultrasound is routinely used in
the diagnostic approach to patients with acute respiratory failure, circulatory shock, or cardiac arrest4. In the BLUE protocol5, lung ultrasound (LUS) signs are associated to
build up different profiles to be applied in patients presenting to the emergency department with dyspnoea. LUS patterns and findings have been clearly summarized in 20126, however some combined findings lack a clinical counterpart. For instance, the
exact interpretation of coexisting A-lines and B-lines (A/B mixed aeration pattern) is yet not clear.
Electrical impedance tomography
Over the past decades, electrical impedance tomography (EIT) made a huge progress from an experimental technology to imaging modality for clinical use. It is a safe, radiation free method that allows a real-time bedside monitoring of patients, mainly in ICUs. Many clinical studies have shown that EIT could offer a considerable alternative to conventional imaging modalities, especially in monitoring of lung ventilation7,8.
The experimental use of EIT in monitoring of lung functions soon revealed several areas where EIT provides valuable clinical information. Probably the most intensively studied topic is the optimization of mechanical ventilation by means of EIT, especially titration of positive end-expiratory pressure (PEEP)9–11 to avoid pulmonary
Figure 1 Hypothetical pressure-volume curve of the lung in a patient undergoing mechanical ventilation. Alveoli tend to close if the distending pressure falls below the lower inflection point A, whereas they overstretch if the pressure within them is higher than that of the upper inflection point B. Collapse and
opening of ventilated alveoli are associated with poor outcomes in patients with acute respiratory failure. Protective ventilation (purple shaded area), using a lower tidal volume (6 mL/kg of ideal body weight) and maintaining positive end-expiratory pressure to prevent overstretching and collapse/opening of alveoli, has resulted in improved survival rates among patients receiving mechanical ventilatory support. (Image extract
from Kasper DL et al. Harrison’s Principles of Internal Medicine, 20th Edition.)
Principles of EIT
Dielectric properties of biological tissues are dependent on the tissue composition and on the frequency of the applied electric current. The concentration of electrolytes in intracellular and extracellular fluids, the presence of lipids, cell size or the amount of water are the most influential attributes affecting the tissue impedance12. In lung tissue,
increasing air content, the structures of lung parenchyma are stretched, decreasing their thickness while increasing the length of the pathways for electric current at the same time. As a result, electrical impedance of lung tissue increases. When bioimpedance measurements are performed using alternating current of several different frequencies, electrical conductivity of body tissues can be determined, and the particular tissues and their state can be distinguished. The fundamental idea of EIT is to determine the spatial distribution of conductivity inside an inhomogeneous volume conductor. For this purpose, array of electrodes attached to the surface of the conductor is used. Electric current is applied consecutively through selected electrode pairs and the resulting voltages are measured by the remaining pairs. The image reconstruction problem is out of the scope of this essay.
EIT images are able to capture several ventilation indexes explained by “Translational EIT development study” (TREND) group13. The RVD quantifies the delay time needed
for the regional impedance-time curve to reach a certain threshold of the maximal local impedance8,14–17 and is thus a measure of how fast different lung regions participate in
the ventilation process.
Clinical information derived from the machine
PulmoVista 500 is the first EIT system of its kind which continuously provides graphical information about the regional distribution of ventilation and changes of end-expiratory lung volume. The temporal resolution of this information is high and can even be presented as trend data. It can capture a relatively thick slice of the lung which might represent about 20% to 30% of the entire lung.
The Dynamic Image continuously displays relative impedance changes within the EIT sensitivity region as a movie which represents the dynamics of ventilation (Figure 2). It can generate up to 50 EIT images per second. This high temporal resolution facilitates the visualization of regional ventilation even at higher respiratory rates.
Figure 2 Representation by images of a dynamic impedance change in lungs.
Lung ultrasound
Point-of-care ultrasound is gaining increasing popularity as a useful and in some cases mandatory tool18, for instance for procedure guidance. Lung ultrasound is non-invasive
and has a steep learning curve. After 12 scans there is acceptable concordance between trainees and experts19.
Lung ultrasound can be performed with different probes, all holding their own features. Linear probes are high-frequency probes and are therefore suitable for imaging of superficial structures. They produce sound waves in a straight line, generating rectangular images. Cardiac probes are low-frequency probes, resulting in deeper penetration and a wider field of view20.
It is, however, operator-dependent and only fields immediately beneath the probe are explored21. A peculiarity of lung ultrasound findings is that they are made of both
artefacts (normal and pathological) and real images (always pathological and visible only in the absence of air interposition)3.
Lung ultrasound artefacts arise from the pleura. A-lines are horizontal hyperechoic artefacts, the presence of which indicates high gas volume ratio, associated with normal lung or pneumothorax (Figure 3).
B-lines are vertical comet-tail artefacts3 and indicate moderate to severe loss of
aeration. When more than 2 B-lines are present in a single lung region it is named as B-pattern (Figure 4). B-patterns are the sonographic sign of lung interstitial syndrome6.
Figure 4 B-lines on lung ultrasound. Although B-lines are seen in normal individuals, the number and intensity of B-lines are directly proportional to the degree of pulmonary, septal or alveolar edema.
The sonographic sign of lung consolidation (C-pattern) is an echo-poor region with or without a tissue-like echotexture (Figure 5).
Figure 5 No lung line is present, i.e. there is non pleural effusion. A tissue-like image with a mostly fractal, deep boundary with the aerated undelying lung, the shred sign (or fractal sign), makes the diagnosis of a nontranslobar lung consolidation (which is subpleural). White arrows: ribs. Black arrows: consolidation.
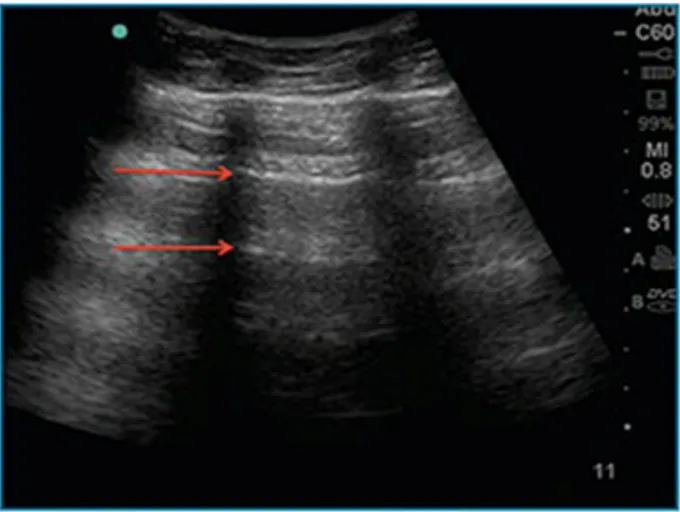
In our clinical practice we have observed lung regions expressing a sonographic mixed aeration pattern, in which a B-pattern overlaps a normal A-pattern without clearly deleting it (Figure 6). The exact impairment in lung aeration associated with mixed A/B patterns is not yet clear, possibly they are regions with moderate impairment of aeration with possible cyclic opening and closing of the lung.
Figure 6 A-lines and B-lines > 3 present together in a single clip.
RVD is caused by either cyclic opening and closing, large regional time constants, and Pendelluft, but also, aortic and cardiac activity causes oscillation and might trigger the RVD pattern22,23.
Aim
To the best of our knowledge, no studies comparing LUS and EIT have been performed and there is no clear sonographic correlation to the RVD observed by EIT. The aim of this study was to investigate if RVD regions in EIT match A/B mixed aeration pattern in LUS. We specifically hypothesized that a sonographic A/B mixed aeration pattern may contain regions with cyclic opening and closing of the lung such as RVD in EIT images.
METHODS
This was a cross-sectional, observational study, performed in the ICU of the Amsterdam University Medical Centers – location AMC (Amsterdam, the Netherlands), from June 2019 to October 2019 as a substudy of the “bedside exhaled breath octane measurements for the diagnosis and monitoring of acute respiratory distress syndrome in invasively ventilated patients” (DARTS) study24,25.
Inclusion criteria were:
- Included in DARTS study, which had the following inclusion criteria: • Invasively ventilated.
• Admitted to one of the participating ICUs.
• Expected to receive invasive mechanical ventilation for at least 24 hours.
- Patient with at least one A/B mixed aeration pattern over the 12 regions observed i.e. when 3 or more B-lines were found in a LUS clip, not erasing the A-lines, but coexisting together.
Exclusion criteria:
- Pacemaker or any electrical device (such as cardioverter-defibrillator, etc.); - Wounds or skin problems on the chest;
- Objection from nurse or physician; - Unstable spinal lesions or fractures.
Study protocol and measurements LUS protocol
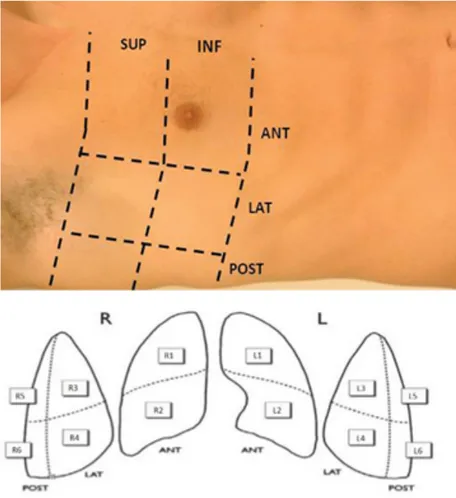
A trained examiner performed the LUS examination using a LOGIQe ultrasound machine (GE Healthcare, Little Chalfont, UK). A linear 2–5 MHz transducer was used with the probe applied longitudinally and perpendicularly to the thoracic wall. During LUS 12 different regions were scanned — 6 per hemithorax, i.e., two anterior, two laterals, and two posteriors (Figure 7).
Figure 7 12-regions lung ultrasound dividing each hemithorax into an anterior, lateral and posterior lung region, with a superior and inferior part.
Lung ultrasound scoring
To allow semi-quantification of regional lung aeration, every image was scored as: (A) presence of A-lines and less than three isolated B-lines; (B1): presence of more than 2 well-separated B-lines; (B2) presence of crowded or confluent B-lines or (C) presence of consolidative lung tissue3,20. For each region, points were allocated according to the
worst pattern observed: A=0, B1=1, B2=2, C=3 points. The regions 2, 3, 5 for each body side were used for the study as these corresponded to the ROI ventral,
mid-EIT
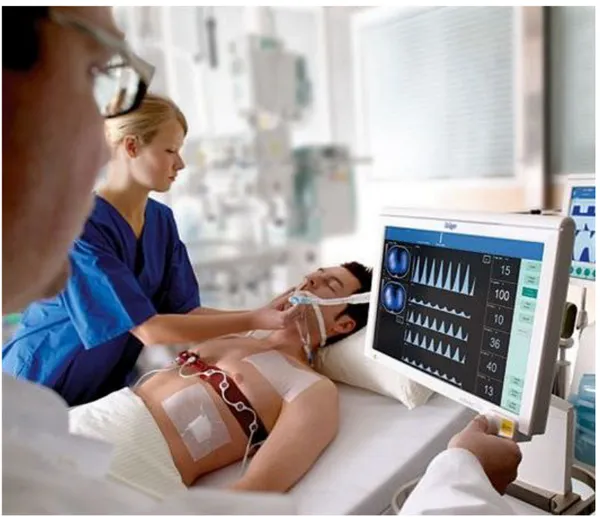
A 16-electrode silicon belt - was placed around the patient’s thorax between the 4th and 5th intercostal space9. EIT measurements for 5 minutes were executed after a
standardized procedure using a PulmoVista 500 (Dräger, Lübeck, Germany)26, (Figure 8).
Figure 8 Measurement with electrical impedance tomography (EIT), PulmoVista 500 (Dräger, Lübeck, Germany).
Offline EIT analysis
Functional EIT images were analyzed with the Dräger EIT Data Analysis Tool 6.1 (Dräger, Lübeck, Germany) and EITdiag v.1.6 (Dräger, Lübeck, Germany).
The Dräger SW EITdiag V1.6 is a dedicated software tool for advanced PC based analysis of EIT data files that have been previously recorded with PulmoVista 500.
EITdiag reconstructs EIT images and uses various previously published approaches for data interpretation with respect to regional and temporal inhomogeneity of the lung function.
The typical workflow that was used for EIT data analysis is the following: 1. EIT data files were loaded;
2. EIT sections of 4 minutes for analysis were defined;
3. EIT data were reconstructed: A low-pass filter with a cutoff frequency of 50 minute−1 was applied to exclude cardiac-related variations. Within the generated tidal images, four horizontal layers for each side were defined as regions of interest (ROIs), and labelled from ventral to dorsal: V (ventral), MV (mid-ventral), MD (mid-dorsal), D (dorsal). The last one (dorsal) was exclude because lung ultrasound (LUS) cannot be performed on paravertebral posterior regions (Figure 9).
4. Analysis:
With regard to further analyses of regional ventilation distribution, the regional ventilation delay (RVD) index was used. The RVD parameter defines the extent of the temporal delay of the regional inspiration (derived from the regional impedance waveform) in comparison with the global inspiration (derived from the global impedance waveform) for every pixel within the contour of the ventilated area. It should be correlated with regional recruitment within the lung 15:
Where t is the time. The reason for the threshold of 40% was investigated by authors which have first described this approach15. They have validated their EIT data against
CT scan and found the best correlation between EIT and CT when looking at tidal recruitment. The RVD index was developed for so-called slow inflation maneuvers using low flow breath of 12 ml/kg during MV. However in this study we used it in patients under PSV and under pressure control in an experimental manner, as previously tested
9,27. Even under spontaneous tidal ventilation, that might reduce information
considerably, we expected information from the RVD index considering spatial delays during inspiration.
In the EIT software we used a 40% threshold for the delay in tidal motion used to calculate RVD index as published by different authors8,14,16,17; and 15% for the number
of pixels in which the standard deviation during tidal motion is higher than 15% of the maximum value. 15% means that only pixels with impedance change above this threshold are considered as ventilated28. This 15% however defines the delay between
local (pixel) and global impedance curve, expressed as a percentage of the inspiratory time. The smaller the value, the more sensitive the detection of RVD is set.
The variables collected were: RVD% (calculated as mean of pixels by the software for each ROI), presence of A/B mixed aeration pattern, LUS pattern and % of B-lines
(eyeballs). B-lines were quantified in every lung field, they were counted from 0 to 100% through visual scoring by at least the mean of 3 operators to minimize inter-observer variability.
Study endpoints
The primary endpoint was the comparison between a sonographic “A/B mixed aeration pattern” and the RVD on EIT, in order to assess the cyclic opening and closing of specific lung fields. Secondary endpoint was the concordance of different lung aeration patterns on LUS for different RVD values on EIT, in order to assess potential trends in RVD among different LUS patterns. Finally, the strength of correlation between RVD and B–line score was quantified.
Statistical analysis
Datasets were tested for normal distribution through Shapiro-Wilk normality test. To assess whether RVD significantly different in regions with mixed aeration pattern, samples t-test were applied in case of normal distribution, otherwise, the Mann-Whitney test was used. To compare independent measures of RVD against a categorical ordinal variable (LUS score), we applied analysis of variance (ANOVA) or the independent samples Kruskal-Wallis test. To assess the correlation between RVD and B score Pearson’s correlation statistics was used if the data had a normal distribution or Spearman’s coefficient if non-parametric. A P-value of 0.05 was considered significant. Statistical analyses were performed using R (Version 1.0.153 – © 2009-2017 RStudio, Inc.Mozilla/5.0)
RESULTS
Five patients on invasive mechanical ventilation were included in the study. Details of patient characteristics are presented in Table 1. Out of five patients, four were under pressure support ventilation. In addition, they also had a really low PEEP level. EIT data collection was feasible in all patients while some time it was not possible to scan all lung zones due to the position of the patient. Two patients had at least one lung region that could not be scored.
Median RVD was 5.6 % (IQR RVD= Q3 – Q1 = 10.8 – 4.2 = 6.6).
RVD was not significantly increased in patients with mixed aeration pattern (P = 0.915), (Figure 11). Two regions without mixed aeration pattern presented a high RVD index. Seven regions with mixed aeration pattern presented values of RVD between 0.02 and 0.13.
No difference in RVD was found between the different LUS scores (P=0.396), (Figure
12). Three high RVD values presented three different patterns (0, 1, 2). Two regions
with a consolidation had a low value of RVD.
There was no association between RVD and B-lines score (P=0.195), (R=0.257), (Figure 13). Regions with 0% or more than 80% of B-lines presented low RVD values. Between 30% and 70% of B-lines several values of RVD were founded.
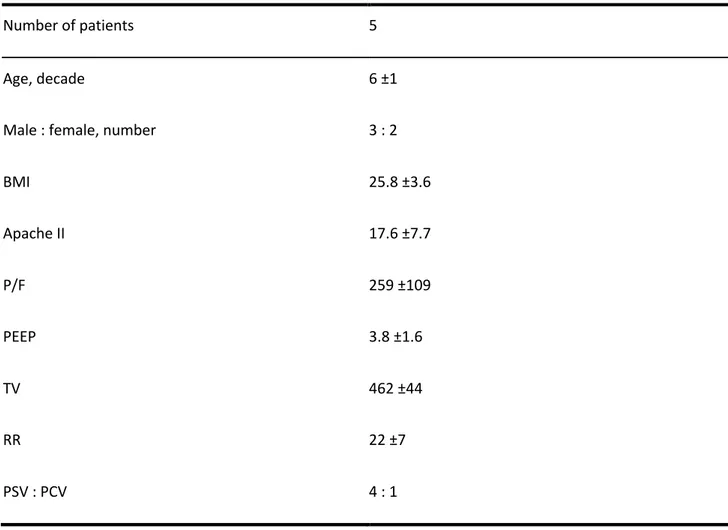
Table 1 Patients characteristics. Data are presented as mean ± SD, unless stated otherwise. BMI, body mass index; P/F, PaO2/FiO2 ratio; TV, tidal volume; RR, respiratory ratio; PSV, pressure support ventilation; PCV,
pressure-controlled ventilation.
Number of patients 5
Age, decade 6 ±1
Male : female, number 3 : 2
BMI 25.8 ±3.6 Apache II 17.6 ±7.7 P/F 259 ±109 PEEP 3.8 ±1.6 TV 462 ±44 RR 22 ±7 PSV : PCV 4 : 1
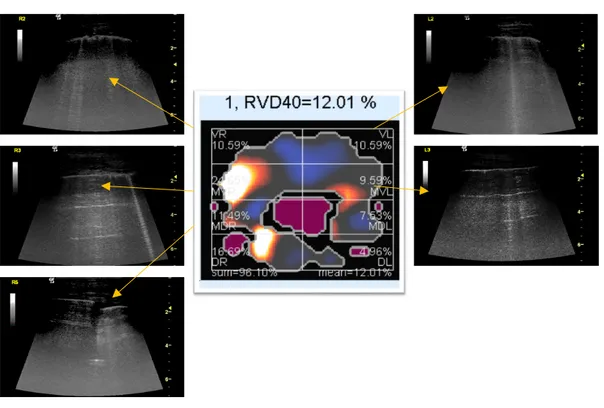
Figure 10 Example of electrical impedance tomography (EIT) image reconstruction and lung ultrasound (LUS) images. The EIT image represents the distribution of impedance to the eight regions of one representative patient. The lighter the color (yellow), the higher the regional ventilation delay (RVD). LUS images corresponding to the regions in the EIT image were shown additionally. Evaluation of LUS has been made using the whole clip because the single frame cannot show properly.
Figure 11 Red points for regions without mixed aeration pattern; yellow triangles for regions with mixed aeration pattern.
DISCUSSION
The main findings of this study were the absence of a significant correlation between the mixed aeration pattern and the RVD and more generally between the LUS patterns and RVD.
One of the strengths of this study is that so far, no study comparing LUS and EIT has been executed. In addition, this study included just patients with the presence of A/B mixed aeration pattern.
We hypothesized a possible concordance between regions with A/B mixed aeration pattern in LUS and high RVD values in EIT due to cyclic opening and closing of the airway, which was not the case. Understanding if an association is present is clinically important since patients with A/B mixed aeration pattern may then benefits from recruitment maneuvers9.
A/B mixed aeration pattern may represent congested fields and thus with a lower compliance and shorter time constants, explaining the lower RVD index. It is also possible that A and B lines are present at the same time, unless the B-lines do not entirely occupy the displayed pleura, when the scan is performed with such a good quality. We can thus conclude that A/B mixed aeration pattern is not solely explained by cyclic opening and closing or an aeration impairment. About the EIT, a pioneer paper15 validated the RVD method during a low flow breath of 12 ml/km only. They also
have validated their EIT data against CT scan and found the best correlation between EIT and CT when looking at the tidal recruitment. They decided to set the threshold to 40%. The reason of this threshold is, that in presence of superimposed cardiac oscillation, it may have large delays at the beginning of inspiration, which may solely be caused by cardiac oscillation rather than ventilation delay. This oscillation can be suppressed by low pass filtering, but it also suppresses the ventilation delay at the
Regarding the relation between RVD and LUS patterns we expected a bell curve. Indeed, when lungs are collapsed or congested, for instance where there is a consolidation, the RVD should be very low. This is also true in lungs normally aerated, A pattern, where there is not delay of aeration. The reported data provide moderate accordance comparing RVD index and B-line score. With the exception of some values lung fields without lines were normally aeriated while those with a high number of B-lines were representative of a poorly ventilated lung.
The calculation of the RVD by the Draeger program gave us the percentage of delay in time to reach a certain threshold of a certain predefined region of interest with respect to the global impedance curve. This mean is not representative for all pixels in the region of interest because most of the time pixels exhibit different delay than the average.
This study has several limitations. Firstly, the number of patients with A/B mixed aeration pattern was very low, which makes it challenging to draw firm conclusions. In addition, this study was performed whit out using an RVD values derived from original slow inflation manoeuvres using VT of 12 mL/kg BW. This might further impair our results, since, under the assumption of a constant and slow gas flow, linear reduction of the regional tidal volume should be uniform14. RVD was also calculated from regular
breaths during mechanical ventilation, assisted, and spontaneous breathing efforts8.
However, previous research17 demonstrated that a slow inflation manoeuvres is
mandatory for sufficient RVD calculation. Recently, it was demonstrated that the low inflation tidal volume during RVD measurements can be reduced to 6-9 mL/KgBW14.
However, the algorithm, which is used in the EITdiag software, does not consider that a slow inflation maneuver is required for calculating the RVD and regardless calculates RVD for each section. Hence the algorithm is not exactly correlated to that protocol where they used 12-mL/kg slow inflation maneuver15 as stated in the EITdiag user
manual27. EIT provide a picture of a whole plane of the lung but with quite poor spatial
resolution. If patients have severe damage, it might see some distortion in the EIT pictures. The LUS image has a spatial resolution that may not be sufficiently accurate. In conclusion, our experimental data carefully suggests that lung regions with A/B mixed aeration patterns do not significantly match regions with
regional-ventilation-delay on impedance tomography-based analysis and thus might not be caused by cyclic opening and closing of the lung. Further investigation into this topic is needed and useful.
REFERENCES
1. Brogi E, Bignami E, Sidoti A, et al. Could the use of bedside lung ultrasound reduce the number of chest x-rays in the intensive care unit? Cardiovasc
Ultrasound. 2017;15(1):1-5. doi:10.1186/s12947-017-0113-8
2. Danish M, Agarwal A, Goyal P, et al. Diagnostic Performance of 6-Point Lung Ultrasound in ICU Patients: A Comparison with Chest X-Ray and CT Thorax.
Turkish J Anaesthesiol Reanim. 2019;47(4):307-319. doi:10.5152/tjar.2019.73603
3. Mojoli F, Bouhemad B, Mongodi S, Lichtenstein D. Lung ultrasound for critically ill patients. Am J Respir Crit Care Med. 2019;199(6):701-714. doi:10.1164/rccm.201802-0236CI
4. Xirouchaki N, Kondili E, Prinianakis G, Malliotakis P, Georgopoulos D. Impact of lung ultrasound on clinical decision making in critically ill patients. Intensive Care
Med. 2014;40(1):57-65. doi:10.1007/s00134-013-3133-3
5. Lichtenstein DA. BLUE-Protocol and FALLS-Protocol: Two applications of lung ultrasound in the critically ill. Chest. 2015;147(6):1659-1670. doi:10.1378/chest.14-1313
6. Volpicelli G, Elbarbary M, Blaivas M, et al. International evidence-based recommendations for point-of-care lung ultrasound. Intensive Care Med. 2012;38(4):577-591. doi:10.1007/s00134-012-2513-4
7. Victorino JA, Borges JB, Okamoto VN, et al. Imbalances in Regional Lung
Ventilation. Am J Respir Crit Care Med. 2004;169(7):791-800.
doi:10.1164/rccm.200301-133oc
8. Putensen C, Hentze B, Muenster S, Muders T. Electrical Impedance Tomography for Cardio-Pulmonary Monitoring. J Clin Med. 2019;8(8):1176. doi:10.3390/jcm8081176
9. Blankman P, Hasan D, Erik GJ, Gommers D. Detection of “best” positive end-expiratory pressure derived from electrical impedance tomography parameters during a decremental positive end-expiratory pressure trial. Crit Care. 2014;18(3). doi:10.1186/cc13866
10. Karsten J, Grusnick C, Paarmann H, Heringlake M, Heinze H. Positive end-expiratory pressure titration at bedside using electrical impedance tomography in post-operative cardiac surgery patients. Acta Anaesthesiol Scand. 2015;59(6):723-732. doi:10.1111/aas.12518
11. Costa EL V, Melo A, Suarez-sipmann F, Bohm SH, Amato MBP. Bedside estimation of recruitable alveolar eit. 2009:1132-1137. doi:10.1007/s00134-009-1447-y
12. Imho ET and M. Electrical impedance tomography: The realization of regional
doi:10.1192/bjp.111.479.1009-a
13. Frerichs I, Amato MBP, Van Kaam AH, et al. Chest electrical impedance tomography examination, data analysis, terminology, clinical use and recommendations: Consensus statement of the TRanslational EIT developmeNt stuDy group. Thorax. 2017;72(1):83-93. doi:10.1136/thoraxjnl-2016-208357 14. Muders T, Hentze B, Simon P, et al. A Modified Method to Assess Tidal
Recruitment by Electrical Impedance Tomography. J Clin Med. 2019;8(8):1161. doi:10.3390/jcm8081161
15. Wrigge H, Zinserling J, Muders T, et al. Electrical impedance tomography compared with thoracic computed tomography during a slow inflation maneuver in experimental models of lung injury. Crit Care Med. 2008;36(3):903-909. doi:10.1097/CCM.0B013E3181652EDD
16. Muders T, Luepschen H, Putensen C. Impedance tomography as a new
monitoring technique. Curr Opin Crit Care. 2010;16(3):269-275.
doi:10.1097/MCC.0b013e3283390cbf
17. Muders T, Luepschen H, Zinserling J, et al. Tidal recruitment assessed by electrical impedance tomography and computed tomography in a porcine model
of lung injury*. Crit Care Med. 2012;40(3):903-911.
doi:10.1097/CCM.0b013e318236f452
18. Zieleskiewicz L, Muller L, Lakhal K, et al. Point-of-care ultrasound in intensive care units: assessment of 1073 procedures in a multicentric, prospective,
observational study. Intensive Care Med. 2015;41(9):1638-1647.
doi:10.1007/s00134-015-3952-5
19. See KC, Ong V, Wong SH, et al. Lung ultrasound training: curriculum implementation and learning trajectory among respiratory therapists. Intensive
Care Med. 2016;42(1):63-71. doi:10.1007/s00134-015-4102-9
20. Mayo PH, Copetti R, Feller-Kopman D, et al. Thoracic ultrasonography: a
narrative review. Intensive Care Med. 2019;45(9):1200-1211.
doi:10.1007/s00134-019-05725-8
21. Gino Soldati, Marcello Demi, Andrea Smargiassi RI&, Demi L. The role of ultrasound lung artifacts in the diagnosis of respiratory diseases. 2019.
22. Leonhardt S, Lachmann B. Electrical impedance tomography: The holy grail of ventilation and perfusion monitoring? Intensive Care Med. 2012;38(12):1917-1929. doi:10.1007/s00134-012-2684-z
doi:10.1186/1471-2466-14-72
26. Bickenbach J, Czaplik M, Polier M, Marx G, Marx N, Dreher M. Electrical impedance tomography for predicting failure of spontaneous breathing trials in patients with prolonged weaning. Crit Care. 2017;21(1):1-8. doi:10.1186/s13054-017-1758-2
27. Sutt AL, Anstey CM, Caruana LR, Cornwell PL, Fraser JF. Ventilation distribution and lung recruitment with speaking valve use in tracheostomised patient weaning from mechanical ventilation in intensive care. J Crit Care. 2017;40:164-170. doi:10.1016/j.jcrc.2017.04.001
28. Zhao Z, Frerichs I, Pulletz S, Müller-Lisse U, Möller K. The influence of image reconstruction algorithms on linear thorax EIT image analysis of ventilation.
ACKNOWLEDGEMENTS
I would like to express the deepest appreciation to my supervisor, teacher and friend Lorenzo Ball, who has the attitude and the substance of a genius: he continually and convincingly conveyed me a spirit of adventure in regard to research and clinical practice. Without his helps the possibility of going to Amsterdam where I performed this study would not have been possible.
My deep gratitude goes to Luigi Pisani, his unwavering enthusiasm for life and his personal generosity helped made my time in Amsterdam enjoyable from the first day. He has taught me the methodology to carry out the research and to present the research works as clearly as possible. I am extremely grateful for what he has offered me. I hope one day we will speak about the pursuit of happiness beneath a dark night sky in Africa.
I am very much thankful to Professor Marcus J. Shultz who introduced me to AMC. It was a great privilege and honour to work and study under his guidance. I think he is the fastest professor ever to reply to any doubts.
I also thank dr. Lieuwe D.J. Bos and Marry R. Smit, MSc, they helped me in any manner, and they shared the effort in order to make this research a reality. The only regret I have is that I have not spent enough time with Lieuwe since his knowledge is immense.
My sense of gratitude goes to one and all who, directly or indirectly, have lent their helping in this venture.
RINGRAZIAMENTI
La parte più bella della tesi è finalmente arrivata. Questa è anche sicuramente quella più difficile. Se già può esser faticoso fare una tesi, ecco che allora descrivere, raccontare, mettere nero su bianco le emozioni, che in questi anni ho vissuto, risulta impossibile.
Una volta qualcuno ha detto che le emozioni sono sopravvalutate, grandissima cazzata. Le emozioni sono tutto quello che abbiamo.
Penso che il giorno della laurea sia uno di quei giorni ambiti sin dall’inizio, quel sogno nel cassetto, quel sentimento di ammirazione ed invidia verso chi lo sta vivendo che ti sprona ad andare avanti nel percorso di studi, che con un caro collega abbiamo definito come una corsa a tappe sul mezzo più bello del mondo, dove per vincere il tour devi stare in gruppo, non prendere vento, comportarti bene perché fino a 3 km dall’arrivo puoi cadere o forare e lì, nei momenti di difficoltà, devi avere chi ti sostiene, chi ti rincuora e ti passa la sua ruota. In breve, devi avere sempre testa e gambe.
Così, per me, è stato. Come ho iniziato il liceo classico pensando alla cena dei 100 così ho iniziato medicina pensando al giorno in cui sarei uscito dall’aula magna con tutti gli amici e i familiari commossi a guardarmi come un valoroso protagonista, un corridore strenuo e stremato che finita la volata sul rettilineo dei campi elisi supera il traguardo sotto l’arco di trionfo con le mani alte al cielo.
E invece tutto questo non sarà esattamente come ho immaginato e la frase di Rainer Maria Rilke:
Lascia che tutto ti accada: bellezza e terrore. Continua solo ad andare avanti. Nessun sentimento è definitivo.
esprime il concetto dell’instabilità della vita e racchiude alla perfezione quello che il 19 gennaio 2015, giorno del primo esame di medicina: anatomia 1, ho capito e cioè che le cose non vanno mai come si pensa, ma c’è sempre una bellezza collaterale.
Infatti, ho sempre pensato che avrei scritto i ringraziamenti prima della tesi e invece sono qua a pochi giorni dal fatidico evento a trovare il modo migliore per trasmettere a chi legge l’estrema gratitudine che ho dentro.
Il grazie più grande va ai miei genitori. Mio padre, così lontano da me e allo stesso tempo così presente, è stato un caposaldo. Ogni giorno passato all’università, qualsiasi cosa accadesse o qualsiasi evento mi attendesse, io sapevo che avrei potuto alzare la cornetta e chiamarlo. Un “non ti preoccupare” e “quando torni a casa che mi manchi” sarebbero stati pronti a rispondere come una segreteria telefonica registrata. Grazie papà, grazie per esser sempre stato presente, grazie per quel rigore che nascondeva un bene incredibile e per non avermi mai fatto mancare nulla o sentire in colpa nel chiedertelo.
La mamma, forse una delle poche persone più insicure di me, che è stata e continua ad essere un esempio impeccabile. Perplessa fino alla fine che fosse stata la scelta giusta ma determinata a farmi raggiungere ogni mio obbiettivo. Aiutandomi, nelle lunghe sere passate a ripetere le lezioni, mi ha trasmesso l’amore per la conoscenza, con la routine del suo lavoro, che a casa non finiva, mi ha tramandato l’importanza dell’umiltà, del “primum non nocere”, della delicatezza e dell’empatia verso gli altri. Ha fatto di ogni mio problema un suo problema, di ogni mia preoccupazione una sua preoccupazione e mai di un mio successo un suo vanto.
Consegno a loro, virtualmente, il mio diploma di laurea, in segno di riconoscimento per gli sforzi sostenuti.
A mia sorella, la mia TATA, che ho sempre cercato di imitare, mi ha sostenuto di settimana in settimana, mi ha consigliato e mi ha fatto sentire vicino anche quando ero distante. Con audio, foto e video è riuscita a capovolgere la distanza tra Arma e Genova, trasmettendo a Ceci, Buba ed Amelia il suo stesso bene e senza fargli perdere mai la confidenza. Con i rilassanti pomeriggi di shopping durante il weekend ha alleggerito il carico delle tensioni che avevo e dato stile agli outfit dei giorni universitari. Grazie ai parenti acquisiti che sono entrati in famiglia con tutto l’amore di chi da sempre ne ha fatto parte. A Lorenzo e ai suoi genitori che, nascoste tra l’ironia, mi han dato
canzoni che sono stati punti di forza, importantissimi. Un grazie anche alle loro mamme che mi hanno sempre accolto come un figlio, nei lunghissimi soggiorni a casa loro, fatti per studiare.
Tutti i miei amici hanno avuto un peso, più o meno determinante, nel conseguimento di questo risultato, che è punto di arrivo e contemporaneamente di ripartenza per la mia vita; nominarli tutti sarebbe impossibile.
Da quelli più cari universitari con i quali ho studiato una quantità di esami incredibili o quelli con cui ne ho studiati pochi ma grossi, passando per quelli liceali che sono rimasti i soliti e arrivando a quelli della vita non scolastica, dico grazie.
Alla mensa che mi ha nutrito e agli arabi che mi hanno istruito: كﺑﺗﺟو ﺑﻊﺗﻣﺗﺳاوكﻟا رﻛﺷ Alla CasinaBeccioni e a tutti i coinquilini acquisiti nel tempo, da Tomo agli amici di Ema, dai compagni dei workshop della Giuggiu e Paolo, a tutti gli amici della Ire, grazie anche a voi. Avete eliminato quel senso di ritardo che avevo per esser entrato due anni dopo a medicina, lo avete raso al suolo, mi avete accolto nella comunità di Sestri Levante come se non ci fosse stata alcuna galleria a dividerci, avete davvero alleggerito i giorni di studio con distrazioni varie ed eventuali. Da semplici coinquilini siete diventati amici stretti a cui voglio veramente tanto bene.
Alla fine, vorrei fare altri due ringraziamenti: Davide Gulino e Lorenzo Sena, due fratelli ovvero due fidanzati mancati, con i quali ho passato momenti che non si potrebbero riassumere in nessun modo. Le chiamate infinite, le risate da note su registro, le firme sui diari, le camminate, le uscite, i giri in bicicletta, le feste, le serate, le cene, i pranzi, le colazioni, le cagate, sempre al telefono, le pisciate continue controvento, i selfie, i giri in montagna, le biotecnologie, le storie non riuscite, il ti presento un’amica, il pago io, lo zio, il narghilé, la felicità è un sistema complesso, la nonna, il liceo, l’università, il mare, le pallette, le pallonate, le palle, il vino, le sagre, le canzoni, le chitarre, le parole senza senso, i capelli, i cappelli e i cappellini, ferragosto, già natale, ganja, cocaina e capodanno e ancora le risate, le risate e le risate che ci faremo un giorno rileggendo questo e pensando a quando eravamo giovani, alle cose che avremmo potuto fare e che non abbiam fatto, che però ci hanno reso quello che siamo, grazie!