Proceedings 2019, 14, 3; doi:10.3390/proceedings2019014003 www.mdpi.com/journal/proceedings
Extended Abstract
Application of a Micro-Machined Electronic Nose to
Detect Escherichia Coli in Human Urine Samples
†Matteo Soprani 1,2,*, Giulia Zambotti 1,2, Emanuela Gobbi 2,3 and Andrea Ponzoni 1,2
1 Department of Information Engineering, University of Brescia, Via Branze 38, 25123 Brescia, Italy;
[email protected] (G.Z.); [email protected] (A.P.)
2 National Institute of Optics (INO), National Research Council (CNR), Via Branze 45, 25123 Brescia, Italy;
3 Department of Molecular and Translational Medicine, University of Brescia, Viale Europa 11, 25123
Brescia, Italy
* Correspondence:[email protected]
† Presented at the 8th GOSPEL Workshop. Gas Sensors Based on Semiconducting Metal Oxides: Basic Understanding & Application Fields, Ferrara, Italy, 20–21 June 2019.
Published: 18 June 2019
1. Introduction
The analysis of volatile organic compounds (VOCs) as disease biomarkers released by the urine, it permits an early and non-invasive diagnosis of Urinary Tract Infections (UTI) [1]. For this purpose, an instrumental method like the electronic nose composed by micromachined metal oxide gas sensors has been taken under consideration. Escherichia coli (E.coli) is the pathogenic microorganism responsible for up to 80% of theUTI and it is here chosen as benchmark bacterium [2]. The purpose of this research work is to test the capability of the electronic nose approach to recognise the presence of E.coli, identificative of a possible UTI disturb [3], in urine samples.
2. Materials and Methods
In the research’s work, a device named miniMOx (JLM Innovation, Tübingen, Germany) has been involved. It is equipped with two micromachined metal oxide gas sensors (MOX): TGS8100 (Figaro, Arlington Heights, IL, USA) and CSS801 (AMS, Premstaetten, Austria). The MOX are capable to work with custom temperature modulation protocols controlled though their embedded heaters. This modulation periodically activates and freezes the interaction between gaseous molecules and the metal oxide surface, producing a periodic resistance vs. time curve as a response. In particular, a square wave of a 20 seconds period was applied. A warm semi-period was settled at voltage of Vheaters: 2.31 V for 10 seconds while the cold one at the voltage of Vheater = 1.65 V for the same amount of time. The resistance vs. time curves obtained were described through the ΔRcold-hot, ΔRcold and ΔRhot parameters. The ΔRcold-hot represents the subtraction between the sensor’s resistance measured at the end of the cold period and the resistance measured at the start of the warm period after 0.2 seconds. ΔRcold signifies the difference between the sensor’s resistance measured at the end of the cold period and after 0.2 seconds or at the beginning to the same period. ΔRhot respects the warm period. In the end, a Principal Component Analysis algorithm (PCA function on Matlab) was used to elaborate the data acquired with the described parameters. Three representative samples were taken under consideration: urine, urine contaminated with a pathogenic microorganism (Escherichia coli) and sterilized water as a control. The analysis’ procedure provided to place in contact the miniMOx for a time of 5 minutes with the head- space released from the samples, interspersed with 10 minutes for the sensors’ recovery in ambient air. In parallel, bacterial counts were performed to monitor the Escherichia coli concentration during the whole analysis.
Proceedings 2019, 14, 3 2 of 3
3. Results and Discussion
A summary of the obtained results is reported in the Figure 1.
(A) (B) (C)
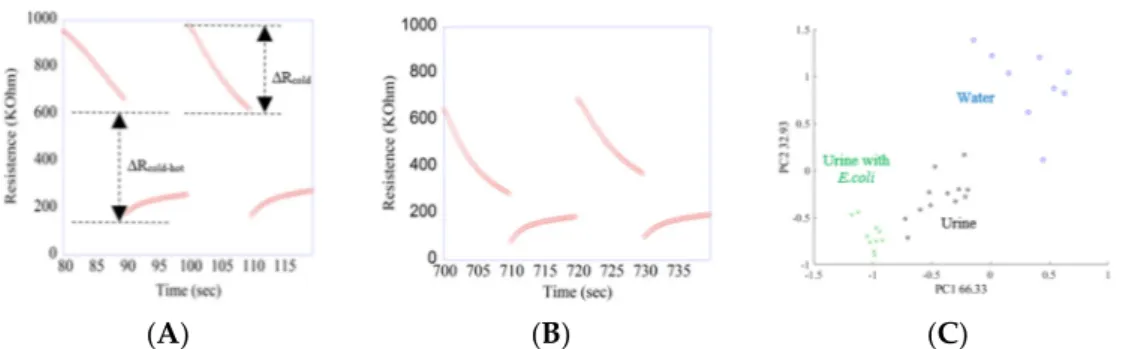
Figure 1. Resistance vs. time curves obtained with the CSS801 sensor. Two cycles of a cold and warm
semi-period recorded during the exposition to the VOCs released by urine’s samples (A). Two cycles of a cold and warm semi-period recorded during the exposition to the VOCs released by urine contaminated with E. coli samples (B). A Principal Component Plot of the MOX sensors response to the VOCs released by water (blue circles), urine (black stars) and urine with E.coli (green crosses) (C).
From the Figure 1, it is possible to observe the resistance vs. time curves acquired with the CSS801 sensor during the exposition at the VOCs released by uncontaminated urine (Figure 1A) and urine inoculated with E. coli at the initial concentration of 104 CFU/ml (Figure 1B). The resistance values are lower during the warm semi-period and larger during the semi-cold one, mainly due to thermal effect on the MOX semiconductor. The shape of these curves is sensitive to the surrounding atmosphere, with differences that can be properly resumed in terms of ΔRcold-hot and ΔRcold. PCA algorithm applied to the parameters explained before, leaded to results shown the Figure 1C. The PCA Score Plot represents a scenario with three different clusters. The blue circles for sterilized water, the black stars for the urine and the green crosses for the urine contaminated with Escherichia coli. It is possible to understand that there is a separation between the samples among the PC1 and PC2 aces. In particular, there is a separation between the two urine’s samples. Since the difference between the two urine’s samples is the E. coli presence, potentially the pathogenic microorganism is the responsible to the separation itself.
4. Conclusions
The custom measurement protocol developed with the commercial electronic nose miniMOx revealed suitable to discriminate between water, urine and urine with E. coli through the analysis of the VOCs released by them. Since E. coli causes different kind of diseases in the human body, an early detection of this pathogenic microorganism into the urine could prevent the illnesses development. In conclusion, the miniMOx could be an easy-to-use, low-cost device for the pre-screening diseases through the VOCs released by urine.
Funding: This research was funded by Lombardia Region and CNR through the project FHfFC and by
Lombardia Region and Fondazione Cariplo through the project EMPATIA@LECCO.
Conflicts of Interest: The authors declare no conflict of interest. The funding sponsors had no role in the design
of the study; in the collection, analyses, or interpretation of data; in the writing of the manuscript, and in the decision to publish the results.
References
1. Mills, G.A.; Walker, V. Headspace solid-phase microextraction profiling of volatile organic compounds in
urine: Application to metabolic investigation. Chromatogr. B Biomed. Sci. Appl. 2011, 753, 259–668.
2. Persaud, K.C.; Pisanelli, A.M.; Evans, P.; Travers, P. J. Monitoring urinary tract infections and bacterial
Proceedings 2019, 14, 3 3 of 3
3. Bernabei, M.; Pennazza, G.; Santonico, M.; Roscioni, C.; Paolesse, R.; Di Natale, C.; D’Amico, A. A
preliminary study on the possibility to diagnose urinary tract cancers by an electronic nose. Sens. Actuator. B Chem. 2008, 131, 1–4.
© 2019 by the authors. Licensee MDPI, Basel, Switzerland. This article is an open access article distributed under the terms and conditions of the Creative Commons Attribution (CC BY) license (http://creativecommons.org/licenses/by/4.0/).