1
INDOOR MOBILE MAPPING SYSTEM AND CROWD SIMULATION TO SUPPORT
SCHOOL REOPENING BECAUSE OF COVID-19: A CASE STUDY
S. Comai1, S. Costa 1, S. Mastrolembo Ventura 1,*, G. Vassena 1, L.C. Tagliabue 1, D. Simeone 2, E. Bertuzzi 1, G.W. Scurati 3, F. Ferrise 3, A.L.C. Ciribini 1
Dept. of Civil, Architectural, Environmental Engineering and Mathematics, University of Brescia, 25123 Brescia, Italy - (sara.comai, silvia.costa, silvia.mastrolemboventura, giorgio.vassena, lavinia.tagliabue, angelo.ciribini)@unibs.it, [email protected]
Dept. of Civil, Construction and Environmental Engineering, Sapienza University of Rome, 00184 Roma, Italy – [email protected]
3 Dept. of Mechanical Engineering, Politecnico di Milano, 20133 Milano, Italy – (giuliawally.scurati, francesco.ferrise)@polimi.it Commission IV
KEY WORDS: Occupancy analysis, Indoor Mobile Mapping System, Crowd simulation, Proximity modelling, Air quality analysis, SARS-CoV-2, School re-opening.
ABSTRACT:
Occupancy analyses represent a crucial topic for building performance. At present, this is even true because of the pandemic emergency due to SARS-CoV-2 and the need to support the functional analysis of building spaces in relation to social distancing rules. Moreover, the need to assess the suitability of spaces in high occupancy buildings as the educational ones, for which occupancy evaluations result pivotal to ensure the safety of the end-users in their daily activities, is a priority. The proposed paper investigates the steps that are needed to secure a safe re-opening of an educational building. A case study has been selected as a test site to analyse the re-opening steps as required by Italian protocols and regulations. This analysis supported the school director of a 2-to-10 year old school and its team in the decision-making process that led to the safe school re-opening. Available plants and elevations of the building were collected and a fast digital survey was carried out using the mobile laser scanner technology (iMMS - Indoor Mobile Mapping System) in order to acquire three-dimensional geometries and digital photographic documentation of the spaces. A crowd simulation software (i.e. Oasys MassMotion) was implemented to analyse end-users flows; the social distance parameter was set in its proximity modelling tools in order to check the compliance of spaces and circulation paths to the social distancing protocols. Contextually to the analysis of users flows, a plan of hourly air changes to maintain a high quality of the environments has been defined.
1. INTRODUCTION
The pandemic emergency due to SARS-CoV-2 has made occupancy analyses a crucial topic of the international research on building performance. The need to develop simulations to support the functional analysis of building spaces in relation to social distancing rules is an example. This became even more fundamental considering the need to assess the suitability of spaces in high occupancy buildings as the educational ones, for which occupancy evaluations result pivotal to ensure the safety of the end-users in their daily activities
1.1 Literature review
In Architecture, Engineering, Construction and Operation (AECO) field, crowd simulations have progressively emerged as an approach to design, predict and assess occupancy of indoor spaces use, in particular for building typologies that implicate extensive navigation and pedestrian movement (i.e., stations, shopping malls, airports) (Sung M., 2004) (Lovreglio R., 2018). At the same time, a few crowd simulation applications have focused on educational facilities (Mastrolembo Ventura S., 2016), often integrating crowd simulation with game-based simulations (Simeone D., 2012). In the context of the pandemic emergency due to SARS-CoV-2, occupancy analyses are arising as a crucial topic of the international research on building performance. Although the
application of crowd simulation to pandemics control strategies is quite unexplored, some research has integrated this discipline with environmental analytics: for instance, Chen (2018) enriched indoor agent-based simulation with thermal perception, comfort and responsive behaviours, while Liu (2018) included perception‐ based emotion contagion in the simulation of people’s behaviour in emergencies. Other research, instead, included more controllable aspects that are relevant for epidemics and related risk assessment, such as social distancing and exposure time (Harweg, 2020).
1.2 Structure of the paper
In the following paragraphs, a case study is described in which crowd simulation has been applied to the evaluation of operational issues in an existing school building that has to face the need for a SARS-CoV-2 school re-opening protocol with communication and analysis purposes. An indoor mobile mapping system has been also adopted for a digital survey and air quality analyses supported the evaluation of space usage based on occupancy data.
The implemented method and the results obtained are discussed. Limitations of the research and further considerations for future works are also introduced.
2. RESEARCHMETHODOLOGY 2.1 Case study
The proposed paper investigates the steps that are needed to secure a safe re-opening of a 2-to-10 year old educational building. In particular, a case study has been developed to test the implementation of a set of digital tools to support the analysis of space and use performance in relation to a SARS-CoV-2 school re-opening scenario.
An existing educational building has been selected as a test site to analyse the re-opening steps as required by the Italian regulation, which includes:
- social distancing in both circulation paths and learning spaces;
- mask wearing in circulation paths;
- temperature testing before entering school (37.5°C is the maximum temperature allowed);
- hands sanification with a hydro-alcoholic solution and frequent washing;
- micro-communities organisation; - regular room ventilation.
The school director of the 2-to-10 year old school, including three levels of education (i.e., kindergarten, nursery, primary), and her team have been actively involved in the analyses as they asked to be supported in the decision-making process that led to the safe re-opening of the school. The building is characterised by common spaces consisting of an atrium, a gym, a canteen and areas with connecting function. Moreover, building spaces are spread over four levels with the following original spatial layout: the canteen is located in the basement, 3-to-5 year old classrooms and 2-to-3 year old classrooms are located on the ground floor, additional educational spaces are on the first floor and 6-to-10 year old classrooms are located on the second floor. The educational institute selected as a test site was forced to stop face-to-face teaching activities from February 2020 to September 2020. In order to support the re-opening process, simulations to analyse (1) entrance, (2) exit and (3) lunch break movement flows have been developed with the aim to avoid crowded situations and to calculate the maximum number of students allowed in the building based on available learning spaces and circulation paths and according to the protocols and regulations in force to face Covid-19. Moreover, room ventilation has been analysed to counteract the virus spread. 2.2 Fast 3D digital survey by Indoor Mobile Mapping In order to acquire the three-dimensional geometries and digital photographic documentation of the spaces a fast Indoor Mobile Mapping (iMMS) Survey has been carried on, using and testing the innovative HERON Twin Double Head slam based mapping system (Sánchez Belenguer C. 2020). The instrument is characterized by two 16 beam lidar sensors and by a 5K resolution RGB camera (Figure 1) and can be carried as a light backpack by the operator.
Figure 1. The HERON capture head and the X Ray picture of the zero level of the building
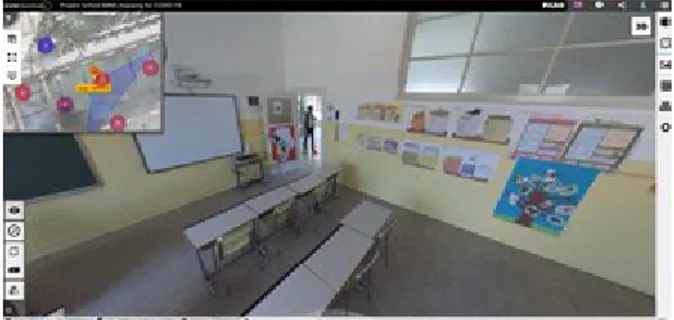
The surveying phase has been carried out in one hour walk along the various school areas, providing, as first result, a colorized 3D point cloud model (with 2 cm resolution and accuracy) and the surveyor trajectory connected with the panoramic high resolution images. As deliverables, various products have been extracted from the model and produced to the experts. Plants and elevations have been provided in the form of a X ray scaled image, importable in the most common CAD platforms or measurable using a free software tool provided with HERON. The X Ray picture is a 2,5D orthophoto extracted from the point cloud model (Figure 1) commonly used as the starting point to extract the BIM model of the site. The survey results have also been shared on the web using different web platforms, to allow all the technicians, architects and engineers involved in the project, to easily visit and measure the different elements and areas of the school. 3D Mapping Cloud from Orbit and Web Share from Faro(Figure 2) have been used to support the decision making processes. The possibility to take 3D measurements directly on the images that hide in the background the 3D point cloud, is a very useful tool, accessible also by not CAD or LiDAR experts.
Figure 2. The building can be visited and all objects measured easily moving throughout the images acquired by the Mobile
System.
The compatibility with other well known platforms, running on workstation, as Autodesk Recap and Gexcel Reconstructor have been tested with success. In both the web based and local platforms the possibility to recognize and measure objects, or the possibility to insert comments and tags into the model (using the images based interface), have been particularly useful as support to the remote collaboration among the different partners of the project.
2.3 Building model preparation and preliminary analyses for the spatial layout
6-to-10 year old classrooms are within the scope of this paragraph. Collected data related to building geometry and traditional building usage processes and timetables have been managed in a common data environment in order to support remote research activities. Based on the information obtained from both traditional documents and the digital survey, building spaces have been analysed in terms of capacity and school desks arrangement in order to determine the maximum number of students whose presence is allowed in the building and in the classrooms at the same time according to social distancing rules. A three-dimensional parametric model of the educational building has been created in a Building Information Modelling (BIM) authoring platform; preliminary analyses have been run directly in this platform in order to identify available learning spaces and evaluate the need for changes in the layout. Three are the normative texts that have been interpreted and translated into parameters in order to determine the maximum number of students allowed in the building and in learning spaces at the same time:
1. Italian decree law 18 December 1975, which contains didactic functionality indices and according to which a minimum of 1,80 square meters must be provided for each student in the classroom;
2. CTS’s (Scientific and Technical committee) technical paper of 28 May 2020, which establishes that 1 meter of interpersonal distance must be guaranteed between students in classrooms as well as in circulation paths and when moving within the classroom (dynamic meter);
3. CTS’s (Scientific and Technical committee) technical paper of 7 July 2020, which establishes that 1 meter of interpersonal distance must be guaranteed between students in classrooms, while students who are over six years old must wear masks when moving in circulation paths (static meter)
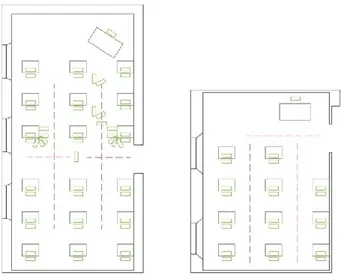
It is evident that CTS’s technical papers evolved rapidly during the last months and simulations needed to be able to face all those changes in requirements in order to support the decision-making process effectively. The results obtained from the analysis of two learning spaces with different floor areas according to the three references listed above are reported in Table 1. Spatial layouts compliant with normative requirements (2) and (3) are proposed in Figure 3 and Figure 4 respectively.
Classroom (i.e., learning space) Area (m2) (n.) Opt.1 Students (Area/1,80) Students
(n.) Opt.2 (n.) Opt.3 Students
A 55 30 18 24
B 40 22 11 18
Table 1. Maximum number of students allowed to staying in classrooms A and B according to normative text and
CTS’s technical report
Figure 3. Application of option 2 in classrooms A (left) and B (right)
Figure 4. Application of option 3 in classrooms A (left) and B (right)
As it can be seen from Table 1, normative requirements for school re-opening issued in May and July 2020 require to reduce the number of students in each classroom if compared with the pre-Covid-19 situation. For that reason, additional learning spaces needed to be identified as well in order to allow all the students to return to school safely. In particular, the total amount of floor area for 6-to-10 year old classrooms has been increased by 130 m2, more than half of the initial one (Figure 5).
Figure 5. Change of the premises' use destination on the second floor. In green the classrooms and in red the
additional educational spaces.
2.4 Crowd simulation of the school-reopening building use scenario
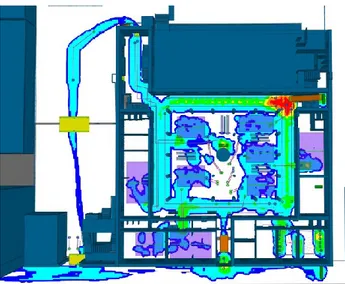
Circulation paths have been also analysed in order to evaluate the maximum number of students allowed moving within the building at the same time and, eventually, modify the school time organisation. A crowd simulation software (i.e. Oasys MassMotion) has been implemented to analyse end-users flows. Proximity modelling tools (Figure 6) included in MassMotion have been used to engineer safe social distancing and manage phased re-opening safely. The normative requirements in terms of social distancing have been set to evaluate people movement within the educational building.
Figure 6. Proximity map. Low density identified by the blue colour, high density indicated by the red colour. Three different scenarios of school daily activities have been simulated: (1) the entrance and (2) the exit of the students of all the three levels of education from the institute as well as (3) the lunch break of the 6-to-10 year old students. Two different circulation paths have been identified for the school entrance and exit, defining specific timetables for children and parents arrival and departure to and from the school in order to manage users’ flows. A thermoscanner checkpoint has been included in the simulation, as well as a hand sanification one. After these mandatory checks, students can then walk following specific paths according to their class affiliation and related organisation in micro-communities.
2.4.1 The entrance of students in the educational building In the entrance there is a wide atrium where students are asked to wait before reaching their own classroom. The organisation of this space resulted to be difficult due to the contemporaneous presence of students of different ages.
The central part of the atrium has been dedicated to 3-5 year old children (coloured squares in Figure 7), while the external one to 6-to-10 year old students (coloured circles in Figure 7). In this way, it has been possible to separate the two different levels of education. Moreover, parents have the possibility to bring their 3-5 year old children to school from 8:00 AM to 8:45 AM. 6-to-10 year old students have to enter the school on their own and use two different entrances in order to improve the circulation flows. The entrance of 6-to-10 year old students, in fact, has been divided into two different echelons: four classes enter the school from 8:00 am to 8:10 am and other four classes from 8:10 am to 8:20 am. This has been necessary to avoid both gatherings of students in the atrium and gatherings of parents outside the school. Once in the building, the students follow vertical and horizontal signs to get to waiting areas and checkpoints. Each student, for example, must stop in front of the thermo-scanner checkpoint and sanitise its hands at the hydro-alcoholic solution checkpoint before going to its own classrooms.
Figure 7. Spatial configuration of the atrium
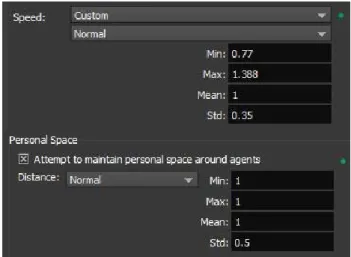
Taking into consideration all the reasoning just described about the entrance requirements, crowd simulations have been developed in MassMotion to validate them iteratively (Figure 8).
Figure 8. Profile settings used in flow simulations in MassMotion. The speed of a child was considered in m/s while
the personal space was imposed by the CTS. 2.4.2 The exit of students from the educational building The same type of reasoning have been developed for the exit movement flows in order to support the school director and her team in planning the exit timetable for each educational level as well as for each micro-community. For example, it has been possible to determine that each micro-community of 3-to-5 year old students has five minutes to exit the building from one of the two accesses; one 6-to-10 year old micro-communities, instead, can exit the building every ten minutes from the main access and other three 6-to-10 year old micro-communities from the secondary one. The secondary access allows students to reach a large space where parents can wait for their children in compliance with social distancing rules (Figure 9). This space is organised with horizontal signs highlighting the positions where each parent must stop to wait for its own child or children.
Figure 9: Simulation of the exit movement flow. 2.4.3 The lunch break
The third typology of simulation developed for this case study is related to the activities to be performed by end-users during the lunch break in order to move from learning spaces to the canteen. This represents a critical scenario in the management of daily activities in a pandemic situation as students have to stand in the canteen for twenty minutes to have lunch and so without wearing a mask. Social distancing rules become of primary importance in such a situation. It has been decided to keep 2-to-5 year old children in their own learning spaces
instead of going to the canteen. In that way, 6-to-10 year old students are the only users of the canteen during the lunch break in order to guarantee social distancing. Two hypotheses have been developed and analysed in collaboration with the school director and the responsible of the canteen service:
(1) organisation of the lunch break of the 8 primary school classes into two rounds accepting the simultaneous presence of four classes in the canteen; (2) organisation of the lunch break directly in students’
classrooms, avoiding moving to the canteen.
The second option could be considered as the most functional one because it allows students to maintain the separation in micro-communities (i.e. classes). On the other hand, the canteen service was not available to bring meals directly to the classrooms. For that reason, the first option has been further analysed.
According to the number of tables and seats available in the canteen, it has been identified the more functional layout and the maximum capacity allowed for this space (59 people) in order to guarantee the compliance of the building usage scenario against the social distancing requirements of one meter (Figure 10). For that reason, two echelons' lunch breaks have been defined: the first one from 12:30 PM to 12:55 PM and the second one from 1:20 PM to 1:45 PM. Between the two rounds there is a 25 minutes break, which is necessary to sanitise the environment as required from the national school re-opening protocols.
Figure 10. Table arrangement in the school canteen according to social distancing rules
2.5 COVID-19 Prevention Measures Signs
Horizontal and vertical signs have been prepared to communicate students the results of the analyses in terms of circulation paths and so to move from the simulations to the actual building usage. Vertical signs have been placed, distinguishing those for nursery children, made of informative figures, and those of the primary student, that in addition to the figures contains textual indications (Figure 11). Horizontal
signs are coloured "little feet" that have been used to identify waiting areas for each class of students as well as coloured arrows to highlight the direction of the students' flows (Figure 12). Finally waiting areas for parents have been highlighted with horizontal signs as well in the school courtyard.
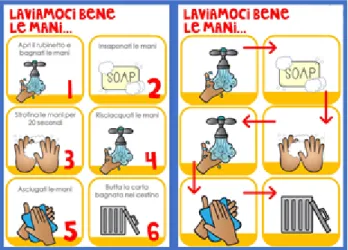
Figure 11. Vertical signs explaining students the most appropriate procedure to wash their hands
Figure 12. Horizontal signs explaining the waiting point and the direction to go
2.5 Air quality analysis
Contextually to the analysis of the flows, a plan of hourly air changes to maintain a high quality of the environments has been defined. For each learning space, the openings surface area and the total volume to calculate the normal (2 V/h) and increased (3 V/h) air exchange to prevent the spread of Covid-19 have been measured. Since rooms, in this case, are not equipped with mechanical air exchange systems, the calculation is based on natural ventilation. The ventilation analysis has made it possible to define the time required for air changes inside the classrooms for each lecture hour.
Thus the objectives to promote a healthy environment that could prevent the COVID-19 diffusion could be summarized as follows:
- ensure increased air exchange in the learning spaces compared to standard IAQ (Indoor Air Quality) ventilation (3 V/h);
- guarantee the standard ventilation rate of about 2 V/h of all environments, even in distribution spaces.
The calculation allowed to define for each space the minutes of natural ventilation of the rooms that must be implemented every hour in order to guarantee the established objectives. For this purpose, an optimization algorithm has been applied for the identification of the minutes (t) of window opening for the air exchange of the school rooms with respect to the target volume (V).
The air supply that is required to assure the IAQ in the building spaces namely the air flow, or volumetric flow rate, can be calculated using the equation (1):
𝑉̇ =∆𝑉 ∆𝑡 [
𝑚3 ℎ] (1)
Where ΔV is the volume of air replaced in the Δt time interval. Dividing the m3 entering and leaving the building in one hour by the net volume of building V [m3] gives the air exchange rate n from equation (2):
n =𝑉̇ 𝑉 [ℎ
−1] (2)
n also provides an average value of how often (per hour) the air is changed, assuming that the fresh air provided completely replaces the stale one. The value of n is defined in the standards depending on the activity and it is regulated for controlling the ventilation in the indoor spaces according with occupancy rate. The calculation of the amount of air that flows through an opening in a given time interval is given by equation (3):
𝑊 = 4382 × [0.425𝐴𝑓− 0.1126𝐴𝑓2+ 0.017𝐴𝑓3] × [0.383 (60𝑡) − 0.027 (60𝑡)2− 0.038 (60𝑡)3] [3.71 × (∆𝑡25) − 5.27 (∆𝑡 25) 2 + 2.56 (∆𝑡 25) 3 ] ℎ0.5 (3) Where:
- W is the amount of air flowing through the opening (m3);
- t is the window opening time (min); - Af is the window area (m2);
- Δt is the difference of temperature between indoor and outdoor air (°C);
- h is the window height (m).
For the case study the opening of the distribution spaces should be 11 min/h as average to allow the 2 V/h of air flow rate while for the classrooms which need 3 V/h the calculation provide an average value of 14 min/h for the nursery, 19 min/h for the classrooms of the primary section and 18 min/h for the “spring” section. In Figure 13 a calculation about the probability of infection related to ventilation rate is provided.
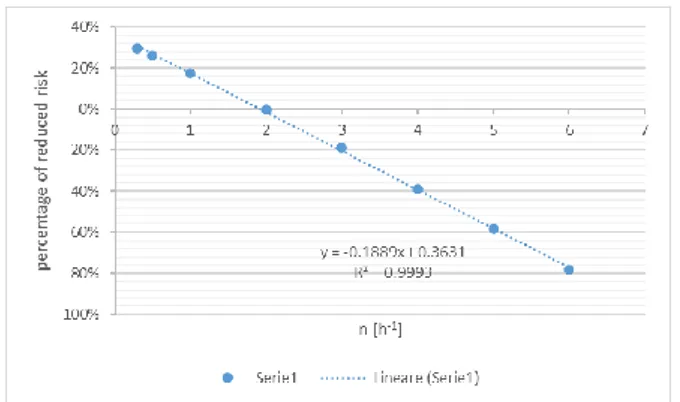
Figure 13. Probability of infection with 1 infected person in an average classroom compared to ventilation rate. Compared to the air flow standard value for the educational buildings which is 2 V/h in the teaching spaces that can support the learning performance of the students the time would be 10 min/h for the nursery and 12 min/h for the other classrooms with an average 30% of increased ventilation. The increase of the ventilation rate can reduce the probability of contamination and compatibly with the environmental and energy conditions, it is possible to promote an increase in ventilation in order to reduce the risk of infection if an infected person is present in the classroom for 50 min. (Figure 14)
Figure 14. Percentage of risk reduction with the increased ventilation rate.
3. CONCLUSIONS 3.1 Discussion of the results
The paper describes a case study in which crowd simulation has been applied to the evaluation of operational issues in an existing school building that has to face the need for a SARS-CoV-2 school re-opening protocol with communication and analysis purposes. An indoor mobile mapping system has been also adopted for a digital survey of the building. Finally, air quality analyses supported the evaluation of space usage based on occupancy data.
The crowd simulations developed for the case study have been used to support the school director of a charter school and her team providing them with the necessary information needed for an effective decision-making process in such an emergency situation with just a few weeks available to reorganise learning spaces and educational activities. The school has started the new year in September 2020 based on the results of the analyses proposed in this study thanks to the communication and analysis uses of the digital ecosystem put in place by the research team.
3.2 Limits of the research
As a limit of the research, this study does not take into account the unpredictable behaviour of 6-10 years old children. Furthermore, it relies on the effective observance of the social distancing rules on which the simulations are based on to calculate the effective maximum crowding of the environmental units. Moreover, pedagogical aspects and teaching methods are not taken into account. Further studies supported by behavioural and teaching experts in primary school would allow validating the simulations performed. Moreover, the use of agent-based simulation tools instead of crowd simulation technologies could allow evaluating the impact of unforeseen human behaviours. 3.3 Future works
In future works, the result of the analyses in terms of paths and crowding could also be used as visual pre-occupancy training for the end-users, including teachers, students and parents, in relation to the re-opening protocol launched by the school management. A serious game is being developed which, based on the simulations carried out, can be used through immersive and non-immersive virtual reality technologies to educate users to return to school safely.
ACKNOWLEDGEMENTS
The authors would like to acknowledge Oasys Software and CSPFea for the kind availability of the educational licenses of MassMotion and the precious support in using its proximity modelling tools that have been recently released.
REFERENCES
Sánchez Belenguer C., Ceriani S., Taddei P., Wolfart E., Sequeira V., 2020. Global matching of point clouds for scan registration and loop detection. Robotics and Autonomus
Systems, Elsevier, Volume 123, 103324 (2020)
Chen, L., C. R. Jung, C. R., Musse, S. R., Moneimne, M., Wang, C., Fruchter, R., Bazjanac, V., Chen, G., Badler, N. I., 2018. Crowd Simulation Incorporating Thermal Environments and Responsive Behaviors. Presence: Teleoperators and Virtual
Environments 26:4, 436-452.
Harweg T., Bachmann, D., Weichert, F., 2020. Agent-based Simulation of Pedestrian Dynamics for Exposure Time Estimation in Epidemic Risk Assessment. Physics.
arXiv:2007.04138.
Liu, Z., Liu T., Ma, M., Hsu, H., Ni Z., Chai, Y., 2018. A perception‐ based emotion contagion model in crowd emergent evacuation simulation. Computer animation and virtual worlds. 29(3-4), e1817.
Lovreglio, R., Dias, C., Song, X.,, Ballerini, L., 2018. Investigating pedestrian navigation in indoor open space environments using big data. Applied Mathematical Modelling 62, 499-509. doi.org/10.1016/j.apm.2018.06.014.
Mastrolembo Ventura, S., Simeone, D., Ghelfi, D., Oliveri, E., Angelo L.C. Ciribini, A. L.C., 2016. Building Information Modeling and Gamification for educational facilities. Back to 4.0: Rethinking the digital construction industry, 203-212. Maggioli Editore.
Simeone, D., Kalay, Y.E., 2012. An Event-Based Model to Simulate Human Behaviour in Built Environments. Proceedings
of the 30th eCAADe Conference, pp. 525-532, (2012)
Sung, M., Gleicher, M., Chenney, S., 2004. Scalable Behaviors for Crowd Simulation. Computer Graphics Forum 23 (Eurographics’04) 2004.