POLITECNICO DI MILANO
DIPARTIMENTO DI ENERGIA, Sezione INGEGNERIA NUCLEARE-CeSNEF
Rapporto Tecnico sul comportamento di miscele bifase
in generatori di vapore a tubi elicoidali con diverse
geometrie ed in soluzioni alternative
M. Colombo, A. Cammi, J. De Amicis, M.E. Ricotti
CERSE-POLIMI RL-1485/2012
Milano, Agosto 2012
Lavoro svolto in esecuzione della linea progettuale LP2– punto D.2b AdP MSE
‐
ENEA “Ricerca di Sistema Elettrico” - PAR2011Progetto 1.3.1 – “Nuovo Nucleare da Fissione: collaborazioni internazionali e sviluppo competenze in materia nucleare”.
LP2.D2b - 2 - CERSE-POLIMI RL-1485/2012 INDEX Executive Summary... ‐ 3 ‐
Part I EXPERIMENTAL CHARACTERIZATION OF PRESSURE DROPS AND CHANNEL INSTABILITIES IN HELICAL COIL SG TUBES……… Part II ASSESSMENT OF DIFFERENT TURBULENCE MODELS IN HELICALLY COILED PIPES THROUGH COMPARISON WITH EXPERIMENTAL DATA………. Part III SUPERPOSITION OF DWOs WITH LEDINEGG‐TYPE INSTABILITIES………..…… APPENDIX – EXPERIMENTAL DATABASE………..
LP2.D2b - 3 - CERSE-POLIMI RL-1485/2012
EXECUTIVE SUMMARY
This document presents the research activities carried out by Politecnico di Milano on the subject of single and two-phase flow behaviour in helical coil tubes for innovative steam generators. The R&D activities refer both to experimental campaigns, carried out at SIET labs, and modelling.
In Part I, single phase and two-phase flow are investigated, for pressure drops measurement and density waves and Ledinegg instabilities. The activity is a follow-up of the previous year investigation, where only few experimental points/operating conditions were analysed. The content of the research has been published as a scientific paper presented at ICAPP international conference.
In Part II, a CFD model is described, developed and validated versus experimental data obtained from the facility at SIET. The model will be used to simulate different geometries and boundary conditions for the helical coil tubes. Even in this case, the work has been published as a scientific paper presented at ICONE20 international conference.
Part III is specifically devoted to the description of the superposition of DWO type instability with Ledinegg type instability. This activity was required as a result of the experimental investigation at low pressure, where Ledinegg instability conditions occurred, thus a further investigation has been carried out.
LP2.D2b - 4 - CERSE-POLIMI RL-1485/2012
1
PART I
Paper presented at: ICAPP ‘12
Chicago, USA, June 24-28, 2012 Paper 12306
EXPERIMENTAL CHARACTERIZATION OF PRESSURE DROPS AND CHANNEL INSTABILITIES IN HELICAL COIL SG TUBES
Abstract - Helical tube heat exchangers provide better heat transfer characteristics, an improved capability to accommodate stresses due to thermal expansions and a more compact design with respect to straight tube heat exchangers. For these advantages they are considered as an option for the Steam Generator (SG) of many new reactor projects of Generation III+ and Generation IV. In particular, their compactness fits well with the requirements of Small-medium Modular Reactors (SMRs) of integral design, where all the primary system components are located inside the reactor vessel.
In this framework, thermal hydraulics of helical pipes has been studied in recent years by Politecnico di Milano in different experimental campaigns. Experiments have been carried out in a full-scale open loop test facility installed at SIET labs in Piacenza, Italy, to simulate the SG of a typical SMR. The facility includes two helical pipes (1 m coil diameter, 32 m length, 8 m height), connected via lower and upper headers. Following recently completed experimental campaigns dedicated to pressure drops and density wave instabilities, this paper deals with a new experimental campaign focused on both pressure drops (single-phase flow and two-phase flow, laminar and turbulent regimes) and flow instabilities. The availability of a large number of experimental data, in particular on two-phase flow, is of fundamental interest for correlation development, model validation and code assessment.
Two-phase pressure drops have been measured in adiabatic conditions, ranging from 200 to 600 kg/m2s for the mass
flux, from 30 to 60 bar for the pressure and from 0.1 to 1.0 for the flow quality. The channel characteristics mass flow rate - pressure drop has been determined experimentally in the range 10 - 40 bar, varying the mass flow rate at a fixed value of the thermal flux. In addition, single-phase pressure drops have been measured in both laminar and turbulent conditions. Density wave instabilities have been studied at mass flux from 100 to 400 kg/m2s and pressure from 10 to
20 bar , to confirm the particular behavior of the stability boundary in helical geometry at low pressure and low mass flow rate. Finally, starting from the unstable regions identified from the experimental channel characteristics, Ledinegg
LP2.D2b - 5 - CERSE-POLIMI RL-1485/2012 type instabilities have been investigated to drawn stability maps with complete stable and unstable regions in the dimensionless plane Nsub-Npch.
I. INTRODUCTION
Helically coiled pipes are nowadays under study in the nuclear field as they are considered for the Steam Generators (SGs) of some new reactor projects of Generation III+ and Generation IV. If utilized for the SG, helical tubes provide better heat transfer characteristics, together with an improved capability to accommodate thermal expansions and the possibility of a more compact design. Compactness in particular fits well with new integral Small-medium Modular Reactors (SMRs) of Generation III+, in which SGs are located inside the reactor vessel1. The problem of the flow in a curved pipe was firstly addressed by Dean2, who studied laminar flow in a toroidal pipe of small curvature with Navier-Stokes equations written in a cylindrical reference frame. In the following years the problem of single-phase flow has been deeply studied experimentally3, analytically4,5 and numerically6,7,in both laminar and turbulent conditions. The various works available in literature on the subject have been comprehensively reviewed by Berger et al.8, Shah and Joshi9 and Naphon and Wongwises10. In an helical tube, curvature acts on the flow inducing a secondary motion on the channel cross section. Fluid particles flowing faster in the core region experience an higher centrifugal force and are pushed towards the outer wall. As a consequence, two counter-rotating vortices originate on the channel cross section and the fluid recirculation promotes higher heat transfer rates together with higher friction pressure losses.
With respect to single-phase flow, comparatively less papers have been published focused on two-phase flow, therefore the availability of experimental data becomes of utmost importance for advances on the study of the phenomena involved and for the development and validation of models and correlations. The Nuclear Engineering Division of the Politecnico di Milano has been involved for a long time in experiments focused on fluid flow in helically coiled pipes. Cioncolini and Santini11,12 tested a large number of small helices of different curvature and small pitch, to study laminar to turbulent flow transition and single-phase11 and two-phase pressure drops12. Two-phase diabatic pressure drops were also measured in a full scale open loop test facility, reproducing the SG tube of an integral SMR of Generation III+13. The same test section was also included in a closed loop circuit, to study a passive heat removal system operating in natural circulation14. The facility was recently renewed to test Density Wave Oscillations (DWOs) in parallel channels, by adding a second helical tube identical to the first one (same coil diameter, pitch and length). The two helices have been connected with common lower and upper headers, to provide the constant pressure drop boundary condition required for the instability inception15.
This paper presents a new experimental campaign dedicated to both two-phase pressure drops and parallel channel instabilities. Aim of the experiments was to collect new experimental data to expand previous databases, enlarge the ranges of explored conditions and study in more detail some phenomena not adequately examined in the previous experiments. Firstly, single-phase pressure drops have been measured, adding data collected in an helical pipe of greater dimension and higher pitch to the database of Cioncolini and Santini11. Concerning two-phase pressure drops, experiments have been executed in adiabatic conditions, supplying to the preheater all the thermal power required to have two-phase mixture at the test section inlet. Only a small amount of thermal power was supplied to the test section, to balance the thermal losses. Data recorded cover the ranges 30 – 60 bar for the pressure, 200 – 600 kg/m2s for the mass flux and 0.1 – 1.0 for the mixture quality.
LP2.D2b - 6 - CERSE-POLIMI RL-1485/2012 As concerns two-phase flow parallel channel instabilities, DWOs are originated by enthalpy perturbations and respective delay propagations throughout the channel. The difference in density between the fluid entering the channel (subcooled liquid) and the fluid exiting (low density two-phase mixture) triggers delays in the transient distribution of pressure drops along the tube, which may lead to self-sustained oscillations16,17. DWOs show peculiar characteristics in helical geometry15. In particular, an increase in inlet subcooling does not preserve its destabilizing effect on the instability inception at low subcoolings, therefore the instability threshold does not exhibit the classical “L-shape” observable in straight pipes. On the contrary, inlet subcooling results strongly stabilizing at low subcoolings15. Deviations from the above described behavior were only observed at the lower values of system pressure and mass flux, at which the stability boundary seemed to agree better with the straight channel behavior described in literature16. For these reasons new experiments have been conducted, to study in more detail low system pressure and mass flux conditions, in particular at 10 and 20 bar for the pressure and from 100 to 400 kg/m2s for the mass flux.
Finally, also Ledinegg type instability has been studied, in particular in the range from 10 to 40 bar for the system pressure. Only preliminary investigated in previous experiments, in this paper Ledinegg instability is characterized in details, in particular in regions where it partially superimposes on DWOs. Ledinegg type instability occurs when a channel is operated in the negative slope region of its pressure drop – mass flow rate characteristics. Flow excursion appears as the system is forced to reach a new operating point16. Regions potentially affected by Ledinegg instability were identified with channel characteristics, experimentally derived in the ranges 10 – 40 bar for the pressure, 50 – 1000 kg/h for the mass flow rate and 20 – 60 kW for the thermal power.
The experimental facility is described in Section II, Section III presents pressure drop results, divided in single-phase flow and two-phase flow, whereas instability experimental data and channel characteristics are presented in Section IV.
II. THE EXPERIMENTAL FACILITY
The experimental facility, built and operated at SIET labs, is provided with SG full elevation and is suited for the reproduction of prototypical thermal hydraulic conditions. Coil geometry is representative of the SG pipe dimensions of a typical SMRs of integral design, coil diameter is 1 m, while pipe inner diameter is 12.53 mm. Tube length is 32 m, whereas facility height is 8 m. Two identical helical pipes are included, connected with common lower and upper headers to provide the constant pressure drop boundary condition required for the study of parallel channel instabilities. The heated pipes, which implement the common simplification given by a constant heat flux boundary (via electrical power) instead of the real controlled temperature boundary, are thermally insulated by means of rock wool. Thermal losses were evaluated via runs with single-phase hot pressurized water flowing inside the SG and estimated as a function of the temperature difference between the external tube wall and the environment13. The conceptual sketch of the new facility is depicted in Fig. 1, whereas a global view is provided in Fig. 2. Geometrical data of the two helical pipes are listed in Table I.
The whole facility is made by a supply section and a test section. The supply section feeds demineralized water from a tank to the test section, by means of a centrifugal booster pump and a volumetric feed water pump. The flow rate is controlled by a throttling valve (V3) positioned downwards the feed water pump and after a bypass line. System pressure control is accomplished by acting on a throttling valve (V4) placed at the end of the test section. An electrically heated preheater is located before the test section, to reach the desired temperature at the inlet of the test
LP2.D2b - 7 - CERSE-POLIMI RL-1485/2012 section. The test section is electrically heated via Joule effect by DC current, with the possibility to supply power separately to first 24 m and last 8 m.
TABLE I Test section main data.
Tube material SS AISI 316L
Tube inner diameter [mm] 12.53 Tube outer diameter [mm] 17.24
Coil diameter [mm] 1000
Coil pitch [mm] 800
Tube length [m] 32
Heated section length [m] 24
Riser length [m] 8
Steam generator height [m] 8
Each tube is provided at the inlet with a calibrated orifice (with a differential pressure transmitter) and a valve. The calibrated orifice is used to measure the flow rate in each channel and to visually detect the instability inception, while the valve is used to impose a concentrated pressure drop. V1 and V2 represent the total pressure drop (instrumented orifice + valve) introduced at the inlet of the two helical tubes, respectively.
LP2.D2b - 8 - CERSE-POLIMI RL-1485/2012
Storage tank V1 V2 V3 V4 Pump Throttling valve Coriolis mass flow meter Loop pressure control valve Preheater Test section Lower header Upper header Bypass line DP DP DP DP DP DP DP DP F T T P P
Fig. 1. Sketch of the experimental facility installed at SIET labs.
TABLE II
Pressure tap distribution along the test section (Channel A). Tap 1 Tap 2 Tap 3 Tap 4 Tap 5 Distance from tube inlet [m] 0.20 5.17 9.19 13.15 17.14 Tap 6 Tap 7 Tap 8 Tap 9 Distance from tube inlet [m] 21.64 25.59 29.09 32.06
The pressure at inlet and outlet headers is measured by absolute pressure transducers; nine pressure taps are disposed nearly every 4 m along one tube and eight differential pressure transducers connect the pressure taps. Detailed distances between the taps are reported in Table II. An accurate measurement of the total flow rate is obtained by a Coriolis flow-meter, placed between the pump and the preheater. Bulk temperatures are measured with K-class thermocouples drowned in a small well at SG inlet and outlet headers. Wall thermocouples (K-class) are mounted throughout the two coils, with fining near the ends to identify the risk of dryout occurrence. Electrical power is obtained via separate measurement of current (by a shunt) and voltage drop along the test section (by a voltmeter). All the measurement
LP2.D2b - 9 - CERSE-POLIMI RL-1485/2012 devices have been tested and calibrated at the certified SIET labs. A summary of the uncertainties is reported in Table III.
Pressure drops have been measured only in the pipe equipped with the pressure taps, while facility has been operated in the parallel channel configuration for instability experiments.
Fig. 2. Global view of the facility test section.
TABLE III
List of the uncertainties of physical quantities (referred to measurement values).
Water flow rate ± 1%
Fluid bulk and wall temperature ± 0.7 °C
Absolute pressure ± 0.1%
Differential pressure ± 0.4%
Supplied electrical power ± 2.5%
Evaluated thermal losses ± 15%
III. PRESSURE DROPS III.A. Single-Phase Flow
Single-phase flow pressure drops have been tested in a wide range of Reynolds numbers to study the friction factor coefficient and the laminar to turbulent flow transition. Experiments have been conducted with water at ambient temperature and pressure, varying fluid inlet velocity to explore both laminar and turbulent regions (inlet velocity range: 0.1 – 2.25 m/s). Pressure drops due to friction have been calculated subtracting the gravitational term from total pressure loss experimental data. Darcy friction factor has been evaluated by:
LP2.D2b - 10 - CERSE-POLIMI RL-1485/2012 2 exp ∆ 2 in D w ρ d p f ⋅ ⋅ ⋅ = . (1)
Experimental friction factors have been compared to the work of Cioncolini and Santini11, who tested a large number of helical pipes, characterized by different coil and pipe diameters and a small torsion. In particular, Fig. 3 compares the experimental data measured in the SIET facility with the data presented in 11 and relative to Coil8, which has the same coil diameter to pipe diameter ratio of our tube, i.e. almost the same coil curvature δ. As curvature plays the major role on friction pressure losses, data are almost overlapped, with friction coefficients from SIET facility slightly higher in the turbulent region. The last effect could be ascribed to torsion, which is significantly higher in our pipe. Accordingly to Yamamoto et al.3, friction factor at a fixed curvature first increases with torsion (expressed with torsion parameter β
0) from that of a toroidal pipe, then it decreases toward that of a straight pipe as torsion further increases.
SIET facility, although it is characterized by an higher torsion with respect to the pipe tested by Cioncolini and Santini11, has a torsion parameter β
0 = 0.019, which is not extremely high and belongs to the first region identified by Yamamoto et al.3 0.01 0.1 500 5000 50000 fD Re Coil8 SIET facility 1stDiscontinuity 2ndDiscontinuity Eq. (4) Eq. (5)
Fig. 3. Single-phase Darcy friction factors.
As observed by Cioncolini and Santini, the emergence of turbulence is a very smooth process in an helically coiled pipe and the Reynolds number necessary to have fully turbulent condition is higher with respect to a straight pipe. Two different discontinuities are encountered in the friction factor profile. A first discontinuity attests the emergence of turbulence, while a second discontinuity marks the end of the turbulence emergence process and the reaching of the fully turbulent flow condition. Between the two discontinuities, a slight depression in the friction factor profile is clearly observable. The two discontinuities are well predicted by the two following formulas11:
LP2.D2b - 11 - CERSE-POLIMI RL-1485/2012 31 . 0 1 12500 − ⎟ ⎠ ⎞ ⎜ ⎝ ⎛ ⋅ = d D Re ; (2) 57 . 0 2 120000 − ⎟ ⎠ ⎞ ⎜ ⎝ ⎛ ⋅ = d D Re . (3)
Friction factors are well predicted with the correlations proposed by Ito18, for laminar and turbulent conditions respectively: 73 . 5 5 . 0 10 5 . 0 log 56 . 1 1376 ⎥ ⎥ ⎦ ⎤ ⎢ ⎢ ⎣ ⎡ ⎟ ⎟ ⎠ ⎞ ⎜ ⎜ ⎝ ⎛ ⎟ ⎠ ⎞ ⎜ ⎝ ⎛ ⋅ ⋅ + ⎟ ⎠ ⎞ ⎜ ⎝ ⎛ ⋅ = − − d D Re d D fD ; (4) 5 . 0 25 . 0 0.029 304 . 0 − − ⎟ ⎠ ⎞ ⎜ ⎝ ⎛ ⋅ + ⋅ = d D Re fD . (5)
III.B Two-Phase Flow
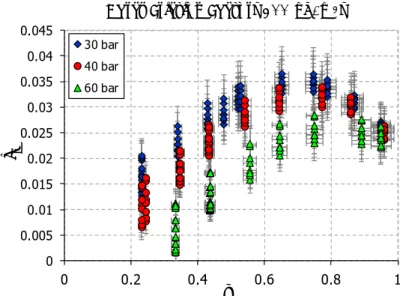
Two-phase friction pressure losses have been measured in the following operating conditions: - pressure: 30, 40 and 60 bar;
- mass flux: 200, 400 and 600 kg/m2s; - flow quality: from 0.1 to 1.0.
Experiments have been made in adiabatic condition, therefore all the thermal power was supplied to the fluid in the preheater, to reach the desired inlet flow quality value. No thermal power was supplied to the test section, except for a small amount necessary to balance the thermal losses. Thermal losses were evaluated for preheater, connection pipes and test section as in the work of Santini et al.13.
Two-phase pressure drops can be expressed with a steady-state momentum balance:
grav acc fr out in p p p p p − = ∆ +∆ +∆ . (6)
Since experiments have been conducted in adiabatic conditions, therefore with an almost constant flow quality along the test section, the accelerative pressure term can be neglected and the balance equation reduces to friction and gravitational pressure losses, that is:
LP2.D2b - 12 - CERSE-POLIMI RL-1485/2012 H ρ g d ρ L G f p p m m D out in ⋅ + ⋅ ⋅ ⋅ ⋅ = − 2 2 . (7)
Adopting the homogeneous equilibrium model (adoption of a more complex two-phase flow model is foreseen in the near future) for the mixture, the homogeneous mixture density reads:
0 0.005 0.01 0.015 0.02 0.025 0.03 0.035 0.04 0.045 0 0.2 0.4 0.6 0.8 1 fD x
Darcy Friction Factors 200 kg/m2s
30 bar 40 bar 60 bar
Fig. 4 Experimental friction coefficients at 200 kg/m2s.
0 0.01 0.02 0.03 0.04 0.05 0.06 0 0.2 0.4 0.6 0.8 1
f
Dx
Darcy Friction Factors 400 kg/m2s
30 bar 40 bar 60 bar
Fig. 5. Experimental friction coefficients at 400 kg/m2s.
1 1 − ⎟⎟ ⎠ ⎞ ⎜⎜ ⎝ ⎛ + − = v l m ρ x ρ x ρ , (8)
LP2.D2b - 13 - CERSE-POLIMI RL-1485/2012 l v l h h h h x − − = . (9)
Mixture enthalpy is calculated from an energy balance over the system preheater. The Darcy friction coefficient can be evaluated rearranging Eq. (7):
(
)
[
p p g ρ H]
L G d ρ fD m⋅ ⋅ in − out − ⋅ m⋅ ⋅ ⋅ = 2 2 . (10) 0 0.01 0.02 0.03 0.04 0.05 0.06 0.07 0.08 0.09 0 0.2 0.4 0.6 0.8 1f
Dx
Darcy Friction Factors 600 kg/m2s
30 bar 40 bar 60 bar
Fig. 6. Experimental friction coefficients at 600 kg/m2s.
The friction coefficients (Fig. 4, Fig. 5 and Fig. 6) and consequently the pressure drops exhibit a parabolic shape, as they increase with flow quality up to an x value of about 0.7, to subsequently decrease if the flow quality is increased further. This behavior was previously observed also in the work of Santini et al.13 and could be ascribed to an annular flow regime in which the liquid film becomes too thin to maintain the interface waves. Moreover, as expected, pressure drops decrease with pressure, keeping fixed system mass flow rate and flow quality.
IV. TWO-PHASE FLOW INSTABILITIES IV.A Density Wave Oscillations
DWOs were tested in twin parallel channels to study low pressure and low mass flow rate conditions and verify the behavior of the stability boundary. Previous experiments15 showed a stability boundary that deviates from the classical “L-shape” common to straight channels16. In particular, the effect of inlet subcooling was found to be stabilizing at low subcoolings, that is an increase of inlet subcooling through a decrease of water inlet temperature resulted in a more stable system. On the contrary, inlet subcooling is stabilizing at high subcoolings and destabilizing at low subcoolings
LP2.D2b - 14 - CERSE-POLIMI RL-1485/2012 in straight channels. The “L-shape” behavior was partially recorded in helical pipes only at the lower values of pressure and mass flow rate tested, equal to 20 bar and 200 kg/m2s. As a consequence, the new experiments have been performed at 10 and 20 bar and 100, 200 and 400 kg/m2s, testing a wide range of inlet temperatures.
0
2
4
6
8
10
12
14
16
10
30
50
70
N
su bN
pchStability Map p = 20 bar
G = 100 kg/m2s G = 200 kg/m2s new G = 200 kg/m2w old G = 400 kg/m2s G = 600 kg/m2s x = 0.4 x = 0.5Fig. 7 Stability maps at 20 bar at different values of the mass flux (100, 200, 400, 600 kg/m2s).
0 2 4 6 8 10 12 14 16 30 50 70 90 110
N
su bN
pchStability Map p = 10 bar
G = 200 kg/m2s G = 400 kg/m2s
x = 0.3 x = 0.4
Fig. 8. Stability maps at 10 bar at different values of the mass flux (200 and 400 kg/m2s).
Fig. 7 reports the stability maps at 20 bar in the dimensionless plane Nsub-Npch19. New data at 100 and 200 kg/m2s are reported together with previous data at 200, 400 and 600 kg/m2s15. The subcooling stabilizing effect at low subcoolings is confirmed also at 20 bar and 200 kg/m2s and 100 kg/m2s, although the results are characterized by an higher uncertainty with respect to data at the higher mass flow rates. This is due to the lower thermal power required, which
LP2.D2b - 15 - CERSE-POLIMI RL-1485/2012 causes an higher influence of the thermal loss uncertainties. In addition, an higher sensitivity characterizes the stability maps for low values of the system pressure. The same results are shown in Fig. 8, where stability maps at 10 bar and 200 and 400 kg/m2s are depicted.
DWOs are characterized by waves of heavier and lighter fluid which travel alternatively along the boiling channel16, therefore distinctive parameters are the period of oscillations and the period of oscillations over transit time ratio. Since two perturbations are required for each cycle, the period of oscillations is known from literature to be of the order of twice the mixture transit time. In particular, T is almost equal to twice the mixture transit time at high inlet subcoolings, and T/ ratio is reduced by reducing the inlet subcooling16. In helical pipes instead, the period of oscillations over transit time ratio was found to be very low at high inlet subcoolings, moreover it increased reducing the subcooling number Nsub15. This characteristic behavior is confirmed also in the new experimental data, as it is shown in Fig. 9 and Fig. 10. Period of oscillations is found to be almost independent from inlet subcooling. Accordingly, T/ ratio results considerably lower than one (~0.5) at high inlet subcoolings (when the fluid transit time in the heated channel is higher due to the long single-phase region), whereas it increases up to a value of nearly two as the inlet temperature approaches the saturation.
0.00
0.50
1.00
1.50
2.00
2.50
3.00
-0.25 -0.20 -0.15 -0.10 -0.05
0.00
T/
τ
x
inRatio period/transit time p = 20 bar
100 kg/m2s200 kg/m2s new 200 kg/m2s old 400 kg/m2s 600 kg/m2s
Fig. 9. Period of oscillation over transit time ratio at 20 bar as function of inlet subcooling and for different values of mass flux.
LP2.D2b - 16 - CERSE-POLIMI RL-1485/2012
0.00
0.50
1.00
1.50
2.00
2.50
3.00
3.50
-0.100
-0.075
-0.050
-0.025
0.000
T/
τ
x
inRatio period/transit time p= 10 bar
200 kg/m2s 400 kg/m2s
Fig. 10. Period of oscillation over transit time ratio at 10 bar as function of inlet subcooling and for different values of mass flux.
IV.B Ledinegg Instability
Ledinegg type instabilities were only partially studied in the past experiments, as flow excursions were observed during runs at the lowest pressure level (p = 20 bar), the highest mass flux (G = 600 kg/m2s), and high inlet subcooling values (xin < -15%). Ledinegg instability occurs when a heated channel operates in the negative slope region of the pressure drop versus flow rate curve (channel characteristics). In this respect, the boundary condition of constant pressure drop given by parallel channels acts as a flat pump external characteristics, forcing each channel into a wide flow excursion up to the reaching of new operating points on the internal characteristics.
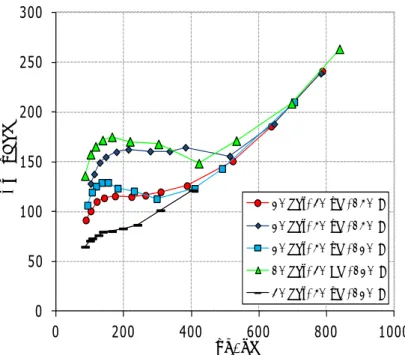
Before the experiments on Ledinegg instabilities, channel characteristics has been determined experimentally in different system conditions to identify the negative slope regions necessary to trigger the flow excursion. In particular, pressure drops have been measured at 10, 20 and 40 bar, at inlet subcoolings -0.350 < x < -0.125 and thermal power between 20 kW and 60 kW, reducing the mass flow rate starting from a liquid outlet condition to reach high quality two-phase outlet condition. Fig. 11 shows channel characteristics in different system conditions. Negative slope regions have been successfully identified, moreover their amplitude increases reducing the inlet temperature (increasing the inlet subcooling) or increasing the thermal power. The most important effect is however due to the system pressure, which acts reducing negative slope region amplitude. From Fig. 11 it is possible to predict the appearance of Ledinegg instabilities at 10 and 20 bar, whereas a small number of unstable conditions could be expected at 40 bar, as a consequence of the smaller amplitude of the negative slope region.
Ledinegg instability occurs with marked flow excursions in the two parallel channels, as shown in Fig. 12. Flow excursion is evident, as Channel A flow rate increases. On the contrary, the flow rate in Channel B reduces proportionally to preserve the imposed total mass flow rate. The constant total pressure drop condition is respected
LP2.D2b - 17 - CERSE-POLIMI RL-1485/2012 across the two tubes. Ledinegg instabilities are observed at a thermal power value much smaller with respect to DWOs and a further increase in thermal power allows to leave the unstable region.
0 50 100 150 200 250 300 0 200 400 600 800 1000 ∆ p [k P a ]
Γ
[kg/h] 20 bar, 40 kW, 150 C 20 bar, 50 kW, 150 C 20 bar, 50 kW, 120 C 10 bar, 40 KW, 120 C 40 bar, 50 kW, 120 CFig. 11 Channel characteristics determined through experiments in different flow conditions.
100 150 200 250 300 350 400 450 0 10 20 30 40 50 60 Γ [k g / h ] t [s]
Γ at Orifices
Channel A Channel BFig. 12. Flow rate recorded in the two channels during a Ledinegg transient. Data collected with: p = 20 bar; Tin = 135 °C; G = 600 kg/m2s.
q = 67.5 kW (electrical power supplied per tube).
Fig. 13 reports a complete stability map in the Nsub – Npch plane, including the DWO stability boundary and also the region affected by Ledinegg instability. Data were collected starting from a low thermal power condition with fixed system pressure, mass flow rate and inlet temperature. Power was gradually increased until the appearance of the flow excursion, then was further increased to leave Ledinegg region and reach the DWO stability boundary. For the same
LP2.D2b - 18 - CERSE-POLIMI RL-1485/2012 value of system pressure and mass flow rate, the described procedure was repeated changing the inlet temperature to explore a wide range of inlet conditions. Data were collected at 20 bar and 400 and 600 kg/m2s, 10 bar and 400 kg/m2s (Fig. 14). Some experiments were also made at 40 bar and 400 and 600 kg/m2s.
0
5
10
15
20
25
0
10
20
30
40
50
60
70
N
su bN
pchStability Map p = 20 bar
G = 400 kg/m2s G = 600 kg/m2s Led 600 kg/m2s Led 400 kg/m2s x = 0.4 x = 0.5
Fig. 13. Stability maps at 20 bar and 400 and 600 kg/m2s with both DWO stability boundary and Ledinegg
instability regions.
0
5
10
15
20
25
30
35
0
20
40
60
80
100
120
N
su bN
pchStability Map p = 10 bar
G = 400 kg/m2s Led 400 kg/m2s
x = 0.3
x = 0.4
Fig. 14. Stability map at 10 bar and 400 kg/m2s with both DWO stability boundary and Ledinegg instability
LP2.D2b - 19 - CERSE-POLIMI RL-1485/2012 Ledinegg instabilities characterize regions of low thermal power and high inlet subcooling and they vanish increasing the thermal power before reaching the DWO stability boundary. Power difference between Ledinegg disappearance and DWOs is reduced increasing the inlet subcooling as the two instability modes tend to superimpose at very high inlet subcoolings. As a consequence, the complete stability boundary shows the typical “noose” shape reported in literature16,20.
As anticipated observing channel characteristics, Ledinegg region widens increasing the inlet subcooling and also the mass flow rate, as it means an higher thermal power needed to reach the same flow quality condition. Also a decrease in system pressure promotes the instability, as it is possible to observe comparing unstable regions at 10 and 20 bar and 400 kg/m2s. In agreement with the previous analysis, at 40 bar flow excursions were recorded only in a narrow range of system conditions.
V. CONCLUSIONS
Experimental data on single-phase pressure drops, two-phase pressure drops and two-phase flow parallel channel instabilities have been collected in a full-scale open loop test facility installed at SIET labs, in Piacenza. The experimental facility includes two helical pipes connected in parallel to reproduce the SG of a Generation III+ SMR of integral design. The availability of experimental data is of great importance for the development and validation of modeling tools to study the thermal hydraulics of helical pipes, in particular concerning two-phase flow.
Single-phase pressure drops have been measured in both laminar and turbulent flow conditions to enlarge a pre-existing database with data related to a pipe characterized by a significant pitch. Two-phase pressure drops have been measured in adiabatic conditions, giving all the thermal power to the preheater to have two-phase mixture already at the test section inlet. Only a small amount of power was provided to the test section to balance the thermal losses. Data have been collected in the ranges from 30 to 60 bar for the pressure, from 200 to 600 kg/m2s for the mass flux and from 0.1 to 1.0 for the flow quality.
As concerns two-phase flow instabilities in parallel channels, DWOs are a dynamic type instability characterized by waves of “heavier” and “lighter” fluid propagating through the channel, triggered by delays in the transient distribution of the pressure drops along the pipe. New data allowed to confirm the particular behavior of the stability boundary in helical pipes also at low pressure and low mass flow rate, specifically at 10 and 20 bar and 100 and 200 kg/m2s.
Also Ledinegg type instabilities have been characterized experimentally at 10, 20 and 40 bar and 400 and 600 kg/m2s. Instability regions, located at low test section inlet temperatures, have been identified through experimental determination of negative slope regions in channel pressure drop-flow rate characteristics.
NOMENCLATURE D coil diameter [m]
d pipe diameter [m]
fD Darcy friction factor coefficient
G mass flux [kg/m2s] g gravity acceleration [m/s2]
LP2.D2b - 20 - CERSE-POLIMI RL-1485/2012 H pipe height [m]
h entalphy [kJ/kg] L pipe length [m] Npch phase change number
Nsub subcooling number
p pressure [Pa] q thermal power [kW] Re Reynolds number T period of oscillations [s] w velocity [m/s] x thermodynamic quality Γ mass flow rate [kg/s] β0 torsion parameter
δ dimensionless coil curvature ρ density [kg/m3] τ transit time [s] Subscripts acc accelerative exp experimental fr friction grav gravitational in inlet l liquid m mixture out outlet v vapor ACRONYMS DWO Density Wave Oscillation
HEM Homogeneous Equilibrium Model
SG Steam Generator
SMR Small-medium Modular Reactor
REFERENCES
1. M. D. Carelli, L. E. Conway, L. Oriani, B. Petrovic, C. V. Lombardi, M. E. Ricotti, A. C. O. Barroso, J. M. Collado, L. Cinotti, N. E. Todreas, D. Grgic, M. M. Moraes, R.D. Boroughs, H. Ninokata, D. T. Ingersoll, F. Oriolo, “The Design and the Safety Features of the IRIS Reactor”, Nuclear Engineering and Design, 230, 151-167 (2004). 2. W. R. Dean, “Note on the Motion of Fluid in a Curved Pipe, Philosopical Magazine, 4, 20, 208-223 (1927).
LP2.D2b - 21 - CERSE-POLIMI RL-1485/2012 3. K. Yamamoto, T. Akita, H. Ikeuchi, Y. Kita, “Experimental Study of the Flow in a Helical Circular Tube”, Fluid Dynamics Research, 16, 237-249 (1995).
4. M. Germano, “On the Effect of Torsion on a Helical Pipe Flow”, Journal of Fluid Mechanics, 125, 1-8 (1982). 5. T. J. Huttl, R. Friedrich, R. Friedrich, “Influence of Curvature and Torsion on Turbulent Flow in Helically Coiled Pipes”, International Journal of Heat and Fluid FlowI, 21, 345-353 (2000).
6. G. Yang, M. A. Ebadian, “Turbulent Forced Convection in a Helicoidal Pipe with Substantial Pitch”, International Journal of Heat and Mass Transfer, 39, 10, 2015-2022 (1996).
7. J. S. Jayakumar, S. M. Mahajani, J. C. Mandal, K. N. Iyer, P. K. Vijayan, “CFD Analysis of Single-Phase Flows inside Helically Coiled Tubes”, Computers and Chemical Engineering, 34, 430-446 (2010).
8. S. A. Berger, L. Talbot, L. S. Yao, “Flow in Curved Pipes”, Annual Review of Fluid Mechanics, 15, 461-512 (1983).
9. R. K. Shah, S. D. Joshi, “Convective Heat Transfer in Curved Ducts. In: S. Kakac, R, K, Shah, W. Hung (Eds.), Handbook of Single-Phase Convective Heat Transfer, Chapter 3, Wiley Interscience, New York (1987).
10. P. Naphon, S. Wongwises, “A Review of Flow and Heat Transfer Characteristics in Curved Tubes”, Renewable and Sustainable Energy Reviews, 10, 463-490 (2006).
11. A. Cioncolini, L. Santini, “An Experimental Investigation Regarding the Laminar to Turbulent Flow Transition in Helically Coiled Pipes”, Experimental Thermal and Fluid Science, 30, 367-380 (2006).
12. A. Cioncolini, L. Santini, M. E. Ricotti “Subcooled and Saturated Water Flow Boiling Pressure Drop in Small Diameter Helical Coils at Low Pressure”, Experimental Thermal and Fluid Science, 32, 1301-1312 (2008).
13. L. Santini, A. Cioncolini, C. Lombardi, M. Ricotti, “Two-Phase Pressure Drops in a Helically Coiled Steam Generator”, International Journal of Heat and Mass Transfer, 51, 4926-4939 (2008).
14. L. Santini, D. Papini, M.E. Ricotti, “Experimental Characterization of a Passive Emergency Heat Removal System for a Gen III+ Reactor”, Science and Technology of Nuclear Installations, Vol. 2010, doi: 10.1155/2010/864709, 12 pages (2010).
15. D. Papini, M. Colombo, A. Cammi, M. E. Ricotti, D. Colorado, M. Greco, G. Tortora, “Experimental Characterization of Two-Phase Flow Instability Thresholds in Helically Coiled Parallel Channels”, Proc. of the International Congress on Advances in Nuclear Power Plants, Nice, France (2011).
16. G. Yadigaroglu, “Two-Phase Flow Instabilities and Propagation Phenomena”, In: J.M. Delhaye, M. Giot, M.L. Riethmuller, Thermohydraulics of two-phase systems for industrial design and nuclear engineering, 353-396, Hemisphere Publishing Corporation, Washington (1981).
17. D. Papini, A. Cammi, M. Colombo, M. E. Ricotti, “On Density Wave Instability Phenomena: Modelling and Experimental Investigation”, A. Ashan (Ed.), Two-Phase Flow, Phase Change and Numerical Modeling, InTech Publisher, Rijeka (2011).
18. H. Ito, “Friction Factors for Turbulent Flow in Curved Pipes”, Transaction of the American Society of Mechanical Engineering Journal of Basic Engineering, D81, 123-124 (1959).
19. M. Ishii and N. Zuber, “Thermally Induced Flow Instabilities in Two-Phase Mixtures”, Proc. of the 4th
International Heat Transfer Conference, vol. 5, paper B5.11, Paris, France (1970).
20. W. Ambrosini, P. Di Marco, J.C. Ferreri, “Linear and Nonlinear Analysis of Density Wave Instability Phenomena”, International Journal of Heat and Technology, 18, 1, 27-36 (2000).
LP2.D2b - 22 - CERSE-POLIMI RL-1485/2012 Part II
Paper presented at:
20th International Conference on Nuclear Engineering collocated with the
ASME 2012 Power Conference ICONE20-POWER 2012
July 30 - August 3, 2012, Anaheim, California, USA
ASSESSMENT OF DIFFERENT TURBULENCE MODELS IN HELICALLY COILED PIPES THROUGH COMPARISON WITH EXPERIMENTAL DATA
Abstract
This paper deals with a comprehensive study of fully developed single-phase turbulent flow and pressure drops in helically coiled channels. To the aim, experimental pressure drops were measured in an experimental campaign conducted at SIET labs, in Piacenza, Italy, in a test facility simulating the Steam Generator (SG) of a Generation III+ integral reactor. Very good agreement is found between data and some of the most common correlations available in literature. Also more data available in literature are considered for comparison. Experimental results are used to assess the results of Computational Fluid Dynamics (CFD) simulations. By means of the commercial CFD package FLUENT, different turbulence models are tested, in particular the Standard, RNG and realizable k-ε models, Shear Stress Transport (SST) k-ω model and second order Reynolds Stress Model (RSM). Moreover, particular attention is placed on the different types of wall functions utilized through the simulations, since they seem to have a great influence on the calculated results. The results aim to be a contribution to the assessment of the capability of turbulence models to simulate fully developed turbulent flow and pressure drops in helical geometry.
LP2.D2b - 23 - CERSE-POLIMI RL-1485/2012 INTRODUCTION
Helical pipes and helically coiled heat exchangers are widely used in different industrial applications such as power generation, nuclear industry, process plants, heat recovery systems, refrigeration, chemical and food industry. A renewed interest is nowadays characterizing the nuclear field, as helically coiled Steam Generators (SGs) are foreseen in different new reactor projects of Generation III+ and Generation IV. Better heat transfer characteristics, compactness and a greater capability to accommodate thermal expansions, held by helical pipes, could contribute to reach the goals fixed for next generation nuclear reactors, in particular with respect to performance improvement and cost reduction. Among others, compactness fits well with new Generation III+ Small-medium Modular Reactors (SMRs) of integral design [1], where the SGs and all the primary system components are located inside the reactor vessel. Growing interest has encouraged new studies focused on helical geometry, as further work is required to better understand some of the physical phenomena involved and apply to helical pipes some of the most advanced and complex simulation tools developed for straight pipes.
The paper is focused on the single-phase turbulent flow in helical pipes. Firstly, single-phase pressure drops were measured at SIET labs, in Piacenza, Italy, in a test facility which reproduces the SG of an integral SMR of Generation III+. Experimental data are firstly compared with the most common correlations available in literature. Then, different turbulence models extensively tested and calibrated in straight pipes are applied, to assess their predictions of pressure drops and friction factor coefficients.
The problem of the flow in curved pipes has been addressed by many researchers and the large amount of works available on the subject can be found in different literature reviews [2-4]. Dean first derived a solution for laminar flow in a toroidal pipe of small curvature with Navier-Stokes equations written in a cylindrical reference frame [5]. The flow exhibited a secondary flow pattern on pipe cross section, constituted by two symmetrical counter rotating vortices. Secondary motion is induced by curvature, as fluid particles flowing faster on core region experience an higher centrifugal force and are pushed towards the outer wall. The two vortices promote fluid recirculation and lead to higher heat transfer rates and higher friction pressure losses. Besides the Reynolds number, a new parameter was discovered to characterize magnitude and shape of the secondary motion, the Dean Number, defined as:
D
d
Re
De
=
⋅
(1)In the following years different experimental studies were made [6-8] focused on both laminar and turbulent flow, leading to the development of numerous correlations able to predict the single-phase friction pressure drop [9-11]. The large number of correlations available has been reviewed in [12].
In the field of numerical study of turbulent flow, the standard k-ε turbulence model was firstly applied by Yang and Ebadian [13] to study fully developed turbulent flow and convective heat transfer in an helically coiled pipe of finite pitch. The same turbulence model was used in [14] to study turbulent developing heat transfer with FLUENT/UNS code as the numerical solver. Same authors addressed the effect of inlet turbulence on the development of flow and heat transfer [15]. Li et al. [16] simulated mixed convective heat transfer in the entrance region of helical pipes with the renormalization group (RNG) k-ε model. Kumar et al. [17] addressed the pressure drops and the heat transfer in a tube-in-tube helical coil heat exchanger with the standard k-ε turbulence model and the Computational Fluid Dynamics
LP2.D2b - 24 - CERSE-POLIMI RL-1485/2012 (CFD) package FLUENT. Jayakumar et al. [18] evaluated the performance of an helically coiled heat exchanger with the realizable k-ε model implemented in the FLUENT code. More recently, the same turbulence model was used to study pressure drops and heat transfer in an helical pipe and the effect of different geometrical parameters on the results [19]. The authors developed a correlation to predict the local value of the Nusselt number.
In spite of the numerous works focused on CFD simulations of turbulent flow in helical geometry, many of which individually validated with experimental data or previous results, a comprehensive comparison between turbulence model results is lacking. In this paper different turbulence models are compared to evaluate their capability to predict the pressure drop and the friction factor coefficient. In particular, the standard, RNG and realizable k-ε models, the Shear Stress Transport (SST) k-ω model and the second order Reynolds Stress Model (RSM) were tested. Simulations were made through the CFD package FLUENT version 6.2 [20], after a grid sensitivity study. The assessment procedure is made through comparison with experimental data and some of the most common correlations available in literature. In addition to experimental data collected at SIET labs, also data presented by Cioncolini and Santini [21] and related to helical pipes of different curvature were used. Particular attention was given to the near wall treatment, which turns out to be a key parameter for the correct prediction of the friction pressure losses. Besides standard wall function and non-equilibrium wall function, also the enhanced wall treatment implemented in FLUENT, which solves the viscous sub-layer explicitly, was tested.
SINGLE-PHASE EXPERIMENTAL DATA Experimental Facility
The experimental facility, built and operated at SIET labs, is provided with SG full elevation and is suited for prototypical thermal hydraulic condition reproduction. Coil geometry is representative of the SG pipe dimensions of a typical SMRs of integral design, coil diameter is 1 m while pipe inner diameter is 12.53 mm. Tube length is 32 m, whereas facility height is 8 m. Two identical helical pipes are included, connected with common lower and upper headers, as thermal hydraulic instabilities in parallel channels were tested recently [22]. The conceptual sketch of the facility is depicted in Fig. 1, whereas geometrical data of the two helical pipes are listed in Table 1.
Storage tank V1 V2 V3 V4 Pump Throttling valve Coriolis mass flow meter Loop pressure control valve Preheater Test section Lower header Upper header Bypass line DP DP DP DPDPDP DP DP F T T P P
LP2.D2b - 25 - CERSE-POLIMI RL-1485/2012 Figure 1 – Sketch of the experimental facility installed at SIET labs.
The whole facility is made by a supply section and a test section. The supply section feeds demineralized water from a tank to the test section, by means of a centrifugal booster pump and a volumetric feed water pump. The flow rate is controlled by a throttling valve (V3) positioned downwards the feed water pump and after a bypass line. System pressure control is accomplished by acting on a throttling valve (V4) placed at the end of the test section. An electrically heated preheater is located before the test section, and allows to create the desired temperature at the inlet of the test section. The test section is electrically heated via Joule effect by DC current, with the possibility to supply power separately to first 24 m and last 8 m.
Table 1 – Test section main data.
Tube material SS AISI 316L
Tube inner diameter [mm] 12.53 Tube outer diameter [mm] 17.24 Coil diameter [mm] 1000
Coil pitch [mm] 800
Tube length [m] 32
Heated section length [m] 24
Riser length [m] 8
Steam generator height [m] 8
Table 2 – List of the uncertainties of the measured physical quantities.
Water flow rate ± 1%
Fluid bulk and wall temperature ± 0.7 °C
Absolute pressure ± 0.1%
Differential pressure ± 0.4% Supplied electrical power ± 2.5%
Each tube is provided at the inlet with a calibrated orifice (with a differential pressure transmitter) used to measure the flow rate in each channel, and with a valve to impose a concentrated pressure drop. V1 and V2 represent the total pressure drop (instrumented orifice + valve) introduced at the inlet of the two helical tubes, respectively. The water pressures at lower and upper headers are measured by absolute pressure transducers; nine pressure taps are disposed nearly every 4 m along one tube and eight differential pressure transducers connect the pressure taps. An accurate measurement of the total flow rate is obtained by a Coriolis flow-meter, placed between the pump and the preheater. Bulk temperatures are measured with K-class thermocouples drowned in a small well at SG lower and upper headers. Wall thermocouples (K-class) are also mounted throughout the two coils. All the measurement devices have been tested and calibrated at the certified SIET labs. A summary of the uncertainties is reported in
LP2.D2b - 26 - CERSE-POLIMI RL-1485/2012 Table 2. Pressure drop measurements were made on the pipe equipped with the pressure taps.
Experimental Results
Single-phase pressure drops were tested in a wide range of Reynolds numbers to study the friction factor coefficient and the laminar to turbulent flow transition. Experiments were made with water at ambient temperature and pressure, varying fluid inlet velocity to explore both laminar and turbulent regions (inlet velocity range: 0.1 – 2.25 m/s). Pressure drops due to friction have been calculated subtracting the gravitational term from the total pressure loss. Darcy friction factor could then be evaluated by:
2 exp ∆ 2 in D u ρ d p f ⋅ ⋅ ⋅ = (2)
Figure 2 shows experimental friction factors in both laminar and turbulent regions. Also data of Coil6 form the work of Cioncolini and Santini are reported [21], as they will be used in the comparison with CFD results. Coil6 has lower pipe and coil diameters and a slightly higher dimensionless coil curvature δ with respect to the SIET pipe. On the contrary, the SIET pipe presents higher dimensionless torsion τ and torsion parameter β0. Geometrical data of the two pipes are compared in Table 3.
. Coil6 friction factors are slightly higher in the laminar region, in virtue of the higher coil curvature. Curvature effect is less important in the turbulent region, where Coil6 and SIET data are almost overlapped.
Table 3 – Geometrical parameters of the two pipes. SIET Coil6 D [m] 1 0.3629 d [m] 0.01253 0.00681 δ 0.0116 0.0188 τ 0.002906 0.000329 β0 0.0191 0.0017 0.01 0.1 500 5000 50000 fD Re Coil6 SIET facility 1stdiscontinuity 2nddiscontinuity
LP2.D2b - 27 - CERSE-POLIMI RL-1485/2012 Figure 2 – Single-phase Darcy friction factors.
As observed in [21], the emergence of turbulence is a very smooth process in helically coiled pipes and the Reynolds number necessary to achieve fully turbulent condition is higher with respect to straight pipes. Two different discontinuities are observable in the friction factor profile. A first discontinuity attests the emergence of turbulence, while a second discontinuity marks the end of the turbulence emergence process and the reaching of fully turbulent flow condition. Between the two discontinuities, a slight depression in the friction factor profile is clearly observable. In the SIET pipe, the two discontinuities are well predicted by the two following formulas, proposed in [21]:
3216 12500 31 . 0 1 ⎟ = ⎠ ⎞ ⎜ ⎝ ⎛ ⋅ = − d D Re (3) 9886 120000 57 . 0 2 ⎟ = ⎠ ⎞ ⎜ ⎝ ⎛ ⋅ = − d D Re (4) Many correlations are available in literature for the determination of the turbulent friction coefficient. In this work the correlations due to Ito [10], White [9] and Mishra and Gupta[11] are considered (Eq. (5), Eq. (6) and Eq. (7) respectively): 5 . 0 25 . 0 0.029 304 . 0 ⎟ ⎠ ⎞ ⎜ ⎝ ⎛ ⋅ + ⋅ = − D d Re fD (5) 5 . 0 25 . 0 0.048 32 . 0 ⎟ ⎠ ⎞ ⎜ ⎝ ⎛ ⋅ + ⋅ = − D d Re fD (6) 5 . 0 25 . 0 0.03 3164 . 0 ⎟ ⎠ ⎞ ⎜ ⎝ ⎛ ⋅ + ⋅ = − D d Re fD (7)
Comparison between correlations and experimental data is provided in Fig. 3. For simplicity, correlations are only related to SIET pipe. Results for the two pipes are resumed in Table 4.
Table 4 – Errors between the correlations and the experimental data.
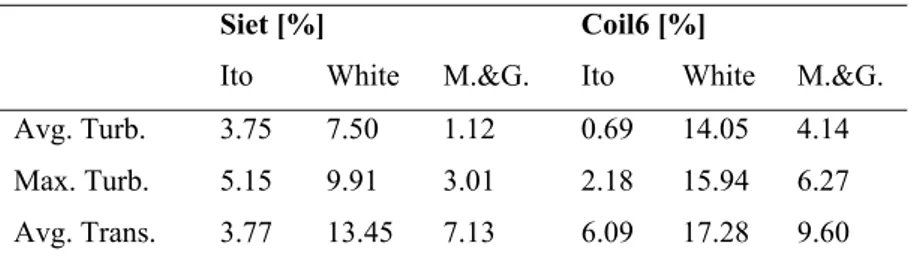
Siet [%] Coil6 [%]
Ito White M.&G. Ito White M.&G. Avg. Turb. 3.75 7.50 1.12 0.69 14.05 4.14 Max. Turb. 5.15 9.91 3.01 2.18 15.94 6.27 Avg. Trans. 3.77 13.45 7.13 6.09 17.28 9.60
LP2.D2b - 28 - CERSE-POLIMI RL-1485/2012 Max. Trans. 8.99 17.85 11.12 10.75 23.62 15.19
Ito and Mishra and Gupta correlations agree very well with the experimental data, with average errors always lower than 5% and maximum errors that do not exceed the 7%. Results are satisfactory also in the transition region, where the average error is always lower than 10%. On the other hand, White correlation overestimates the friction factor coefficient. Due to its large application in literature, the Ito correlation will be considered in the following for the comparison with CFD results.
0.02 0.025 0.03 0.035 0.04 0.045 0.05 0 10000 20000 30000 40000 50000 60000 fD Re Coil6 SIET facility Ito White Mishra & Gupta
Figure 3 – Comparison between the experimental friction factors and the literature correlations. CFD MODELING
5 different turbulence models were tested. The standard k-ε model proposed by Jones and Launder [23], with the same constant values recommended by the authors. The RNG k-ε model proposed by Yakhot and Orszag [24], derived using the mathematical technique called Renormalization Group method [25]. The model provides an analytical formula for the turbulent Prandtl number, includes the effect of swirl on turbulence and an analytically derived differential formula for effective viscosity, making it more accurate and reliable for rapidly strained flows, swirling flows and low Reynolds number flows. The realizable k-ε model [26] includes a new formulation for the turbulent viscosity and a new transport equation for the dissipation rate ε, derived from an exact equation for the transport of the mean-square vorticity fluctuations. The model is known to provide better performances for flows involving rotation, boundary layer under strong adverse pressure gradients, separation, recirculation and complex secondary flow features.
The SST k-ω model, proposed by Menter [27], applies the k-ω formulation in the inner part of the boundary layer to make the model directly usable all the way down to the wall through the viscous sub-layer. In addition the SST formulation switches to a k-ε behavior in the free stream.
The second order RSM involves calculation of the individual Reynolds stresses, using differential transport equations. The individual Reynolds stresses are then used to obtain closure of the Reynolds averaged momentum equation. More details on the model formulation can be found in [28,29].
LP2.D2b - 29 - CERSE-POLIMI RL-1485/2012 The FLUENT code allow to choose between two modeling approaches to solve the near wall region of a turbulent flow, the wall function approach and a near wall model in which the near wall region is completely resolved all the way to the viscous sub-layer. Both approaches were tested to compare their results.
With the wall function method, the viscosity affected region and the fully turbulent region are bridged with semi-empirical formulas and the viscosity affected inner region is not resolved. Two types of wall function were tested, the standard two-layer based wall function [23] and the non-equilibrium wall function [30]. In both cases, the expression for velocity in the region between the wall and the first mesh node reads:
+
= y
u
u
/
*
y
+<
11
.
225
(8)(
⋅
+)
⋅
=
ln
E
y
K
u
u
/
*
1
y
+≥
11
.
225
(9)The non-equilibrium wall function adds to the standard treatment a sensitivity of the mean velocity log-law to pressure gradient effects.
On the other hand, the FLUENT enhanced wall treatment considers a two layer model in which the viscosity affected near wall region is resolved all the way to the viscous sub-layer, provided that the mesh is sufficiently fine.
Grid and numerical settings
The commercial CFD package FLUENT was used for the simulations. Momentum and turbulence model equations were discretized using the second order upwind scheme and the SIMPLEC algorithm was used to resolve the coupling between velocity and pressure. Convergence criterion used was 10-5 for velocities and 10-4 for k, ε, ω and Reynolds stresses.
An helical pipe section geometrically identical to the one installed at SIET labs was simulated. Length of the pipe (about 3/4 of a turn) guarantees fully developed turbulent conditions, together with the correct evaluation of the pressure drop and the friction factor coefficient in the fully developed region. It must be noticed that fully developed conditions are reached within a shorter tube length with respect to straight pipes and the flow could be considered fully developed in about a quarter of a turn. At the inlet, uniform profiles for all the dependent variables were employed:
0 0
0
,
=
,
ε
=
ε
=
u
k
k
u
(10)Pressure is fixed in the outlet section, no-slip boundary conditions are imposed at the wall and turbulence intensity I and the turbulence characteristic length scale L are imposed in the inlet section. In particular, I is defined as u’/u·100% and L is set to be 0.07·(d/2). A structured (block structured) grid was implemented to discretize the governing equations, with five blocks applied to form the helically coiled pipe as shown in Fig.4. The same geometry and grid were developed to reproduce the Coil6 of the work of Cioncolini and Santini [21], scaling dimensions with the correct geometrical parameters.
Two different grid independence study were carried out to define the correct grid to be used with the wall function approach and with the enhanced wall treatment. In fact, it is well known that although FLUENT uses the linear
LP2.D2b - 30 - CERSE-POLIMI RL-1485/2012 (laminar) law when y+<11.225, the first grid point should be located far enough to avoid a fine mesh in the near wall region, as the wall function cease to be valid in the viscous sub-layer.
Figure 4 – Grid used for the SIET pipe with the wall function approach.
On the contrary, the enhanced wall treatment needs a first grid point y+ value well inside the viscous sub-layer (y+< 4 - 5) at least, with a most ideally value of the order of y+=1. In the following, grid related to the wall function approach will be referred as mesh 1, while grid related to the enhanced wall treatment as mesh 2.
For mesh 1, 6 different grids were considered respectively for SIET pipe and Coil6. The results, obtained with the k-ε model with standard wall function, are resumed in Table 5. In both coils, at the beginning the grid refinement seems to have no effect, as the friction factor coefficient remains almost constant, then it starts to increase when the number of grid nodes is increased further. The latter effect clearly indicates how an excessively fine mesh in the near wall region is unsuited for the wall function approach. Grid selected were 1125 x 240 and 605 x 280 for the two cases respectively, as they allow to obtain more detailed definition of all the other physical quantities of interest in addition to the friction factor coefficient.
Table 5 – Grid independence study for mesh 1.
SIET pipe Coil6
Grid fD Grid fD 405 x 240 0.0266 245 x 224 0.0268 720 x 240 0.0270 405 x 224 0.0265 1125 x 240 0.0275 605 x 280 0.0265 2000 x 240 0.0323 605 x 320 0.0266 2420 x 240 0.0339 1125 x 280 0.0273 4500 x 240 0.0380 2000 x 280 0.0306
Mesh 2 was determined for both SIET pipe and Coil6 with the realizable k-ε model and the results are resumed in Table 6. Refining the grid, friction factor coefficient lowers until the difference with the values calculated with the next finer
LP2.D2b - 31 - CERSE-POLIMI RL-1485/2012 grid becomes negligible. Grid selected to be used with the enhanced wall treatment are 4500 x 240 and 3125 x 280 respectively.
Table 6 – Grid independence study for mesh 2.
SIET pipe Coil6
Grid fD Grid fD 1125 x 240 0.0372 605 x 280 0.0288 2420 x 240 0.0367 1125 x 280 0.0291 3125 x 240 0.0358 2000 x 280 0.0297 4500 x 240 0.0341 3125 x 280 0.0300 5120 x 240 0.0340 4500 x 280 0.0300 RESULTS AND DISCUSSION
Figure 5 and Figure 6 compare the friction factor experimental data with the simulations from the three k-ε models with the standard wall function. The results are satisfactory for medium-high Reynolds numbers, where results of all the three models are almost overlapped and deviations from the experimental values and the Ito correlation are under 10% on average (Figure 5). 0.02 0.025 0.03 0.035 0.04 15000 20000 25000 30000 35000 40000 45000 50000 fD Re Exp k-eps RNG Real Ito
Figure 5 - Comparison between experimental data, Ito correlation and k-ε models with standard wall function for the SIET pipe in the medium-high Reynolds number region.
For medium-low Reynolds numbers, on the contrary, the k-ε models highly overestimate the friction factor coefficient, not only in the transition region, where the CFD friction coefficients have values approximately double with respect to experimental measurements, but also in the first section of the fully turbulent region. The results of the standard k-ε model could be considered satisfactory starting from Reynolds numbers up to 20000, as both the model and the standard wall function are known to provide better predictions at high Reynolds numbers. The results of the RNG k-ε model do not differ remarkably from the standard k-ε, so the comments previously made could be extended to the RNG model, which also becomes reliable starting from a Reynolds number of about 20000.
LP2.D2b - 32 - CERSE-POLIMI RL-1485/2012 0.02 0.03 0.04 0.05 0.06 0.07 0.08 0 10000 20000 30000 40000 50000 fD Re Exp k-eps RNG Real Ito
Figure 6 – Comparison between experimental data, Ito correlation and k-ε models with standard wall function for the SIET pipe.
0.02 0.025 0.03 0.035 0.04 10000 20000 30000 40000 50000 60000 fD Re Exp k-eps RNG Realizable Ito
Figure 7 - Comparison between experimental data, Ito correlation and k-ε models with standard wall function for Coil6.
Slightly better results are given by the realizable k-ε model, which predicts a lower friction factor coefficient at low Reynolds numbers and shows satisfactory results also in the region 15000 < Re < 20000. The overestimation of fD in the low Reynolds number region seems strictly related to the wall function approach, as the dimensionless distance between the first grid point and the wall reduces with the Reynolds number down to values belonging to the viscous sub-layer. Similar results are found for Coil6 (Figure 7), with friction pressure losses overestimated up to Reynolds values of 15000 for the realizable model and about 20000 for the standard k-ε and the RNG models. Deviations from experimental data in the medium-high Reynolds number region remains under 10%.
LP2.D2b - 33 - CERSE-POLIMI RL-1485/2012 0 0.01 0.02 0.03 0.04 0.05 0.06 0.07 0.08 0.09 0.1 5000 15000 25000 35000 45000 55000 fD Re Exp Realizable k-eps non RNG non Real non
Figure 8 - Comparison between experimental data, realizable k-ε model with standard wall function and k-ε models with non-equilibrium wall function for Coil6.
Worse results are obtained with the non-equilibrium wall function. As a matter of fact friction factors do not differ with respect to the standard wall function for medium-high Reynolds, whereas deviations from experimental data become higher in the low Reynolds number region. Figure 8 shows results for the three k-ε models.
RSM introduces an higher degree of detail and complexity with respect to the k-ε model. Results obtained with the RSM and standard and non-equilibrium wall functions are resumed in Figure 9. No significant differences are found with respect to the realizable k-ε model, in both low and high Reynolds number regions. Also in this case, the non-equilibrium wall function worsens the model behavior at low Reynolds numbers. It seems that the higher complexity and computational expense introduced with the RSM are not justified, at least as long as the wall function approach is adopted in the near wall region.
0.02 0.03 0.04 0.05 0.06 0.07 0.08 0.09 0 10000 20000 30000 40000 50000 fD Re Exp RSM RSM non Realizable Ito
Figure 9 - Comparison between experimental data, realizable k-ε, RSM with standard wall function and RSM with non-equilibrium wall function for the SIET pipe.
To sum up, the realizable k-ε model with the standard wall function provides the best results, although the wall function approach seems to be unable to correctly predict the friction factor coefficient for low-medium Reynolds numbers. In


![Figure 2 shows experimental friction factors in both laminar and turbulent regions. Also data of Coil6 form the work of Cioncolini and Santini are reported [21], as they will be used in the comparison with CFD results](https://thumb-eu.123doks.com/thumbv2/123dokorg/5614416.68292/27.892.266.618.705.1167/figure-experimental-friction-turbulent-cioncolini-santini-reported-comparison.webp)