RESEARCH
Improving knowledge on the activation
of bone marrow fibroblasts in MGUS and MM
disease through the automatic extraction
of genes via a nonnegative matrix factorization
approach on gene expression profiles
Angelina Boccarelli
1*, Flavia Esposito
2, Mauro Coluccia
3, Maria Antonia Frassanito
1, Angelo Vacca
1and Nicoletta Del Buono
2Abstract
Background: Multiple myeloma (MM) is a cancer of terminally differentiated plasma that is part of a spectrum of blood diseases. The role of the micro-environment is crucial for MM clonal evolution.
Methods: This paper describes the analysis carried out on a limited number of genes automatically extracted by a nonnegative matrix factorization (NMF) based approach from gene expression profiles of bone marrow fibroblasts of patients with monoclonal gammopathy of undetermined significance (MGUS) and MM.
Results: Automatic exploration through NMF, combined with a motivated post-processing procedure and a path-ways analysis of extracted genes, allowed to infer that a functional switch is required to lead fibroblasts to acquire pro-tumorigenic activity in the progression of the disease from MGUS to MM.
Conclusion: The extracted biologically relevant genes may be representative of the considered clinical conditions and may contribute to a deeper understanding of tumor behavior.
Keywords: Myeloma multiple, MGUS, Fibroblast, Bone marrow microenvironment, NMF, Pathways analysis, Cross-talk
© The Author(s) 2018. This article is distributed under the terms of the Creative Commons Attribution 4.0 International License (http://creat iveco mmons .org/licen ses/by/4.0/), which permits unrestricted use, distribution, and reproduction in any medium, provided you give appropriate credit to the original author(s) and the source, provide a link to the Creative Commons license, and indicate if changes were made. The Creative Commons Public Domain Dedication waiver (http://creat iveco mmons .org/ publi cdoma in/zero/1.0/) applies to the data made available in this article, unless otherwise stated.
Background
Myeloma multiple (MM) is an incurable disease that affects B cells, characterized by the presence of a mono-clonal component of plasma cells (PC) in the bone mar-row, immunodeficiency, hematopoietic suppression and bone lesions. It accounts for 1% of all cancers and 10% of all haematological malignancies [1]. The growth, infil-tration and “homing” of the myeloma cells, as for other cancers, depend on their dynamical interaction with the micro-environment [2]. The bone marrow micro-environment contains a heterogeneous population of
cells: hematopoietic stem cells (HSC), stem cells of the bone mesenchymal (BMSCs), vascular endothelial cells and nerve fibres. The BMSCs give rise to a variety of cell types: osteoblasts and osteocytes, adipocytes, chondro-cytes and fibroblasts. Certain types of cancers such as adenocarcinoma of the prostate, breast, kidney or lung uses the bone micro-environment as the site of metasta-sis being this a rich source of growth factors and signaling [3, 4]; on the other hand, for blood cancers, such as MM, the bone marrow is necessary for survival [5]. Indeed, the bone marrow niche appears to play an important role in differentiation, migration, proliferation, survival, and drug resistance of the malignant plasma cells provid-ing the preclinical evidences for targetprovid-ing MM cells and BMSC as an antitumor strategy in this disease [6]. In the evolution of MM disease, the increase in the monoclonal
Open Access
*Correspondence: [email protected]
1 Department of Biomedical Science and Human Oncology, University
of Bari Medical School, Piazza Giulio Cesare 11, 70124 Bari, Italy Full list of author information is available at the end of the article
component of PCs in the bone marrow micro-environ-ment deeply changes homeostasis and interaction with stromal cells. Growth and survival of PCs increases through deregulation of autocrine and paracrine path-ways mediated by growth factors, cytokines, angiogenic factors, mRNAs and miRNAs exchanged with exosomes produced by the various stromal components [7–9] and all aberrant stimuli promotes bone destruction [10, 11].
In myeloma study an interesting area of research con-cerns the understanding of the transformation from precancerous condition [i.e. monoclonal gammopathy of undetermined significance (MGUS)] to a malignant form of the disease. Since MM has a progression of the MGUS clinical condition at a rate of 1% per year of the patients considered [1], the genetic aberrations observed in MGUS are considered to be primary events and once the MGUS clone has been established, immortalization is not enough to promote myeloma progression. In con-trast, events in the MM stages that were absent in MGUS are probably secondary events leading to tumor progres-sion [12]. The key questions to be answered in this pro-cess are: “why does a clone in MGUS become aggressive in some patients while remaining stable in others”; also “is the different clone behavior dictated by genomic fea-tures or is it the result of a plasma cells dialogue and their environment?” The evolving genetic and micro-environmental changes reflect into the progression of the disease. There are concomitant changes in the micro-environment, with a balanced shift between tumor-pro-moting cells and cancer-suppressing cells, which occur simultaneously with genetic changes in the plasma cell. How these two situations intertwine to mediate myeloma progression is unclear [12].
Studies on the bone marrow stromal component have underlined its important role in the progression of mye-loma disease [6, 13, 14]. In solid tumors, it has long been known that in the tumor micro-environment cells are selected as the “activated fibroblasts” (CAFs) [15] that modulate and affect the behaviour of neoplastic cells in order to promote or inhibit growth. These pleiotropic functions highlight the inherent plasticity of fibroblasts; hence learning to the mechanisms that promote them provide new ways to understand and act therapeutically in malignant tumors [16–18]. The CAF is essential in the growth of the primary tumor and in the formation of metastases and it has been observed that in bone marrow it has a role in plasma cell dyscrasias such as MGUS and MM [19–21].
In the light of recent biological studies, the identifica-tion of genes potentially involved into the development of MM can facilitate the understanding of the disease etiology and contribute to the advancement of diag-nostic tools and clinical research knowledge. However,
the automatic extraction of valuable knowledge from microarray data is very challenging since thousands of genes are involved, but only a limited number of sam-ples is available. From a mathematical point of view, this problem is characterized by high data dimension-ality. Mathematical methods based on matrix decom-position techniques could be used to explore gene expression data to automatically extract informative patterns to be further investigated from a biological point of view. Particularly, dimensionality reduction methods have many applications in bioinformatics and computational biology since these algorithms act on microarray data reducing the high dimensional gene space (n) to a lower dimensional ( r << n ) gene com-ponent space, which is representative of some latent information embedded into the original data [22, 23]. Moreover, dimensionality reduction mechanisms can be used as the first step in classification procedure to help in extracting attribute or dimension which are considered highly relevant with respect to a given class [24–26]. Nonnegative matrix factorizations (NMFs) are data reduction and exploration algorithms which emerge in literature panorama as useful tools for ana-lysing gene expression data because of their inher-ently non-negativity property [27–30]. NMF methods exhibit a number of properties, being able to (i) find sets of genes co-operating in a relatively tightly regu-lated manner [31]; (ii) recognize potential relationships in large biological data samples and link genes to these patterns [28, 32]; (iii) uncover distinct genomic sub-types in cancer patients [33]. Differently from classical techniques for dimensionality reduction, such as PCA or SVD, which contain both positive and negative val-ues in the decomposed factor matrices, NMF is able to decompose data matrices with factors only contain-ing non-negative values, representcontain-ing in this way the original data by only additive, not subtractive, combi-nations of the basis vectors (metagenes). This parts-based representation of NMF is appealing because it reflects the intuitive notion of combining parts to form a whole and could better uncover meaningful biologi-cal interpretation of data matrix [27, 28, 34, 35]. In this study, we developed a NMF-based approach to mine the genetic expression of fibroblasts of patients with MGUS and MM for automatically extracting genes that can be associated with the activation of bone marrow fibroblasts in MM patients. The NMF-based extraction method together with an ad hoc designed post-pro-cessing procedure allowed to extract from a large set of fibroblast genes very few genes which underwent to biological functional analysis. The interpretable knowl-edge obtained thanks to the synergic use of mathemati-cal and biologimathemati-cal data analysis complement existing
biological hypothesis on a certain influence of fibro-blasts that have acquired tumorigenic properties in the progression of the disease from MGUS to MM.
Methods
Patients and samples processing
Eighteen patients fulfilling the International Myeloma Working Group diagnostic criteria for MM (n = 10) and MGUS (n = 8) were studied at diagnosis [1]. The MM patients (8 male, 2 female) were staged as IIA (n = 3), IIIA (n = 7); the M-component was Ig G (n = 5), Ig A (n = 2), and k (n = 8) or (n = 2) [36]. The MGUS patients (6 male, 2 female) were Ig G (n = 6) or Ig A (n = 2). The study was approved by the local ethics committee of the University of Bari Medical School, Italy, and all patients gave their informed consent in accordance with the Dec-laration of Helsinki (https ://www.wma.net). Fibroblasts isolated from each of 18 patients were distinctly used in all experiments [20]. Table 1 summarizes clinical param-eters of the bone marrow donors. Briefly, bone marrow aspirates were centrifuged on ficoll-Hypaque gradient centrifugation, and the separated mono-nuclear cells were left to adhere to 25-cm2 polystyrene flasks in com-plete medium (RPMI-1640 medium supplemented with 10% fetal calf serum (FCS) and 1% glutamine) for 24 h in culture conditions.
Adherent cells were stromal cells were harvested in trypsin/ethylenediaminetetraacetate (EDTA) solution (0.05/0.02% in phosphate-buffered saline, [PBS]), washed twice with PBS, suspended in FCS-free medium (SFM), and immune-depleted of macrophages and possible residual plasma cells by a 30-min incubation in CD14 (a monocyte-macrophage marker) plus CD38 (a plasma cell and hematopoietic cell marker) monoclonal antibody (MoAb) coated flasks (Immuno-tech, Coulter). The fibro-blasts were separated using anti-fibroblast micro-beads and their positive fraction wss collected bone marrow fibroblasts purified are grown in 75 cm2 flask at 3 °C, 5% CO2 in DMEM containing 10% fetal calf serum (FCS), 100 U/ml penicillin and streptomicin (Euroclone UK) and they were used within a 12-h interval; that is, only from the samples that, thanks to the number of fibro-blasts, reached 80% confluence for RNA extraction.
RNA isolation and label protocol
Total RNA was extracted following the standard Trizol protocol (Thermo fisher Scientific). RNA quantification and quality control was performed by Experion RNA STN-SENS Analysis on EXPERION automated electro-phoresis station (Bio-Rad Laboratories). Aliquot of total RNA (1 μg) was retro-transcribed and labelled using the Amino Allyl MessageAmp® II aRNA Amplification Kit (Ambion) according to manufacturer’s protocol. Before hybridization, the Cy3 and Cy5 (GE Healthcare-Amer-sham) labelled samples were combined and dried in a speed vac. To the dried sample 330 μl of hybridization buffer were added. The samples were denatured for 5 min at 65 °C, snap cooled on ice for 1 min. The solution was pipetted onto the microarray MICROMAX glass slide SuperChip I (Cat No. MPS696) provided by Perki-nElmer Life Sciences Inc, placed in a hybridization cham-ber and the cover slip was placed carefully. Hybridization reaction was performed overnight in a sealed chamber (Corning® hybridization chambers, Sigma) at 42 °C in a high-precision Techne Hybridizer Oven HB-1D (Barlow-orld Scientific Techne). Pre and post-hybridization wash-ing were performed accordwash-ing to the protocol described in Molecular Cloning a Laboratory Manual [37].
Scan protocol and data processing
Fluorescence signals were detected by analysing the microarrays in a VersArray ChipReader® 5 μm dual confocal laser scanner, with VersArray ChipReader v3.1 software (Bio-Rad Life Sciences Division); for each microarray slide, two images were produced by illuminat-ing the array at 635 nm (excitation of Cy5) and 532 nm (Cy3). For both illuminations, photomultiplier tube (gain and light amplification) settings were at 1000 and laser power was set at 50%. All images were captured in TIFF
Table 1 Clinical parameters of the bone marrow donors, the categories based on the International Myeloma Working Group uniform response criteria
a The phenotype was investigated with immune-cytochemical staining with anti-k or anti- antibody according to the light chain of the M-component
Case Sex aIgIsotype stage
1-MM F IgA k II A 2-MM M IgG k II A 3-MM M IgM k/IgA k II A 4-MM M IgG III A 5-MM M IgG k III A 6-MM M IgG k III A 7-MM M micromolecular k III A 8-MM F IgG k III A 9-MM M IgA III A 10-MM M micromolecular k III A 1-MGUS F IgG 2-MGUS M IgG 3-MGUS M IgG 4-MGUS M IgG k 5-MGUS M IgG k 6-MGUS M IgA k 7-MGUS M IgA k
format. Raw images were analysed with VersArray Ana-lyzer Software v4.5 (Bio-Rad Laboratories) using media pixel intensities for each spot. The set consists of 21,329 oligonucleotides whose length is 70mer (version Operon 2.0) designed on Cluster of Human Unigen, mainly in the 3 end terminal region. Global background was subtracted by bi-quadratic polynomial approximation, and cross-channel normalization was performed by local regression (LOESS).
Data approximation via nonnegative matrix factorization
The gene expression profile obtained by the biologi-cal experiments are collected in numeribiologi-cal nonnegative matrices whose columns measure the processed inten-sities of one gene probe in a corresponding experiment on a single patient and rows correspond to the processed intensity for a single gene probe across all the patients. Three different microarray matrices were considered: the first one collects gene expression profile from 8 patients affected by MGUS condition, the second one collects gene expression profile from 10 patients affected by MM and the third one resulting from a concatenation of the previous two matrices. This latter describes gene expres-sion profile among all 18 patients with both clinical con-ditions (8 with MGUS and 10 with MM). These data matrices have been deposited in the NCBI Gene Expres-sion Omnibus [38] and are accessible through the series entry GSE249901; while the id of the adopted genes are
available using the platform entry GPL21362 (totally we
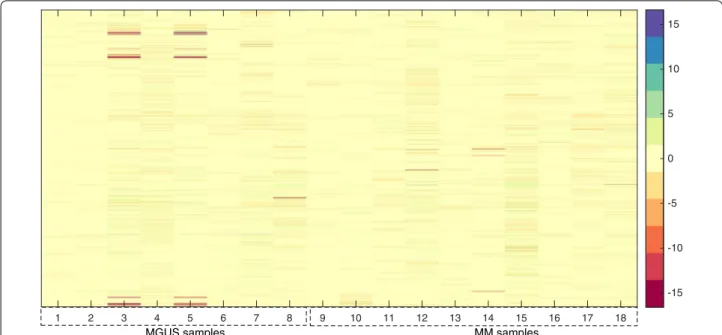
considered 21520 genes involved in the analysis). Figure 1
illustrates the heatmap plot3 of the concatenated data
matrix in log-2 scale: the first 8 columns of the matrix represents the gene expression profile from MGUS con-ditions while the latter 10 columns represents the gene expression profile from MM conditions.
The three microarray matrices were independently analysed using a nonnegative matrix factorization (NMF) algorithm based on Kullback–Leibler divergence4 with
multiple runs and random initialization [32, 40]. Numeri-cal experiments were conducted using NMF package on R-project environment [41].
A NMF algorithm approximates any microarray matrix X ∈ Rn×m as the product of a nonnegative basis
matrix W ∈ Rn×r
+ and a nonnegative coefficient matrix
H ∈ Rr×m+ , so that X ≈ WH . NMF reduces the
dimen-sionality of available microarray matrix and extracts from it a small number (r) of nonnegative features (basis vec-tor) which are indicative of latent knowledge embedded in data [35, 42]. In this paper, the number r of metagenes is empirically chosen as described in [40].
Considering gene expression levels from a single sam-ple as a vector in the space of the n genes, a column X:,j
of the matrix X can be interpreted as a nonnegative lin-ear combination of the columns W:,k of the basis matrix
W, weighted with coefficients of the matrix H, that is X:,j ≈ rk=1W:,kHkj, for j = 1, . . . , m.
For the sake of illustration, Fig. 2 reports the heatmap plot of a rank 2 factorization ( r = 2 ) of a microarray matrix X approximated as the matrix product WH. Each value in the matrices X, W and H correspond to a color in accordance to the corresponding color bar, rows in W represent the same genes in X, the two columns of W are the 2 metagenes which store up the biological informa-tion hidden in the analysed genes, while elements of H measure the effect of a specific metagene in a particular sample in X.
NMF based extraction approach and post‑processing phase
After the two factor matrices W and H have been obtained via a NMF algorithm, a procedure to identify relevant genes in each metagene is applied. Particularly, genes in each metagene are firstly ranked and succes-sively extracted in accordance to the some criteria (pre-liminary chosen). In this work, the gene.score procedure proposed in [43] is adopted. This procedure selects rep-resentative genes in a single metagene if their gene.score values are higher than ˆµ + 3 ˆσ (where ˆµ and ˆσ are the median and the median absolute deviation of gene.scores, respectively) and their maximal values in the correspond-ing rows of W is larger than the median of all elements in the basis matrix W.
In this paper, each of the three microarray data matri-ces was decomposed via NMF factorization, and then a single metagene was considered for each obtained basis matrix. The single metagene was chosen as the column in the basis matrix possessing the largest number of genes extracted when the gene extraction technique is adopted. Genes extracted from the “most informative” metagenes of the MGUS, MM and the concatenated matrix were subsequently collected into three subsets, indicated here-after as metaMGUS, metaMM and metaMGUSMM.
With the aim of investigating the influence of spe-cific genes on the disease behavior a post-processing phase was adopted. Post-processing procedure consists in inspecting common and uncommon genes between 1 https ://www.ncbi.nlm.nih.gov/geo/query /acc.cgi?acc=GSE24 990.
2 https ://www.ncbi.nlm.nih.gov/geo/query /acc.cgi?acc=GPL21 36. 3 Heatmap tool is frequently adopted to illustrate trends in genetic data
which are not clearly visible using other visualization techniques. This plot associates a color to each numerical values in a matrix so that the relevance of a row element in a column can be easily highlighted.
4 This divergence is frequently adopted in microarray data analysis since
it corresponds to the maximum likelihood estimation under independent Poisson assumption. [39]
metaMGUS and metaMM, in associating them the cor-respondent gene symbol identification and in discard-ing obsolete genes contained in the Operon version 2.0 platform.
Considerations on the NMF‑based approach
Nonnegative matrix factorization is the core of the pecu-liar approach we used to extract few genes which should be representative of the whole dataset. NMF was used to performed a dimensionality reduction of data matri-ces. NMF are applied in a new peculiar way: it is used
to select a single metagene from the MGUS data matrix and from the MM data matrix which can be interpreted as the most representative of the whole dataset (for each data matrix). Then, genes in each metagenes were firstly ranked and successively extracted in accordance to the gene score procedure based on the work in [43]. Finally, intersection and complementary set operations has been applied to extract common and uncommon genes to be further investigated from a biologically point of view (details are reported in “Function analysis” section).
1 2 3 4 5 6 7 8 9 10 11 12 13 14 15 16 17 18
MGUS samples MM samples
-15 -10 -5 0 5 10 15
Fig. 1 Concatenation of the two conditions: MGUS and MM. Heatmap plot of the concatenated data matrix in log-2 scale: the first 8 columns of the
matrix represents the gene expression profile from MGUS conditions while the latter 10 columns represents the gene expression profile from MM conditions
Fig. 2 Graphical illustration of NMF. Microarray matrix X is modeled as the linear combination of a set of patterns, the columns of W, and the
It should be observed that factor matrices derived from the NMF decomposition only contain non-negative val-ues, hence the original data can be represented by only additive, not subtractive, combinations of the basis vec-tors (metagenes). This parts-based representation of original data is appealing because reflects the intuitive notion of combining parts to form a whole. Particularly, the metagenes can uncover meaningful biological inter-pretation in term of genes it is composed by. Further-more, each original sample is represented by metagenes with the corresponding encoding vector (the column of coefficient matrix H). It is clear that large value of both basis factors and encoding vectors play important role in representing of the original data allowing an intuitive ranking of the most important information.
Results
Preliminary microarray data analysis
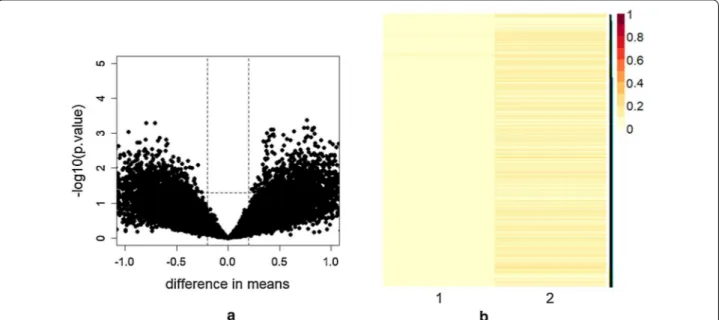
A preliminary qualitative investigation of the origi-nal data matrices were performed to figure up the most appropriate dimensionality reduction mechanism to be applied. Figure 3a illustrates the Volcano plot of the elements in the gene expression profile matrix among all 18 patients with both clinical conditions MGUS and MM. It can be observed the presence of some interest-ing genes which differentiate in their expression (points above the horizontal dotted line). To obtain information
on the overall structure of the complete gene expression microarray data (illustrated in Fig. 1) both principal com-ponents analysis (PCA) and NMF were applied. Figure 3b reports the heatmap of the first principal components (PC1) and of the relavant metagene obtained, respec-tively, using PCA and NMF of the gene expression profile matrix among all 18 patients. As it can be observed, the first principal component, which preserves mostly the variance of data (in particular the 99%), highlights very few genes which are unlikely assumed as a subset of genes representative of the whole dataset. On the contrary, the first metagene obtained using NMF presents differences between genes. Similar plots can be obtained for all the other principal components. These results suggest that PCA fails to detect relevant embedded information while NMF is more effective providing a more comprehensive detection of underlying genetic information of the com-plete gene expression data and the possibility to handle the results as significance factors [32].
Microarray dimensionality reduction
The results automatically obtained from NMF based approach previously described are illustrated using heat-map plots. Particularly, Figs. 4 and 5 report the heat-maps of reordered basis matrices extracted from gene expression profiles of 8 patients with MGUS condition and from 10 patients with MM condition, respectively.
Fig. 3 a Volcano plot of the gene expression profile data of all 18 patients. x-axis reports difference of the group means while y-axis indicates
statistical significance of the t-test per rows (–log10 of p-value). The dashed line shows where p = 0.05 with points above the line having p < 0.05.
In particular, points represent interesting genes, in the left upper corner are depicted genes with mostly small p-value and low difference in means, whereas in the right upper corner there are genes with small p-value and large difference in means. b Heatmap of the first principal component PC1 and of the Metagene 1 (both normalized) obtained respectively by PCA and NMF on the gene expression profile data of all 18 patients
The ascending re-ordering of each column in the heat-maps helps to identify the relevant metagenes as those with much darker shades than the others. From these metagenes, the gene extraction procedure is performed to automatically extract genes with higher values. These genes constitute the knowledge base to be further
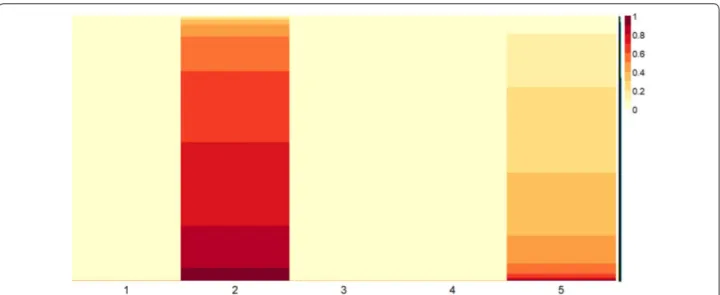
investigated from a biological point of view. The extracted subsets: metaMGUS and metaMM composed by 2086 genes and 472 genes, belong to the second column in Fig. 4 and to the sixth metagene in Fig. 5, respectively.
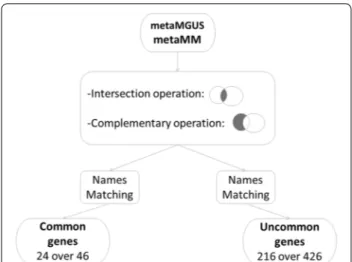
The post-processing procedure is detailed in Fig. 6. As it can be observed, common genes between metaMGUS
Fig. 4 Basis matrix of MGUS condition. Heatmap plot of basis matrix extracted from the gene expression profile data matrix of the 8 patients with
MGUS conditions. Five metagenes were automatically extracted with a rank of the factorization = 5. Values in each column of the basis matrix have been normalized by row and sorted to show higher values on the bottom and lower values on the top of the heatmap. As highlighted by the color shades, both metagenes two and five present a significant number of important genes. Metagene two has been considered as the most representative of the whole dataset of MGUS condition since this column includes the largest number of extracted genes
Fig. 5 Basis matrix of MM condition. Heatmap plot of the basis matrix extracted from the gene expression profile data matrix of the 10 patients
with MM conditions. Eight metagenes were automatically extracted with a rank of the factorization equal to 8. Values in each column of the basis matrix have been normalized by row and sorted to show higher values on the bottom and lower values on the top of the heatmap. Due to the presented of the highest number of relevant values, metagene six was (automatically) identified as the most representative metagene of the dataset with MM condition
and metaMM, with the gene symbol identification were only 24 among 46, while the remaining 17 were Homo sapiens cDNA and 5 Hypothetical protein. On the other hand, from the 426 uncommon genes belonging only to metaMM, 226 had the gene symbol identification, while the remaining 136 genes were Homo sapiens cDNA, 35 were hypothetical protein and 29 were not Homo sapi-ens. Moreover, from 226 genes only 216 were considered useful for the functional analysis since the presence of some duplicates. These genes and their corresponding median value of MGUS and MM are listed in Additional file 1: Tables S1 and S2.
Function analysis
Common and uncommon genes found in the two meta-MGUS and metaMM subsets could be considered as genes potentially involved in the activation of fibroblasts from the MGUS to MM condition.
These automatically selected genes undertook func-tional analysis via WebGestalt (WEB-based GEne SeT AnaLysis Toolkit) tool5 to understand if any genes could
be responsible for the activation of bone marrow fibro-blasts [44].
The identification of a common genes subset between the fibroblasts of patients with MGUS and the myeloma clinical condition shows that a functional switch is
required to lead fibroblasts to acquire pro-tumorigenic activity. This functional switch is determined by genes that promote a phenotype capable of creating a more important dialogue in the bone marrow micro-environ-ment. Results of this functional analysis are described in the following.
Functional analysis of common genes
The analysis of the 24 common genes between metaM-GUS and metaMM allows to identify four genes in dif-ferent pathways: 1 prokineticin precursor (Prok-1), gonadotropin releasing hormone 1 leutinizing-releasing hormone (GNRHR), alpha-2-HS-glycoprotein (AHSG) and beta-2-microglobulin ( β2-M). These genes alone may not be related to the fibroblast activation process, however, it is possible that integrated into the functional activity of the uncommon metaMGUS and metaMM subsets these genes are able to work in concert and favour activation. It can be noted that
• The Prok-1 and GNRHR genes are present in the pathways: GPCR ligand binding, signal transduction and class A/1 (rhodopsin-like receptor).
• The AHSG and B2M genes are present in VEGF and VEGFR signaling network, Arf6 downstream path-way, Sphingosine 1-phosphate (S1P) pathpath-way, prote-oglycan syndecan-mediated signaling events, Nectin adhesion pathway, EGFR-dependent signaling events endothelin, and endothelins.
In particular, the gene Prok-1 is involved in the synthe-sis of a secretory protein signalling and is a potent angio-genic factor, in fact, promotes angiogenesis in various steroids glands [45]. Moreover, Prok-1 protein promotes the survival and differentiation of granulocytes and monocytes, as well as stimulation, mobilization of hemat-opoietic cells and modulation of the immune response [46].
The protein encoded by the gene is a GnRH receptor type 1 of gonadotropin-releasing hormone, it is part of a system autocrine regulation of cell proliferation and it is expressed on the surface of many cells, on lymphocytes and in various human malignant tumors [47].
Alpha2 HS-glycoprotein is encoded by AHSG gene, it is an important chemoattractant in serum or blood and it is involved in different functions as endocytosis and bone formation. Cancer cells have the ability to follow the concentration gradient of Alpha2 HS-glycoprotein from primary sites up to the nearby blood vessel. Moreover, AHSG shows synergy with traditional chemotactic as SDF-1/CXCL12 to mediate chemotaxis and invasion of cancer cells through the extracellular matrix [48].
Fig. 6 Workflow of the post-processing procedure. Common and
uncommon genes have been extracted from the two obtained subsets and matched with their corresponding gene symbols. These operations get two groups of genes: 24 over 46 for common genes and 216 over 426 for uncommon genes. Genes symbols and their corresponding expression median value in the two conditions, MM and MGUS, are reported in Additional file 1
5 WebGestalt is a functional enrichment analysis web tool that using
Finally, the β2-M gene encodes for a non-glycosylated protein that is present in all nucleated cells. The β2-M protein activates pleiotropic signaling such as regula-tion of protein kinase A, androgen receptor, VEGF, fatty acid synthetase and has multiple roles in tumorigenesis and angiogenesis. β2-M behaves as a growth factor and is known to activate stromal cells, such as mesenchymal stem cells, osteoblasts and osteoclasts [49].
In addition to the described genes, we can individually identify WHSC1, PRDM14 and ANXA11 genes which are involved in autoimmune disorders and in some can-cers [50–52]. The set of functions governed by the genes selected and described has shown a particularly active state of the fibroblasts belonging to the subset of com-mon metaMGUS and metaMM genes but without the adoption of a phenotype that can alter the bone marrow.
Functional analysis of uncommon genes
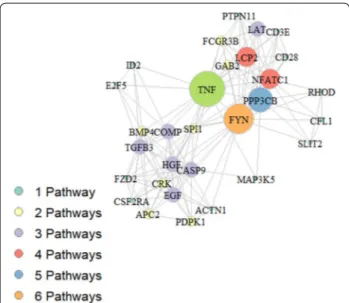
The analysis of 216 genes present just in metaMM but not in the intersection allows to select 11 pathways in which only 30 of 216 genes belonging to metaMM are present. Fig. 7 illustrates the network generated by these genes: each node in the network represents a gene, the node size is proportional to the number of pathways the specific gene belongs to, whereas edges between nodes indicate linked pathways. As it can be observed, few genes located in the centre of chart are the key genes linking all the remaining genes.
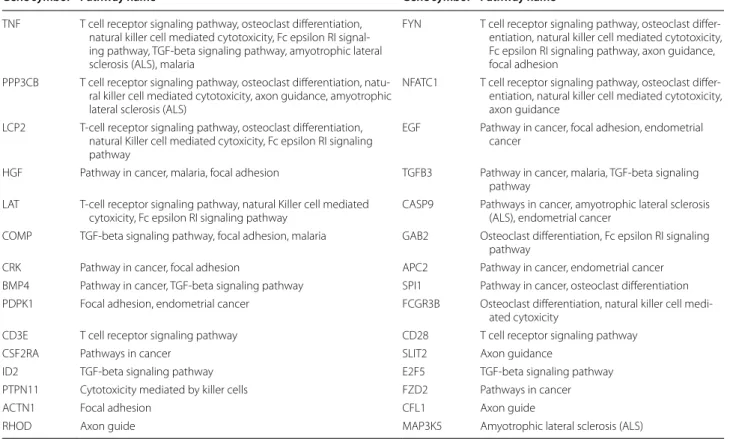
These genes and the pathways they belong to are listed in Table 2.
In particular, it can be noted that:
• The TNF gene is shared in 7 pathways, it is a multi-functional pro-inflammatory cytokine and represents an index of fibroblast activity in the regulation of a broad spectrum of biological processes, including cell proliferation, differentiation, apoptosis, metabolic lipids and coagulation within the bone marrow [53,
54].
• The FYN gene and the PPP3CB gene are present in 6 and 5 of the selected pathways, respectively. In particular, the FYN gene is a member of the kinase family and plays a role in controlling cell growth [55]. The PPP3CB gene is a phosphatase and has a specific role in regulating T lymphocytes [56].
• NFATC1 and LCP2 genes are present in 4 of the selected pathways. The function of the protein encoded by the NFATC1 gene is the regulation of multiple cytokines and other regulatory molecules, including some interleukins (IL-2, IL-3, IL-4, IL-5, IL-6, IL-8, GM CSF), interferon (IFN)-ν, tumor necrosis factor (TNF)-α, CD40 ligand (CD154), and CD95 ligand (FasL). The NFATC1 protein is mainly studied in T cells (calcineurin-dependent 1) and is involved in the immune responses of lymphocytes B, NK cells, macrophages, mast cells, and eosinophils [20, 54, 57]. The LCP2 protein acts as a T cell sub-strate (TCR), therefore it plays a role in the transduc-tion of the intracellular signal mediated by TCR [58]. • EGF, HGF, TGFB3, LAT, CASP9, and COMP genes
are present in 3 of the 11 pathways, they encode for proteins involved in the growth, proliferation and differentiation of many cell types. In particular, EGF is a potent mitogen factor [59], while HGF binds to the hepatocyte growth factor receptor to regulate morphogenesis, growth and cellular motility and is secreted by mesenchymal cells. The HGF therefore acts as a multifunctional cytokine on predominantly epithelial cells and plays a role in angiogenesis, tumo-rigenesis, and tissue regeneration [60, 61]. TGFB3 protein is a ligand of the various TGF-beta recep-tors and leads to the recruitment and activation of SMAD family transcription factors and regulates a myriad of mainly immunosuppressive responses [18,
62–64]. The LAT protein forms, along with several adaptive proteins, a complex that creates a multimo-lecular signaling network located at the TCR engage-ment site. The role played by LAT protein underlines the complex modulation performed by fibroblasts of uncommon metaMM subsets in regulating immune response [65]. The CASP9 gene encodes for a protein whose function is comparable to a tumor suppressor and its functional polymorphisms may be
responsi-Fig. 7 Network obtained from genes sharing different pathways.
Nodes of the graph represent the 30 genes reported in Table 2, the graph edges link genes belonging to the same pathway. Node size reflects the number of pathways the gene is involved in: larger is the radius of the node greater is the number of pathways the gene belongs to
ble for alterations in proliferation [66]. The protein encoded by the gene COMP family belonging to the thrombospondin family carries out direct action on the mechanical integrity of the extracellular matrix, intervening in the interface between mineralized and non-mineralized regions [67, 68]. This protein is involved in the interaction between fibroblasts and osteoblasts, and is related to the significant changes caused by the nature of mechanical stress by the min-eralized fibrocartilage to the bone [69].
• GAB2, CRK, APC2, BMP4, SPI1, PDPK1 and FCGR3B genes are only present in 2 of the 11 path-ways selected, specifically GAB2 and CRK, are adapt-ers for the transmission of various signals, GAB2 pro-tein responds to receptors stimuli cytokines, growth factors, and antigen receptors [70] while CRK protein binds several tyrosine-phosphorylated proteins [71]. The APC2 gene encodes a protein that promotes the assembly of a multiproteic complex responsible for the control of beta-catenin cytoplasmic levels and is crucial in interaction with cytoskeletal proteins [72]. The BMP4 gene belongs to the superfamily of TGF-beta proteins [73] and the SPI1 gene encodes for a transcription factor that activates gene expression in
the myeloid line and the development of B-lymphoid cells [74]. The PDPK1 gene encodes for a serine-threonine kinase, crucial to regulating cell migration. PDPK1 is a signal transducer for PI3K and activates multiple downstream effectors, it represents a focal point in the coordination of signals from the extra-cellular environment to the cytoskeleton PLCν [75]. Finally, the FCGR3B gene encodes for a low affinity receptor for the Fc region of gamma immunoglobu-lins (IgG) and is capable of capturing immune com-plexes [76].
• Gene residues individually present in the 11 path-ways, such as the CD3E gene and the CD28 gene may be involved in some cellular processes mainly related to an immune response [75]. The immune response is integrated with the CSF2RA [76] and SLIT2 genes [77]. A second set of genes promotes cell prolifera-tion control; indeed, the ID2 gene belongs to tran-scriptional factor regulators and negatively regulates cell differentiation [78]. E2F5 genes and PTPN11 are important in cell cycle control and tumor suppres-sor genes in oncogenic transformation [79, 80]. The last group consists of FZD2 [81], ACTN1 [82], CFL1 [83] and RHOD [84, 85], these genes are involved in
Table 2 Table lists the gene symbol and the KEGG pathway of selected genes
Only 14% of the total number of genes has been selected with the WebGestalt tool
Gene symbol Pathway name Gene symbol Pathway name
TNF T cell receptor signaling pathway, osteoclast differentiation, natural killer cell mediated cytotoxicity, Fc epsilon RI signal-ing pathway, TGF-beta signalsignal-ing pathway, amyotrophic lateral sclerosis (ALS), malaria
FYN T cell receptor signaling pathway, osteoclast differ-entiation, natural killer cell mediated cytotoxicity, Fc epsilon RI signaling pathway, axon guidance, focal adhesion
PPP3CB T cell receptor signaling pathway, osteoclast differentiation, natu-ral killer cell mediated cytotoxicity, axon guidance, amyotrophic lateral sclerosis (ALS)
NFATC1 T cell receptor signaling pathway, osteoclast differ-entiation, natural killer cell mediated cytotoxicity, axon guidance
LCP2 T-cell receptor signaling pathway, osteoclast differentiation, natural Killer cell mediated cytoxicity, Fc epsilon RI signaling pathway
EGF Pathway in cancer, focal adhesion, endometrial cancer
HGF Pathway in cancer, malaria, focal adhesion TGFB3 Pathway in cancer, malaria, TGF-beta signaling pathway
LAT T-cell receptor signaling pathway, natural Killer cell mediated
cytoxicity, Fc epsilon RI signaling pathway CASP9 Pathways in cancer, amyotrophic lateral sclerosis (ALS), endometrial cancer COMP TGF-beta signaling pathway, focal adhesion, malaria GAB2 Osteoclast differentiation, Fc epsilon RI signaling
pathway
CRK Pathway in cancer, focal adhesion APC2 Pathway in cancer, endometrial cancer BMP4 Pathway in cancer, TGF-beta signaling pathway SPI1 Pathway in cancer, osteoclast differentiation PDPK1 Focal adhesion, endometrial cancer FCGR3B Osteoclast differentiation, natural killer cell
medi-ated cytoxicity
CD3E T cell receptor signaling pathway CD28 T cell receptor signaling pathway
CSF2RA Pathways in cancer SLIT2 Axon guidance
ID2 TGF-beta signaling pathway E2F5 TGF-beta signaling pathway PTPN11 Cytotoxicity mediated by killer cells FZD2 Pathways in cancer
ACTN1 Focal adhesion CFL1 Axon guide
the organization of the cytoskeleton. Finally, MAPK gene encoding MAP3K5, responsible for the activa-tion of several downstream effects, in particular tran-scription factors, which regulate different cellular responses [86]. The functional network created by the 30 genes in the 11 pathways selected and belong-ing to the uncommon subset of metaMM shows that fibroblasts have acquired additional properties from those belonging to the common metaMGUS subset that favor the “activated fibroblast” condition.
Validation of post‑processing procedure as preliminary step for functional analysis
It is important to note that the functional analysis of common genes, found through the post-processing pro-cedure, is correlated with the information extracted studying the two clinical conditions at the same time. In fact, focusing on this aim, the NMF has been also per-formed on the matrix concatenating the MGUS and MM conditions with a rank equal to r = 5. This rank selection respects the theory of the rank of a concatenation matrix (that is rank([A1,A2]) < rank(A1) +rank(A2), where
[A1,A2] is the concatenation per column of the matrices
A1 and A2).
The heatmap plot of the reordered basis matrix, obtained from the NMF, shown in Fig. 8a, allows to iden-tify the first column as the most informative metagene. From this metagene 1393 genes were identify through the extraction procedure; we refer to this subset as meta-MGUSMM. It is worthy to note that metaMGUSMM contains a significant part of common genes previously extracted. Moreover, to further investigate the possible influence of the selected metagene among all patients, an analysis on the associated coefficient matrix was per-formed. Figure 8b plots the density level corresponding to the elements of the selected metagene in the coeffi-cient matrix. The density values represent the weight of the selected metagene among patients who are distin-guished by circle and star markers in accordance to the condition they belong to (circle corresponds to MGUS and star to MM, respectively). The higher is the value, the greater is the effect of the metagene over a specified condition; as it can be appreciated in the plot the major-ity corresponds to MM condition. This can be considered as an empirical evidence of the effectiveness of the func-tional analysis performed on the subset of genes as a tool to acquire an understanding on the activation of fibro-blasts in bone marrow.
Discussion
The combined use of NMF, gene extraction mechanism and post-processing procedure on fibroblast gene expres-sion of patients with MGUS and MM, allows to select a
reduced number of genes ideally involved in the activa-tion of bone marrow fibroblasts (CAF) in the MM. Usu-ally, as observed in solid tumors, a sub-population of CAF is studied on the basis of some expressed indicators, but the data are interpreted as true for all CAF popula-tions. In fact, the term “cancer-associated fibroblasts” is misleading, since it groups these cells based solely on their position, despite the heterogeneity and roles in the different types of tumors. The common characteristic of CAF is the ability to alter the micro-environment and the behaviour of neoplastic cells. In fact, when a trans-formation is established in a cell, a symbiotic relationship that promotes tumor growth is generated with its micro-environment. This process is a crucial feature and those neoplastic cells that fail to develop this capacity will not overcome tumorigenic barriers and will remain quiescent (not evolution of the disease). In this study, we primar-ily sought to identify the specific genes associated with activation of the sub-population of CAF in the bone mar-row micro-environment and aimed at understanding the role in the pathogenesis of MM. These genes, grouped into common and uncommon subsets compared to the two clinical conditions (MGUS and MM), were sub-sequently functionally analysed. The evaluation of the results obtained is purely descriptive and focused on 34 genes: 4 belonging to common genes and 30 to non-com-mon genes in metaMGUS and metaMM. The 4 comnon-com-mon genes show a fibroblast phenotype incapable of altering the bone marrow micro-environment. By contrast, the 30 genes belonging to the subset of uncommon genes of metaMGUS and metaMM have allowed fibroblasts to acquire additional properties other than those belong-ing to the subset of common metaMGUS and metaMM genes, that favour the “activated fibroblast” condition.
In particular, as shown in Fig. 9, the functional path-ways allowed to select proteins such as NFATC1, HGF and FYN proteins that favor epithelial–mesenchy-mal transition (EMT); add the immortalization pro-cesses linked to inhibition of apoptosis (TNF, CFL1, HGF, COMP, FYN) [53, 55, 87–89] and changes in glu-cose metabolism and the regulation of insulin signaling (PTPN11, PDPK1) [90]. The proteins encoded by the genes FYN, CD28, PDPK1, PTPN11 play a stimulating action of T cells [77, 91–93] while PPP3CB and NFATC1 regulate the signalling pathways of lymphocyte receptors B and T [56, 94]; as well as CD28, LAT, LCP2, FCGR3B are involved in mediating the immune response [58, 65,
76, 77]. In addition, the phenotype acquired by fibro-blasts exhibits unique functional properties which also serve for osteoblastic differentiation. Indeed, in the evo-lution of MM disease, the action of the fibroblasts in the bone marrow niche is subject to a neuroendocrine regu-lation of bone metabolism. The fibers of the sympathetic
nervous system (SNS), known to innervate the corti-cal bone, modulate a number of functions, including the homeostatic regulation and hormonal control of bone turnover [95]. In this regard, the gene products of PPP3CB, FYN, NFATC1, RHOD, SLIT2, CFL1 could be involved in the propagation of a vicious cycle charac-terized by the presence of osteolytic lesions, caused by prolonged declines in bone mineralization mediated by osteoblasts and increases bone resorption by osteoclasts. The signaling pathways are mediated by growth factors
(EGF, HGF, TGFB3, BMP4), cytokines (TNF, SLIT2) and specific receptors (CD3E, CD28, FCGR3B, CSF2R), sug-gesting greater influence of activated fibroblasts in MM compared to the condition of MGUS. Therefore, in the progression of the disease, the selected 30 genes generate a clear interaction between activated fibroblasts and T lymphocytes, NK cells, osteoclasts, B lymphocytes, mac-rophages, and the same plasma cells. Thus, the subgroup of uncommon metaMGUS and metaMM genes may be considered candidates for determining the activation
Fig. 8 a Heatmap plot of basis matrix extracted from the gene expression profile data matrix. This matrix has been obtained concatenating
expression data from 10 patients with MM condition and 8 patients with MGUS condition. Five metagenes were automatically extracted with a rank of the factorization = 5. Values in each column of the basis matrix have been normalized by row and sorted to show higher values on the bottom and lower values on the top of the heatmap. The first metagene was automatically identified as the most representative metagene of the whole dataset of the two conditions, since it presented the highest number of relevant values. b Density level of the coefficient matrix for each patient in the first metagene. Values in the coefficient matrix have been normalized by column to a clearer result representation. The MM and MGUS conditions are marked by circle and star markers, respectively. Higher values represent a greater influence of genes in the metagene on the corresponding patient
of bone marrow fibroblasts and actively involved in the progression of the disease from MGUS to MM. In addi-tion, by adopting the style introduced for the different polarized immune cells, we could also subdivide the CAF into two functional subtypes: the F1 and F2 polarized fibroblasts [17, 18]. The subtype F1 could be associated with the MGUS condition because it is characterized by genes that alone are not related to the activation pro-cess of fibroblasts, although it is possible that they are able to work in conjunction with uncommon genes of metaMGUS and metaMM. The subtype F2, instead, characterized by the uncommon genes of metaMGUS and metaMM, can be associated with the MM condition because it is able to create an altered dialogue between
the plasma cells and the bone marrow. Although some of these genes have already been validated by in vitro and in vivo experiments, as the literature indicates, the rest will be the object of our attention in the near future.
Conclusion
In conclusion, we applied a peculiar methodology based on NMF method to gene expression profiles of fibroblasts from patients with MGUS and MM to identify—in an automatic manner—a limited number of genes which are possible candidates associated with activation of fibro-blasts in the bone marrow in patients with MM com-pared to MGUS. We recognize that these in vitro results almost certainly represent an incomplete representation
Fig. 9 Functional network of different pathways genes. The functional network created by the genes in the 11 pathways selected and belonging
to the subset of uncommon metaMM. The CAFs have acquired additional properties from those belonging to the common metaMGUS subset. In particular, the 30 selected genes regulate processes such as: epithelial–mesenchymal transition (EMT), immortalization, inhibition of apoptosis, changes in glucose metabolism and the mediation of the immune response. The phenotype acquired by fibroblasts shows properties that include homeostatic regulation and hormonal control of bone turnover (PPP3CB, FYN, NFATC1, RHOD, SLIT2, CFL1) and also mediate signals with specific receptors, growth factors and cytokines
of the normal fibroblast response in the bone marrow microenvironment during the progression of the disease from MGUS to MM, for experimental times. However, we believe that the emerged picture strongly suggests a very broad role for fibroblast in the orchestration of this important process. Furthermore, it should be noted that only with a greater understanding of the relation-ship between plasma cells and stromal bone marrow cells can we have suggestions for a more targeted therapy and these results provide a further contribution. In fact, a pharmacological treatment with a simultaneous action against the genes in the selected pathways, rather than on the single gene, could have a greater effect on the evolu-tion of the disease. Therefore, the development of com-binatorial therapies for both CAF and neoplastic cells could be promising in clinical practice.
Additional file
Additional file 1: Tables S1 and S2. Genes and their corresponding median value of MGUS and MM.
Abbreviations
MM: multiple myeloma; NMF: nonnegative matrix factorization; PCA: principal component analysis; MGUS: monoclonal gammopathy of undetermined sig-nificance; PC: plasma cells; HSC: hematopoietic stem cell; BMSCs: stem cells of the bone mesenchymal; CAFs: activated fibroblasts cells; FCS: fetal calf serum; RPMI: Rosewell Park Memorial Institute 1640 Medium; EDTA: ethylendiamino-tetraacetate; PBS: phosphate-buffered saline; SFM: FCS-free medium; LOESS: local regression; WebGestalt: WEBbased GEne SeT AnaLysis Toolket; Prok-1: 1 prokineticin precursor; GNRHR: gonadotropin releasing hormone 1 leutinizing-releasing hormone; AHSG: alpha-2-HSglycoprotein; b2-M: beta-2-microglob-ulin; S1P: Sphingosine 1-phosphate; TCR : T cell substrate; MoAb: monoclonal antibody; IgG: gamma immunoglobulins; EMT: mesenchymal transition; SNS: sympathetic nervous system.
Authors’ contributions
AB, MC and AV designed the research. AB conducted all the biological experiments. The mathematical analyses were performed by NDB and FE; the paper was written and critically revised by AB, NDB and FE. MAF provided the biological material and revised the paper. All authors read and approved the final manuscript.
Author details
1 Department of Biomedical Science and Human Oncology, University
of Bari Medical School, Piazza Giulio Cesare 11, 70124 Bari, Italy. 2
Depart-ment of Mathematics, University of Bari Aldo Moro, via Edoardo Orabona, 4, 70125 Bari, Italy. 3 Department of Pharmacology, University of Bari Aldo Moro,
via Edoardo Orabona, 4, 70125 Bari, Italy. Acknowledgements
Not applicable. Competing interests
The authors declare that they have no competing interests. Availability of data and materials
The dataset supporting the conclusions of this article is available in the NCBI Gene Expression Omnibus repository [38] and are accessible through the series entry GSE24990 in https ://www.ncbi.nlm.nih.gov/geo/query /acc. cgi?acc=GSE24 990.
Consent for publication
All patients gave their informed consent in accordance with the Declaration of Helsinki
Ethics approval and consent to participate
The study was approved by the local ethics committee of the University of Bari Medical School, Italy.
Funding
The sponsors of this study are public or non-profit organizations that support science in general. They had no role in gathering, analyzing, or interpreting the data.
Publisher’s Note
Springer Nature remains neutral with regard to jurisdictional claims in pub-lished maps and institutional affiliations.
Received: 30 March 2018 Accepted: 24 July 2018
References
1. Moreau P, San Miguel J, Sonneveld P, Mateos M, Zamagni E, Avet-Loiseau H, Hajek R, Dimopoulos M, Ludwig H, Einsele H, et al. Multiple myeloma: ESMO clinical practice guidelines for diagnosis, treatment and follow-up. Ann Oncol. 2017;28(suppl–4):iv52–61.
2. Fowler JA, Edwards CM, Croucher PI. Tumor-host cell interactions in the bone disease of myeloma. Bone. 2011;48(1):121–8.
3. Malanchi I, Santamaria-Martínez A, Susanto E, Peng H, Lehr HA, Delaloye JF, Huelsken J. Interactions between cancer stem cells and their niche govern metastatic colonization. Nature. 2012;481(7379):85–9. 4. Franco OE, Shaw AK, Strand DW, Hayward SW. Cancer associated
fibro-blasts in cancer pathogenesis. Semin Cell Dev Biol. 2010;21:33–9. 5. De Veirman K, Rao L, De Bruyne E, Menu E, Van Valckenborgh E, Van Riet
I, Frassanito MA, Di Marzo L, Vacca A, Vanderkerken K. Cancer associated fibroblasts and tumor growth: focus on multiple myeloma. Cancers. 2014;6(3):1363–81.
6. Manier S, Sacco A, Leleu X, Ghobrial I, Roccaro AM. Bone marrow microenvironment in multiple myeloma progression. BioMed Res Int. 2012;2012:157496. https ://doi.org/10.1155/2012/15749 6.
7. Hideshima T, Bergsagel PL, Kuehl WM, Anderson KC. Advances in biology of multiple myeloma: clinical applications. Blood. 2004;104(3):607–18. 8. Garcia-Gomez A, De Las Rivas J, Ocio EM, Díaz-Rodríguez E, Montero JC,
Martín M, Blanco JF, Sanchez-Guijo FM, Pandiella A, San Miguel JF. Tran-scriptomic profile induced in bone marrow mesenchymal stromal cells after interaction with multiple myeloma cells: implications in myeloma progression and myeloma bone disease. Oncotarget. 2014;5(18):8284. 9. Wang J, De Veirman K, Faict S, Frassanito MA, Ribatti D, Vacca A, Menu E.
Multiple myeloma exosomes establish a favourable bone marrow micro-environment with enhanced angiogenesis and immunosuppression. J Pathol. 2016;239(2):162–73. https ://doi.org/10.1002/path.4712. 10. Raab M, Podar K, Breitkreutz I, Richardson P, Anderson K. Multiple
myeloma. Lancet. 2009;374(9686):324–39. https ://doi.org/10.1016/S0140 -6736(09)60221 -X.
11. Kuehl WM, Bergsagel PL. Multiple myeloma: evolving genetic events and host interactions. Nat Rev Cancer. 2002;2(3):175–87.
12. Manier S, Salem KZ, Park J, Landau DA, Getz G, Ghobrial IM. Genomic complexity of multiple myeloma and its clinical implications. Nat Rev Clin Oncol. 2017;14(2):100–13.
13. Blade J, Rosinol L, Cibeira M, de Larrea CF. Pathogenesis and progression of monoclonal gammopathy of undetermined significance. Leukemia. 2008;22(9):1651–7.
14. Raffaghello L, Vacca A, Pistoia V, Ribatti D. Cancer associated fibroblasts in hematological malignancies. Oncotarget. 2015;6(5):2589.
15. Desmouliere A, Guyot C, Gabbiani G. The stroma reaction myofibro-blast: a key player in the control of tumor cell behavior. Int J Dev Biol. 2004;48(5–6):509–17.
16. Öhlund D, Elyada E, Tuveson D. Fibroblast heterogeneity in the cancer wound. J Exp Med. 2014;211(8):1503–23.
17. Augsten M. Cancer-associated fibroblasts as another polarized cell type of the tumor microenvironment. Front Oncol. 2014;4:62.
18. Kalluri R. The biology and function of fibroblasts in cancer. Nat Rev Can-cer. 2016;16(9):582–98.
19. Bianchi G, Munshi NC. Pathogenesis beyond the cancer clone (s) in multiple myeloma. Blood. 2015;125(20):3049–58.
20. Frassanito M, Rao L, Moschetta M, Ria R, Di Marzo L, De Luisi A, Racanelli V, Catacchio I, Berardi S, Basile A. Bone marrow fibroblasts parallel multiple myeloma progression in patients and mice: in vitro and in vivo studies. Leukemia. 2014;28(4):904.
21. Ciavarella S, Laurenzana A, De Summa S, Pilato B, Chilla A, Lacalamita R, Minoia C, Margheri F, Iacobazzi A, Rana A, Merchionne F, Fibbi G, Del Rosso M, Guarini A, Tommasi S, Serrati S. u-PAR expression in cancer associated fibroblast: new acquisitions in multiple myeloma progres-sion. BMC Cancer. 2017;17:215.
22. Liu W, Yuan K, Ye D. Reducing microarray data via nonnegative matrix factorization for visualization and clustering analysis. J Biomed Inform. 2007;41:602–6.
23. Kong W, Xiaoyang M, Xiaohua H. Exploring matrix factorization techniques for significant genes identification of alzheimer’s disease microarray gene expression data. BMC Bioinform. 2011;12:S7. 24. Devarajan K, Ebrahimi N. Class discovery via nonnegative matrix
factorization. Am J Math Manag Sci. 2008;28(3–4):457–67. https ://doi. org/10.1080/01966 324.2008.10737 738.
25. Li Y, Ngom A. Non-negative matrix and tensor factorization based classification of clinical microarray gene expression data. In: 2010 IEEE international conference on bioinformatics and biomedicine (BIBM); 2010. p. 438–43. https ://doi.org/10.1109/BIBM.2010.57066 06. 26. Nikulin V, Huang TH. Unsupervised dimensionality reduction via
gradient-based matrix factorization with two adaptive learning rates. In: Proceedings of the 2011 international conference on unsupervised and transfer learning workshop, UTLW’11. 2011. Vol 27. p. 181–95. JMLR.org. http://dl.acm.org/citat ion.cfm?id=30457 96.30458 14. 27. Devarajan K. Nonnegative matrix factorization: an analytical and
interpretive tool in computational biology. PLoS Comput Biol. 2008;4(7):1000029.
28. Frigyesi A, Höglund M. Non-negative matrix factorization for the analy-sis of complex gene expression data: identification of clinically relevant tumor subtypes. Cancer Inform. 2008;6:275.
29. Tamayo P, Scanfeld D, Ebert BL, Gillette MA, Roberts CWM, Mesirov JP. Metagene projection for cross-platform, cross-species characterization of global transcriptional states. Proc Natl Acad Sci. 2007;104(14):5959– 964. https ://doi.org/10.1073/pnas.07010 68104 . http://www.pnas.org/ conte nt/104/14/5959.full.pdf.
30. Yang Z, Michailidis G. A non-negative matrix factorization method for detecting modules in heterogeneous omics multi-modal data. Bioin-formatics. 2016;32(1):1–8. https ://doi.org/10.1093/bioin forma tics/btv54 4.
31. Kim PM, Tidor B. Subsystem identification through dimensional-ity reduction of large-scale gene expression data. Genome Res. 2003;13(7):1706–18.
32. Del Buono N, Esposito F, Fumarola F, Boccarelli A, Coluccia M. Breast cancer’s microarray data: pattern discovery using nonnegative matrix factorizations. In: International workshop on machine learning, optimiza-tion and Big Data. New York: Springer; 2016. p. 281–92.
33. Carrasco DR, Tonon G, Huang Y, Zhang Y, et al. High-resolution genomic profiles define distinct clinico-pathogenetic subgroups of multiple mye-loma patients. Cancer Cell. 2006;9(4):313–25. https ://doi.org/10.1016/j. ccr.2006.03.019.
34. Guillamet D, Vitriá J. Unsupervised learning of part-based representations. In: Proceedings of computer analysis of images and patterns. CAIP 2001. LNCS-2124. Berlin: Springer; 2001.
35. Casalino G, Del Buono N, Mencar C. Nonnegative matrix factorizations for intelligent data analysis. In: Non-negative matrix factorization techniques. Berlin: Springer; 2016. p. 49–74.
36. Durie BG. Staging and kinetics of multiple myeloma. Semin Oncol. 1986;13:300–9.
37. Sambrook J, Fritsch EF, Maniatis T. Molecular cloning: a laboratory manual. Cold Spring Harbor: Cold spring harbor laboratory press; 1989.
38. Edgar R, Domrachev M, Lash AE. Gene expression omnibus: NCBI gene expression and hybridization array data repository. Nucleic Acids Res. 2002;30(1):207–10.
39. Esposito F, Del Buono N. Exploring hidden information in sparse non-negative matrix factorization. Technical Report 8, University of Bari, Department of Mathematics, Technical Report; 2017.
40. Brunet J-P, Tamayo P, Golub TR, Mesirov JP. Metagenes and molecu-lar pattern discovery using matrix factorization. Proc Natl Acad Sci. 2004;101(12):4164–9.
41. Gaujoux R, Seoighe C. A flexible R package for nonnegative matrix factorization. BMC Bioinform. 2010;11(1):367.
42. Casalino G, Del Buono N, Mencar C. Subtractive clustering for seeding non-negative matrix factorizations. Inf Sci. 2014;257:369–87.
43. Kim H, Park H. Sparse non-negative matrix factorizations via alternating non-negativity-constrained least squares for microarray data analysis. Bioinformatics. 2007;23(12):1495–502. https ://doi.org/10.1093/bioin forma tics/btm13 4.
44. Wang J, Vasaikar SV, Zhiao S, Greer M, Zhang B. Webgestalt 2017: a more comprehensive, powerful, flexible and interactive gene set enrichment analysis toolkit. Nucleic Acids Res. 2017;45(W1):W130–7.
45. LeCouter J, Kowalski J, Foster J, Hass P, Zhang Z, Dillard-Telm L, Frantz G, Rangell L, DeGuzman L, Keller GA. Identification of an angio-genic mitogen selective for endocrine gland endothelium. Nature. 2001;412(6850):877–84.
46. LeCouter J, Zlot C, Tejada M, Peale F, Ferrara N. Bv8 and endocrine gland-derived vascular endothelial growth factor stimulate hemat-opoiesis and hematopoietic cell mobilization. Proc Natl Acad Sci USA. 2004;101(48):16813–8.
47. Limonta P, Marelli MM, Mai S, Motta M, Martini L, Moretti RM. Gnrh recep-tors in cancer: from cell biology to novel targeted therapeutic strategies. Endocr Rev. 2012;33(5):784–811.
48. Nangami GN, Watson K, Parker-Johnson K, Okereke KO, Sakwe A, Thomp-son P, Frimpong N, Ochieng J. Fetuin-a ( α2hs-glycoprotein) is a serum chemo-attractant that also promotes invasion of tumor cells through matrigel. Biochem Biophys Res Commun. 2013;438(4):660–5. 49. Josson S, Nomura T, Lin JT, Huang WC, Wu D, Zhau HE, Zayzafoon M,
Weizmann MN, Gururajan M, Chung LW. β2-microglobulin induces epi-thelial to mesenchymal transition and confers cancer lethality and bone metastasis in human cancer cells. Cancer Res. 2011;71(7):2600–10. 50. Yin Z, Sun Y, Ge S, Sun J. Epigenetic activation of WHSC1 functions as an
oncogene and is associated with poor prognosis in cervical cancer. Oncol Rep. 2017;37(4):2286–94.
51. Lu Y, Wan Z, Zhang X, Zhong X, Rui L, Li Z. PRDM14 inhibits 293T cell proliferation by influencing the G1/S phase transition. Gene. 2016;595(2):180–6.
52. Wang J, Guo C, Liu S, Qi H, Yin Y, Liang R, Sun MZ, Greenaway FT. Annexin A11 in disease. Clin Chim Acta. 2014;431:164–8.
53. Blaser H, Dostert C, Mak TW, Brenner D. TNF and ROS crosstalk in inflam-mation. Trends Cell Biol. 2016;26(4):249–61.
54. Park HJ, Baek K, Baek JH, Kim HR. TNFα increases RANKL expression via PGE2-induced activation of NFATc1. Int J Mol Sci. 2017;18(3):495. 55. Saito YD, Jensen AR, Salgia R, Posadas EM. Fyn: a novel molecular target in
cancer. Cancer. 2010;116(7):1629–37.
56. Sun L, Youn H-D, Loh C, Stolow M, He W, Liu JO. Cabin 1, a nega-tive regulator for calcineurin signaling in t lymphocytes. Immunity. 1998;8(6):703–11.
57. Oikawa T, Nakamura A, Onishi N, Yamada T, Matsuo K, Saya H. Acquired expression of NFATc1 downregulates E-cadherin and promotes cancer cell invasion. Cancer Res. 2013;73(16):5100–9.
58. Billadeau DD. T cell activation at the immunological synapse: vesicles emerge for later signaling. Sci Signal. 2010;3(121):16.
59. Lindsey S, Langhans SA. Chapter one-epidermal growth factor signaling in transformed cells. Int Rev Cell Mol Biol. 2015;314:1–41.
60. Li F, Zhu YT. HGF-activated colonic fibroblasts mediates carcinogenesis of colonic epithelial cancer cells via PKC-cMET-ERK1/2-COX-2 signaling. Cell Signal. 2015;27(4):860–6.
61. Casbas-Hernandez P, D’Arcy M, Roman-Perez E, Brauer HA, McNaughton K, Miller SM, Chhetri RK, Oldenburg AL, Fleming JM, Amos KD. Role of HGF in epithelial-stromal cell interactions during progression from benign breast disease to ductal carcinoma in situ. Breast Cancer Res. 2013;15(5):82.
•fast, convenient online submission
•
thorough peer review by experienced researchers in your field
• rapid publication on acceptance
• support for research data, including large and complex data types
•
gold Open Access which fosters wider collaboration and increased citations maximum visibility for your research: over 100M website views per year
•
At BMC, research is always in progress. Learn more biomedcentral.com/submissions
Ready to submit your research? Choose BMC and benefit from: 62. Di Marzo L, Desantis V, Solimando AG, Ruggieri S, Annese T, Nico B,
Fumarulo R, Vacca A, Frassanito MA. Microenvironment drug resistance in multiple myeloma: emerging new players. Oncotarget. 2016;7(37):60698. 63. Laverty H, Wakefield L, Occleston N, O’Kane S, Ferguson M. TGF-β 3 and
cancer: a review. Cytokine Growth Factor Rev. 2009;20(4):305–17. 64. Okamura T, Morita K, Iwasaki Y, Inoue M, Komai T, Fujio K, Yamamoto K.
Role of TGF-beta3 in the regulation of immune responses. Clin Exp Rheu-matol. 2015;33(4 Suppl 92):63–9.
65. Hayashi K, Jutabha P, Endou H, Sagara H, Anzai N. LAT1 is a critical trans-porter of essential amino acids for immune reactions in activated human T cells. J Immunol. 2013;191(8):4080–5.
66. Zhang Z, Xuan Y, Jin X, Tian X, Wu R. CASP-9 gene functional polymor-phisms and cancer risk: a large-scale association study plus meta-analysis. Genet Mol Res. 2013;12(3):3070–8.
67. Wang I-NE, Mitroo S, Chen FH, Lu HH, Doty SB. Age-dependent changes in matrix composition and organization at the ligament-to-bone inser-tion. J Orthop Res. 2006;24(8):1745–55.
68. Haleem-Smith H, Calderon R, Song Y, Tuan RS, Chen FH. Cartilage oligo-meric matrix protein enhances matrix assembly during chondrogenesis of human mesenchymal stem cells. J Cell Biochem. 2012;113(4):1245–52. 69. Wang I-NE, Shan J, Choi R, Oh S, Kepler CK, Chen FH, Lu HH. Role of
osteoblast-fibroblast interactions in the formation of the ligament-to-bone interface. J Orthop Res. 2007;25(12):1609–20.
70. Zatkova A, Schoch C, Speleman F, Poppe B, Mannhalter C, Fonatsch C, Wimmer K. GAB2 is a novel target of 11q amplification in AML/MDS. Genes Chromosomes Cancer. 2006;45(9):798–807.
71. Xia J, Levy RM. Molecular dynamics of the proline switch and its role in CRK signaling. J Phys Chem B. 2014;118(17):4535–45.
72. Senda T, Shimomura A, Iizuka-Kogo A. Adenomatous polyposis coli (Apc) tumor suppressor gene as a multifunctional gene. Anat Sci Int. 2005;80(3):121–31.
73. López ÁV, García MNV, Melen GJ, Martínez AE, Moreno IC, García-Castro J, Orellana MR, González AGZ. Mesenchymal stromal cells derived from the bone marrow of acute lymphoblastic leukemia patients show altered BMP4 production: correlations with the course of disease. PLoS ONE. 2014;9(1):84496.
74. Yu M, Al-Dallal S, Al-Haj L, Panjwani S, McCartney AS, Edwards SM, Manju-nath P, Walker C, Awgulewitsch A, Hentges KE. Transcriptional regulation of the proto-oncogene Zfp521 by SPI1 (PU. 1) and HOXC13. Genesis. 2016;54(10):519–33.
75. Gagliardi PA, di Blasio L, Primo L. PDK1: a signaling hub for cell migration and tumor invasion. Biochim Biophys Acta. 2015;1856(2):178–88. 76. Hargreaves CE, Rose-Zerilli MJ, Machado LR, Iriyama C, Hollox EJ, Cragg
MS, Strefford JC. Fcγ receptors: genetic variation, function, and disease. Immunol Rev. 2015;268(1):6–24.
77. Håkelien A-M, Landsverk HB, Robl JM, Skålhegg BS, Collas P. Reprogram-ming fibroblasts to express T-cell functions using cell extracts. Nat Biotechnol. 2002;20(5):460–6.
78. Bhattacharya P, Budnick I, Singh M, Thiruppathi M, Alharshawi K, Elshabrawy H, Holterman MJ, Prabhakar BS. Dual role of GM-CSF as a
pro-inflammatory and a regulatory cytokine: implications for immune therapy. J Interferon Cytokine Res. 2015;35(8):585–99.
79. Pilling D, Zheng Z, Vakil V, Gomer RH. Fibroblasts secrete Slit2 to inhibit fibrocyte differentiation and fibrosis. Proc Natl Acad Sci. 2014;111(51):18291–6.
80. Roschger C, Cabrele C. The Id-protein family in developmental and cancer-associated pathways. Cell Commun Signal. 2017;15(1):7. 81. Itoh A, Levinson SF, Morita T, Kourembanas S, Brody JS, Mitsialis SA.
Structural characterization and specificity of expression of E2F–5: a new member of the E2F family of transcription factors. Cell Mol Biol Res. 1994;41(3):147–54.
82. Han T, Xiang D-M, Sun W, Liu N, Sun H-L, Wen W, Shen W-F, Wang R-Y, Chen C, Wang X. PTPN11/Shp2 overexpression enhances liver cancer progression and predicts poor prognosis of patients. J Hepatol. 2015;63(3):651–60.
83. Ling L, Nurcombe V, Cool SM. Wnt signaling controls the fate of mesen-chymal stem cells. Gene. 2009;433(1):1–7.
84. Hamill KJ, Hiroyasu S, Colburn ZT, Ventrella RV, Hopkinson SB, Skalli O, Jones JC. Alpha actinin-1 regulates cell-matrix adhesion organization in keratinocytes: consequences for skin cell motility. J Invest Dermatol. 2015;135(4):1043–52.
85. Ostrowska Z, Robaszkiewicz K, Moraczewska J. Regulation of actin filament turnover by cofilin-1 and cytoplasmic tropomyosin isoforms. Biochim Biophys Acta. 2017;1865(1):88–98.
86. Gad AK, Nehru V, Ruusala A, Aspenström P. RhoD regulates cytoskeletal dynamics via the actin nucleation-promoting factor WASp homologue associated with actin Golgi membranes and microtubules. Mol Biol Cell. 2012;23(24):4807–19.
87. Kanellos G, Frame MC. Cellular functions of the ADF/cofilin family at a glance. J Cell Sci. 2016;129(17):3211–8.
88. Thiery JP. Epithelial–mesenchymal transitions in tumour progression. Nat Rev Cancer. 2002;2(6):442–54.
89. Gagarina V, Carlberg AL, Pereira-Mouries L, Hall DJ. Cartilage oligomeric matrix protein protects cells against death by elevating members of the IAP family of survival proteins. J Biol Chem. 2008;283(1):648–59. 90. Kim J-W, Dang CV. Cancer’s molecular sweet tooth and the Warburg
effect. Cancer Res. 2006;66(18):8927–30.
91. Palacios EH, Weiss A. Function of the Src-family kinases, Lck and Fyn, in T-cell development and activation. Oncogene. 2004;23(48):7990–8000. 92. Kelly AP, Finlay DK, Hinton HJ, Clarke RG, Fiorini E, Radtke F, Cantrell DA. Notch-induced T cell development requires phosphoinositide-depend-ent kinase 1. EMBO J. 2007;26(14):3441–50.
93. Huang W-Q, Lin Q, Zhuang X, Cai LL, Ruan RS, Lu ZX, Tzeng CM. Structure, function, and pathogenesis of SHP2 in developmental disorders and tumorigenesis. Curr Cancer Drug Targets. 2014;14(6):567–88.
94. Peng SL, Gerth AJ, Ranger AM, Glimcher LH. NFATc1 and NFATc2 together control both T and B cell activation and differentiation. Immunity. 2001;14(1):13–20.
95. Olechnowicz SW, Edwards CM. Contributions of the host microenviron-ment to cancer-induced bone disease. Cancer Res. 2014;74(6):1625–31.