The Agency Problem, Financial Performance
and Corruption: Country, Industry and
Firm Level Perspectives
Michael Donadelli
1, Marco Fasan
2and Barbara Sveva Magnanelli
31Research Center SAFE, Department of Finance, Goethe University Frankfurt, Frankfurt am Main, Germany 2Department of Management, Ca’ Foscari University, Venice, Italy
3Department of Economics, Universitas Mercatorum, Rome, Italy
This paper studies the relationship between the agency problem, financial performance and corruption from country, industry and firm level perspectives. First, we observe that companies operating in countries with a high level of corruption tend to display relatively low returns. Second, in an industry-by-industry context, we find that the negative relationship between corruption and average stock returns is stronger in specific industries, which we define as ‘corruption sensitive’. Third, at the firm level, we show that agency problems are exacerbated in corruption-sensitive industries. Our study builds on the existing literature in three main areas. First, it proposes a novel macro-based approach aimed at identifying corruption-sensitive industries. Second, it provides evidence supporting that corruption exacerbates agency conflicts. Third, it provides evidence on the generalizability of standard corporate governance predictions to companies operating in corruption-sensitive industries.
Keywords: corruption; financial performance; agency problem; industry
Introduction
Corruption has received an enormous amount of atten-tion in recent literature, much of it devoted to examining its effects on macroeconomic aggregates (e.g., output, consumption, technology stock, investments, and physi-cal capital). Relatively little research, however, has examined the impact of corruption on financial perfor-mance at the country, industry and firm level. In an influential paper, Mauro (1995) observes that corruption can have a sizable adverse effect on economic activity. In particular, it may lower the average growth rate of both the country and the firm. More recent studies exam-ining the effects of corruption on the economic develop-ment and firm performance support this early finding (Doh et al., 2003; Rodriguez et al., 2006; Uhlenbruck
et al., 2006).
At the country level of analysis, this study examines whether companies operating in countries with a rela-tively high level of corruption display weaker financial performances. This issue is of general interest and has
not been fully addressed by previous studies (see Smarzynska-Javorcik and Wei, 2000; Weitzel and Berns, 2006). Unlike existing studies, which focus exclusively on the whole stock market (i.e., country stock indexes), we examine the corruption-performance relationship in an industry-by-industry context. Specifically, we iden-tify industries where the relationship between corruption and financial performance is stronger and define these industries as ‘corruption-sensitive industries’. Policy makers may find our results of interest, as they may want to implement stricter regulations in such industries. This, in turn, could make investors more cautious about investing in specific industries. This novel industry-based approach allows us to show that companies oper-ating in corruption-sensitive contexts may present relevant corporate governance differences, if compared to others, thus motivating our classification and calling for more research into their corporate governance.
At the firm level, we test whether corruption exacer-bates the agency conflicts between managers and owners. The agency problem, identified in 1976 by Jensen and Meckling, relies on the separation between ownership and control in companies characte-rized by dispersed ownership (see Berle and Means, 1932), or between majority shareholders and minority
Correspondence: Marco Fasan, Department of Management, Ca’ Foscari University Venice, San Giobbe – Cannaregio 783, 30121 Venice, Italy. E-mail: [email protected]
DOI: 10.1111/emre.12038
shareholders in companies with a blockholder posses-sing the majority vote and decision power (see Shleifer and Vishny, 1986; La Porta et al., 1999). Managers that are in charge of controlling daily business may exploit the resources of the firm in order to pay public officials to get personal benefits. In doing so, they can establish a direct relationship with the corrupt public officials. Of course, they may also corrupt public officials in order to obtain short-term advantages for the company. However, this might jeopardize the ability of the company to create value in the long-run. In both cases, the company experi-ences an agency problem. Our results suggest that com-panies operating in corruption-sensitive industries do have higher agency costs. We stress that this is in line with recent works aimed at examining agency problems due to corruption.
Given the presence of relatively high agency costs in corruption-sensitive industries, our work examines the effects of corporate governance mechanisms (i.e., board size, board meetings and the percentage of independent directors on the board) on financial performance in corruption-sensitive industries and non-corruption-sensitive industries. We stress that such mechanisms are expected to serve different purposes when the corruption variable is included in the analysis, thus questioning the predictions of standard corporate governance literature. In particular, we show that, while the number of board meetings has the same impact on performance in corruption-sensitive and non-corruption-sensitive indus-tries, board size and the percentage of independent directors do not.
Our paper builds on the existing literature in several areas. First, it sheds light on the effects of corruption on firms’ average financial performance in different indus-tries. Second, it proposes an alternative macro-based criterion to classify industries as corruption-sensitive and non-corruption-sensitive. Third, it shows that agency costs, and consequently corporate governance mechanisms, change depending on the level of corruption-sensitivity. Overall, this study suggests that corruption ought to be seen in an industry-by-industry context and not only at the country level, especially given the increasing globalization of culture and national markets. We conclude by arguing that our results have strong academic, policy-making and investment implications.
Background
Following previous studies (Rose-Ackerman, 1975, 1978; Bardhan, 1997; Treisman, 2000; Svensson, 2005), we refer to corruption as the ‘misuse of public office for private gain’. In other words, we focus on ‘public cor-ruption’, consistently with existing works (Rodriguez
et al. 2006; Uhlenbruck et al. 2006). We divide this
section into three parts in order to provide a literature review for each of the main issues investigated in this paper. In the first subsection, we review the literature examining the relationship between corruption and firms’ financial performance in a country-by-country context; in the second subsection, we analyse previous studies focusing on corruption at the firm level; finally, in the third subsection, we review the literature about corruption and corporate governance.
Corruption within a country and firms’ market performance
Corruption has been seen as a major threat for countries’ economic performance during the last two decades. It has been argued that low average levels of physical capital, human capital (i.e., education) and technology are not solely responsible for the observed mild eco-nomic growth rates in some world regions (Cazzavillan
et al., 2013). Other factors may play a crucial role, such
as corruption, political stability and crime (see Caselli, 2005).
A growing academic and policy consensus is that cor-ruption is often high in low-income countries, and is costly. However, data (see Table 3) suggest that there is a non-negligible degree of heterogeneity in the level of corruption (or in the perception of corruption) among medium and high-income countries as well (see also Prosperi, 2013; Donadelli and Persha, 2014). The real economic consequences of corruption are well known. For example, there are several empirical studies (see Mauro, 1995; Wei, 2000; Gupta et al., 2001) showing that corruption affects a wide range of social and eco-nomic phenomena (e.g., ecoeco-nomic growth, FDI, coun-tries’ healthcare systems, and education). While it is well established that a lower GDP growth rate corresponds to a relatively high level of corruption, little is known about the effects of the corruption of a country on firm perfor-mance as well as on publicly traded firms’ share values. The theory here is that corruption may have a strong effect on financial markets. This is consistent with exist-ing studies showexist-ing that higher corruption within a country is associated with higher borrowing cost, worse corporate governance and lower stock valuation. In a very influential article, Diamonte et al. (1996) observe that average equity market returns in countries experi-encing increased corruption levels (i.e., increased politi-cal risk) are significantly higher than in countries experiencing decreased corruption levels. In a theoreti-cal setup, Garmaise and Liu (2005) show that in pres-ence of corruption – measured by the percentage of dishonest managers – a firm’s values as well as its profits are reduced. It turns out that the realized equity returns, in the presence of corruption, may be lower both at the country and firm level. Lee and Ng (2006) find that the level of corruption within a country – measured
by Transparency International’s Corruption Perception Index – negatively affects expected future cash flows and can have sizable adverse effects on shareholder value. In other words, it may lower average realized returns. Note also that corruption tends to increase a firm’s exposure to systemic risk (i.e., a firm’s betas). As a result, a highly corrupted country may exhibit a higher expected equity risk premium.
Corruption and firm performance
Research on corruption has developed rapidly over the last decades, focusing mainly on managerial reactions to corruption. Smarzynska-Javorcik and Wei (2000) found that higher levels of corruption actually increase the likelihood of entry into the market via joint venture. Shleifer and Vishny (1993) observe that if public offi-cials do not coordinate their extraction of bribes, they fail to internalize the effect of their demands for bribes on other officials’ incomes, leading to a very high level of corruption. Shleifer and Vishny (1994) point out that control rights actually determine the threat point in negotiations between the firm and public official. Bliss and Di Tella (1997) study the relationship between cor-ruption and competition and show that if bureaucrats have power to extract money from firms, they will drive the most inefficient firms out of the market, increasing the profitability of other firms running similar busi-nesses, which, in turn, makes it possible to ask for higher bribes. Svensson (2003) describes the figures that must pay bribes and tries to quantify these bribes. He discov-ers that firms tend to pay bribes when dealing with public officials whose actions directly affect the firm’s business operations.
Another strand of literature focuses on the impact of corruption on foreign direct investment – FDI (Wei, 2000; Smarzynska-Javorcik and Wei, 2005). Among the most recent studies, Habib and Zurawicki (2002) found that FDI are reduced by corruption even when control-ling for political risk and level-of-corruption differences between the home and host countries. Cole et al. (2009), in the Chinese context, observe that investments tend to flow into provinces displaying two main characteristics: (1) a relatively high level of government efficiency; and (2) a strong attitude in fighting against corruption.
Only in more recent years have scholars started to analyse the relationship between corruption levels and firms’ financial performance. However, most of them focus on one single economy. Athanasouli et al. (2012) investigate the relationship between corruption and firm performance in Greece using firm-level data. Focusing on the effect of ‘administrative corruption’, whereby firms engage in corrupt practices and bribery of government officials, they show that corruption is negatively associated with firm size and growth. Teal and McArthur (2002) use survey data to investigate the
importance of corruption in determining firm perfor-mance in Africa. They find that corruption is linked to significant adverse effects on firm performance in two ways: at the firm level, companies that pay bribes have 20 per cent lower levels of output per worker; at the macro level, firms in countries with pervasive corruption are some 70% less efficient than firms in corruption-free countries. Similarly, in the African context, Faruq and Webb (2013) find that less pro-ductive firms are more likely to engage in corrupt activities. In addition, they observe that both poor bureaucratic quality and corruption reduce firm prod-uctivity. Sahakyan and Stiegert (2012) examine the effects of corruption among Armenian firms. They test if corruption is perceived as more favourable among firms that do not face significant competition and are relatively large and young. Gaviria (2002) employs a survey of Latin American private firms to assess the effects of corruption on sales, investment and employ-ment growth at the firm level, and whether bribes and illegal payments by firms reduce bureaucratic inter-ference. The author’s empirical findings suggest the following: (1) corruption substantially reduces sales growth; and (2) corruption and bureaucratic interfer-ence are positively correlated, (i.e., corruption reduces firm competitiveness).
We extend this stream of research further by examin-ing the impact of corruption on firm performance, as measured by stock returns. We focus first on the costs of corruption, which may reduce the performance of the firm. Some research suggests that most severe effects of corruption are due to the uncertainty surrounding corrupt transactions, rather than from their monetary costs (Shleifer and Vishny, 1993). Based on this premise, Doh et al. (2003) point out that corruption can be studied in two parts: (1) the uncertainty of the corrupt transactions, arbitrariness; and (2) the frequency of the corrupt transactions, pervasiveness. Both parts generate two types of costs: direct and indirect costs. Direct costs are represented by bribes, kickbacks, ‘grease’, and result from the direct interaction between the firm and the public officials. These costs can come from both the payment of amounts to the public officials to obtain what the firm needs (e.g., a permit, protection, etc.), as well as from the avoidance of paying corrupt officials. The indi-rect costs could mean higher prices for resources, lower profitability for lost jobs, macroeconomic instability and so on. These costs impact the firm indirectly, mostly via failures of public entities and governments.
Corruption, corporate governance and firm performance
Besides the costs that a firm may be forced to pay in a corrupted environment, other drivers affecting the per-formance of the firm, also potentially distorted by
corruption, should be examined. The most relevant is the firm’s corporate governance. Several studies observe that a good level of governance is positively correlated with good firm performance (Yermack, 1996; Klein, 1998; Gompers et al., 2003; Brown and Caylor, 2006; Chen et al., 2006). A crucial issue is whether corporate governance can enhance the performance of the firm regardless of the level of corruption. In other words, it has been asked whether corporate governance is directly influenced by corruption, losing its positive effect on firm performance. Previous studies have shown how low corporate governance standards raise the cost of capital, lower the operating performance of industries, and impede investment inflows (Agrawal and Knoeber, 1996; Himmelberg et al., 2001; Daily et al., 2003). Due to corporate governance scandals, it has emerged as a major mechanism to better protect the interests of dif-ferent stakeholders (Magnanelli and Pirolo, 2014). As a result, policymakers worldwide have devoted increasing attention to the role of governance against corruption.
Academics, in fact, provide evidence that poor corpo-rate governance breeds corruption. Not surprisingly, rules of corporate governance, such as accountability, transparency, and fairness, influence the motives and constraints of both bribe takers and bribe payers involved in corrupt practices. Wu (2005) focuses on the principal–agent problem in modern corporate systems. He states that many firms still get involved in corrupt practices despite the possibility that the cost of bribery may outweigh the benefit. The agency problem exists when there is a separation between the owners,
princi-pals, and the managers, agents, because their interests
do not go in the same direction (Jensen and Meckling, 1976; Fama, 1980; Fama and Jensen, 1983). The primary interest of the owners is to maximize the return from their investments, while the main interest for man-agers is to: (1) maximize their profit; (2) maintain their position; and (3) gain personal benefits (Johnson et al., 2009; Robinson and Sartore, 2011). As Wu (2005) points out, ‘bribery may offer the managers the opportunity to cash in on any immediate upside movement from bribery activity while leaving the future potential risk and cost to the owners or shareholders’ (p. 155). The possibility of getting business through bribery may allow a manager to temporarily hide his failure to enhance the value of the company, and bribery could permit the manager to evade his duty without facing the consequence of such conduct. Thus, according to exist-ing literature, corporate governance seems to reduce the likelihood of managers committing corrupt actions.
Hypothesis Development
This section is divided into three different parts, consist-ent with our literature background and paper’s main
goals. The first subsection focuses on the effect of cor-ruption within a country on firm market performance (Hypothesis 1). The second subsection is about corrup-tion and agency conflicts arising within firms (Hypoth-esis 2). The third subsection relies on how corporate governance influences firm performance in corruption-sensitive industries (Hypotheses 3, 4, 5).
Corruption and financial performance of firms at country level
Over the last 20 years, global markets have become increasingly integrated. This has improved both cross-country and cross-industry risk-sharing opportunities. In economic terms, investors have more possibilities to be insured against bad states of nature, both domestically and internationally. However, cross-country differences in the amount of ‘frictions’ may induce economic agents to behave differently. For example, a higher level of corruption (or a higher perception of corruption) intro-duces market frictions, which forces investors to move capital from ‘high-corrupted countries/industries’ to ‘low-corrupted countries/industries’. In doing so, they improve consumption smoothing (i.e., they increase insurance benefits against bad economic times). There-fore, countries experiencing a relatively low level of corruption tend to exhibit higher capital inflow amounts. Consequently, investment and output increases, that is, equity firm performance increases. In such a scenario, we should observe higher average equity returns. Thus, aligned with previous research (Jain 2001; Donadelli and Persha 2014), we hypothesize that investors tend to re-balance their portfolio by taking long positions in less corrupted environments. Formally,
Hypothesis 1: The higher the country level
corrup-tion, the lower a firm’s average return.
Corruption, industries and firm performance
The second part of this paper examines the effects of corruption in a firm-by-firm context. In order to frame (and test) our hypotheses, we follow the following scheme: first, firms are classified into ten different indus-tries. Based on the strength of the relationship between average corruption and average return, industries are then divided into two categories: ‘corruption-sensitive industries’ and ‘non-corruption-sensitive industries’.
In order to set the hypothesis, we rely on the agency theory framework (Jensen and Meckling, 1976). Man-agers are the figures that actually manage and run the firm. They make decisions, they evaluate alternatives and they look for business opportunities. With more power and information than the owners, they can exploit their position in order to gain personal benefits (Johnson
due to their role and position, they are the most exposed to the possibility of offering bribes to public officials (i.e., to engage in corruption). In order to maintain (or gain) privileges and bonuses, managers may accept opportunities arising from corrupt activities, because it could be useful for their goals in the short term. Anec-dotal evidence suggests that companies can obtain busi-ness opportunities through bribes (especially in cases where the buyer is the government). For example, in 2012, Pfizer violated the Foreign Corrupt Practices Act (FCPA) when its subsidiaries bribed doctors and other healthcare professionals employed by foreign govern-ments in order to win business; in 2014, Hewlett-Packard was charged by The Securities and Exchange Commission (SEC) for having violated the FCPA when its subsidiaries in three different countries made improper payments to government officials to obtain or retain lucrative contracts. In 2014, Alcoa Inc. and Alcoa World Aluminium’s subsidiaries repeatedly paid bribes to government officials in Bahrain to maintain a key source of business. In the short term, this behaviour may increase company performance, but it could also expose the company to the risk of being sued (and potentially convicted) for bribery. In other words, in the long term the company may be losing future business opportunities with entities (such as state-owned entities) requiring certain minimum ethical standards of their suppliers. Apart from this situation, where managers have a short-term performance view, managers could also exploit the resources of the firm to pay public officials to get per-sonal benefits and to establish a relationship with those corrupt officials.
In both scenarios (corruption to the benefit of the company and to the personal benefit of the manager), corruption imposes agency costs to the firm. Therefore, companies operating in industries where the relationship between corruption and financial performance is higher may face higher agency costs. In other words, in partici-pating in corruption, managers act following their own interests and not pursuing those of the shareholders, generating a misalignment of interests that imposes costs to the company. This leads to the following hypothesis:
Hypothesis 2: Corruption exacerbates agency
con-flicts between managers and owners.
Corruption, corporate governance and firm performance
The third objective of this study is to test the effect of three corporate governance characteristics (i.e., board size, board meetings and percentage of independent directors) on average firm stock returns.
Corporate governance and its mechanisms should reduce the misalignment of interests between owners
and managers, leading managers to act in order to max-imize profit for shareholders and enhance the value of the firm (Dey, 2008). One of the most important corpo-rate governance mechanisms of a firm is the Board of Directors (BoD), due to its direct control over managers. In this setting, the effectiveness of the BoD seems to be central in reducing the likelihood of corrupt activity by managers. Good governance would reduce the likeli-hood of managers implementing activities that are to the detriment of shareholders (such as corrupt activity).
Previous literature has shown that a good level of governance is positively associated with better financial performance. Our main research question deals with the ability of corporate governance to actually enhance the performance of a firm in settings where corruption has a high impact on financial performance (i.e., corruption-sensitive industries). Therefore, we test the relationship between three board characteristics (i.e., size, percent-age of independent directors and number of board meetings) – usually assumed as indicators of good per-formance – and the market perper-formance of firms in corruption-sensitive industries. The choice of using these indicators is motivated by two main factors. First, they are among those most often studied in previous works (for board size, see Alexander et al., 1993; Yermack, 1996; for percentage of independent directors, see Hermalin and Weisbach, 1998; Harris and Raviv, 2008; for board meetings see Lipton and Lorsch 1992). Second, since our work could be useful for companies and investors, these indicators are both more easily man-ageable to companies and more easily cognizable to external investors.
We stress that the issue is relevant because it allows the contextualization of predictions of ‘standard’ corpo-rate governance literature in settings where the influence of corruption is stronger and where the tasks that the corporate governance system needs to perform are dif-ferent. We look at industries where the relationship between corruption and performance is stronger, and analyse whether board size, board meetings and inde-pendent directors have different effects on performance, compared to what the existing literature predicts.
The relationship between board size and board effec-tiveness has received much attention in the academic field. On the one hand, studies supporting a positive relationship between board size and the effectiveness of monitoring (and therefore financial performance) rely on the resource dependence theory (see Salancik and Pfeffer, 1978; Alexander et al., 1993). These studies argue that large boards provide valuable resources to the organization, leading to better operations. This theoreti-cal argument is tested (and confirmed) by several empirical analyses (see Mak and Li, 2001; Di Pietra
et al., 2008).
Despite this vast literature, several other studies argue that small boards are more effective than large boards
because larger boards will experience greater difficulty in reaching an agreement and in exercising their power with the CEO. According to Steiner (1966), larger boards lose actual productivity because of losses in motivation and coordination. Lipton and Lorsch (1992) argue that the lack of time and the size of the board may lead to lack of cohesiveness and to boards not being able to work towards a common objective. Various empirical analyses support the negative association between board size and CFP (Yermack, 1996; Eisenberg et al., 1998).
This study is aimed at understanding the effect of board size on a firm’s average performance in corruption-sensitive industries. We argue that, in the context of industries where the relationship between cor-ruption level and financial performance is stronger, a larger board size means a higher probability for directors to be in contact with public officials offering the pos-sibility to corrupt. It is reasonable to expect that corrup-tion will arise from direct knowledge between managers and public officials. In particular, the board of directors has an important role in shaping the strategy of the company and has a deep knowledge of the company. Therefore, it may be that the higher the number of board members, the higher the potential for corruption. As mentioned in the previous section, higher levels of corruption will cause a decrease in the performance of the company, therefore we can hypothesize that, in corruption-sensitive industries, the larger the size of the board, the higher the corruption activity, and the lower the financial performance, compared to non-corruption-sensitive industries. Therefore, we propose the following hypothesis:
Hypothesis 3: The negative association between
board size and returns is stronger in corruption-sensitive industries.
Previous literature on the efficiency of the board pre-dicts that the higher the number of board meetings, the better the governance of the firm (Lipton and Lorsch, 1992), considering that more meetings would imply deeper control and better knowledge of the company’s situation.
In the particular context of high-corruption industries, we question whether this relationship is still valid or not. We argue that increasing the number of board meetings could actually raise the possibility of exchanging infor-mation and contacts, and of implementing potential corrupt activities. As we do not make any predictions on causality, it may also be that managers pressure boards to meet more often in order to increase the possibility of sharing useful information to engage in corrupt activ-ities. This leads to the following hypothesis:
Hypothesis 4: The association between board
meet-ings and returns is negative in corruption-sensitive industries.
The issue of the effectiveness of outside directors as monitors has been widely debated in literature. Fama (1980) and Fama and Jensen (1983) provide the tradi-tional argument that outside directors will be more effec-tive monitors because of their strong inceneffec-tive to develop a reputation as decision control experts in the labour market. Conversely, other authors cast doubt on the effectiveness of outside directors as efficient moni-tors (see Hermalin and Weisbach, 1998; Jensen, 1993; Harris and Raviv, 2008). In the empirical literature, there seems to be a consensus on the beneficial role of outside directors on CEO turnover sensitivity to financial performance (Weisbach, 1988; Rosenstein and Wyatt, 1990; Goyal and Park, 2002).
The independent directors would ensure external control over the managers and the internal directors, avoiding, or at least reducing, the corrupt activities that could take place. Thus, we argue that boards with a higher percentage of independent directors in corruption-sensitive industries will have a stronger posi-tive effect on the performance of the firm, compared to non-corruption-sensitive industries. The market, in fact, will recognize and appreciate the presence of this effi-cient control mechanism, which could reduce agency costs. Thus, coherently with the predictions of Hypoth-esis 2, we refer to corruption as an agency cost. There-fore, we posit that the positive effect of independent directors on performance will be stronger in the context of corruption-sensitive industries. This leads to the fol-lowing hypothesis:
Hypothesis 5: The positive association between
independent directors and returns is stronger in corruption-sensitive industries.
Methodology
Our research includes three levels of analysis. For each level, different data have been collected and employed to test the set of hypotheses raised in the previous section. In what follows, we report a detailed description of our data sets and empirical strategies.
Data description
We use both corruption and financial data for the follow-ing countries: Australia, Canada, France, Germany, Italy, Japan, United Kingdom and United States. The choice of using these countries is motivated by two main factors. First, over the period 2002–2012, they accounted for approximately 70% of world market capitalization (Word Economic Indicators – World Bank) and for 60% of the World GDP (World Economic Outlook Databases – International Monetary Fund). Second, since one of the ultimate goals of the paper is to test whether standard
agency theory holds in corruption-sensitive industries, we selected countries that have been covered by that literature.
Country-level data on corruption are obtained through the Worldwide Governance Indicators (WGI), which is a research data set summarizing views on quality of governance provided by a large number of enterprises, citizens and expert survey respondents in advanced and developing countries. These data are gathered from a number of survey institutes, think tanks, non-governmental organizations, international organizations, and private industry firms. In particular, the indicator of interest in this paper is the control of corruption, which
reflects perception of the extent to which public power is
exercised for private gain, including both petty and grand forms of corruption, as well as capture of the state by elites and private interests. The control of corruption variable ranges from approximately –2.5 (weak control meaning high corruption) to 2.5 (strong control meaning low corruption). The countries’ average levels of corrup-tion are reported in Table 1.
Firms are classified by industry according to the Industry Classification Benchmark (ICB), jointly created by the FTSE and Dow Jones. The following
industries are considered: basic materials, consumer goods, consumer services, financials, industrials, healthcare, oil & gas, telecommunications, technology, utilities.
Table 2 reports the number of firms included in each country and in each industry. For each firm, the follow-ing set of variables is used: Returns (Ret); Return
on Assets (ROA); Number of Board Meetings
(BoardMeeting); Percentage of Board Independent
Directors (Independent%): Market Capitalization
(MarketCap); Financial Debt (Debt); Change in Cash
(CashChange). Data have been retrieved from
Bloomberg. We stress that each variable is averaged over the period 2002–2012. This implies that there is one observation per firm (in each country and in each indus-try). We report the main descriptive statistics in Table 3.
Empirical strategy
Our empirical scheme is composed by three distinct analyses. First, at the country level, we re-examine the relationship between corruption and stock market per-formance. In the spirit of Prosperi (2013) and Donadelli and Persha (2014), this is developed, via standard scatter plots, in an industry-by-industry context. Our results confirm the existence of a strong relationship between corruption and financial performance across countries. Second, via a standard OLS regression – where the dependent variable is represented by returns and the independent variable is the level of corruption – we examine whether there is heterogeneity in the strength of such a relationship among different industries. The R-square is employed to classify the industries that display a stronger relationship. In doing this, we are able to classify industries as ‘corruption-sensitive’ (relatively high R-square) or ‘non-corruption-sensitive’ (relatively low R-square). Thus, ‘corruption-sensitive industries’ are those where the relationship between the level of corruption within a country and the related industry stock market performance is stronger. Descriptive statis-tics for ‘corruption-sensitive industries’ are reported in Table 4. The t-test suggests that, in general, there are
Table 1 Control of corruption in sample countries
Country Control of Corruption Australia 2.01 Canada 1.99 France 1.39 Germany 1.80 Italy 0.23 Japan 1.27 United Kingdom 1.78 United States 1.50 The strongest 2.01 The weakest 0.23
This table reports average control of corruption indicator over the period 2002–2012, which ranges from approximately −2.5 (weak) to 2.5 (strong). Source: Worldwide Governance Indicators.
Table 2 Total number of firms by industry and country
Country\Industry BasMats ConsG ConsS Financ HC Industr Oil&Gas Tech Telec Utilities Total by country Australia 828 86 114 308 108 199 150 66 21 25 1,905 Canada 292 37 78 426 38 98 146 41 6 19 1,181 France 28 123 133 394 63 174 19 139 7 20 1,100 Germany 41 95 91 284 47 152 26 114 10 17 877 Italy 5 47 34 67 8 59 9 23 3 17 272 Japan 270 513 614 456 152 994 15 394 15 33 3,456 United Kingdom 131 93 185 426 76 281 94 125 19 19 1,449 United States 107 152 200 727 84 301 206 92 12 77 1,958 Total by industry 1,702 1,146 1,449 3,088 576 2,258 665 994 93 227 12,198
significant differences, between corruption-sensitive and non-corruption-sensitive industries.
Third, in order to test our firm-level hypotheses, we run an OLS regression where the dependent variable is the 10-year average stock market return for each company and the explanatory variables are the board characteristics (i.e., size, percentage of independent directors and number of board meetings). Since we are interested in testing the impact of our corporate govern-ance variables on companies operating in environments displaying different corruption levels, we run the regres-sion by focusing first on corruption-sensitive and sub-sequently on non-corruption-sensitive industries. The basic regression takes the following form:
Re
%
t ROA BoardMeeting BoardSize Independent Ma = + + + + + α β β β β4 1 2 β5 rrketCap3 Debt CashChange +β6 +β7 +ε (1)
where Ret is the average stock market return; ROA is average return on assets; BoardMeeting is the average number of meetings held by the board; BoardSize is the average number of board members; Independent% is the average percentage of independent directors on the board. MarketCap is the average value of common equity, Debt denotes average debt, and CashChange is the average change in cash. Note that all quantities in equation (1) are averaged over the period 2002–2012, consistently with a similar cross-sectional approach that can be found in Edison et al. (2002).
Empirical results
We start the analysis by looking at the unconditional relationships among variables. Estimation results are presented in Table 5. We can see that Returns are signifi-cantly correlated with all of our three variables of interest (Board meetings, Board size and Independent %). More specifically, Board meetings and Board size are nega-tively and significantly correlated with Returns, while Independent % is positively correlated with Returns. Overall, these first findings show that the selected board characteristics do have an impact on Returns, and thus, deserve more attention.
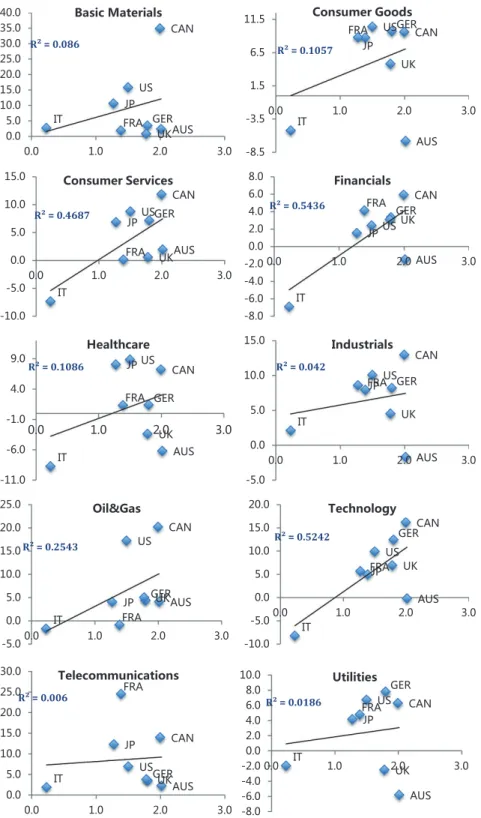
In order to test our Hypothesis 1, we rely on the results shown in Figure 1. Figure 1 plots the average returns (on the vertical axis) against the average level of control of corruption (on the horizontal axis) in the sample countries. Results are reported for ten different industries (basic materials, consumer goods, consumer services, financials, industrials, healthcare, oil & gas, telecommunications, technology, utilities). Overall, we observe a positive relationship, that is, industry average returns increase as the level of corruption decreases (moves towards 2.5) or, in other words, as the level of the control of corruption increases. We stress that this
Table 4 Descriptive statistics (corruption sensitive industries)
Variable N Mean Standard
Deviation t-test
Returns 6,196 0.043 0.235 6.09***
Return on Assets (ROA) 4,498 0.529 147.32 −4.11*** Board meetings 1,833 11.10 5.08 2.78*** Board size 1,953 9.00 3.203 0.779 Independent % 1,905 0.492 0.325 −8.03*** Market Capitalization 4,412 2,508 11,779 −2.21** Debt 4,592 3,723 37,732 −5.77*** Cash Change 4,505 60.618 657.65 −5.10*** This table reports descriptive statistics for the subsample of observations included in corruption sensitive industries. It futher reports the result of a t-test performed in order to compare the characteristics of the subsample of observations operating in corruption sensitive industries against the rest of the sample.
Levels of significance are indicated by: *p< 0.10, **p < 0.05, ***p< 0.01.
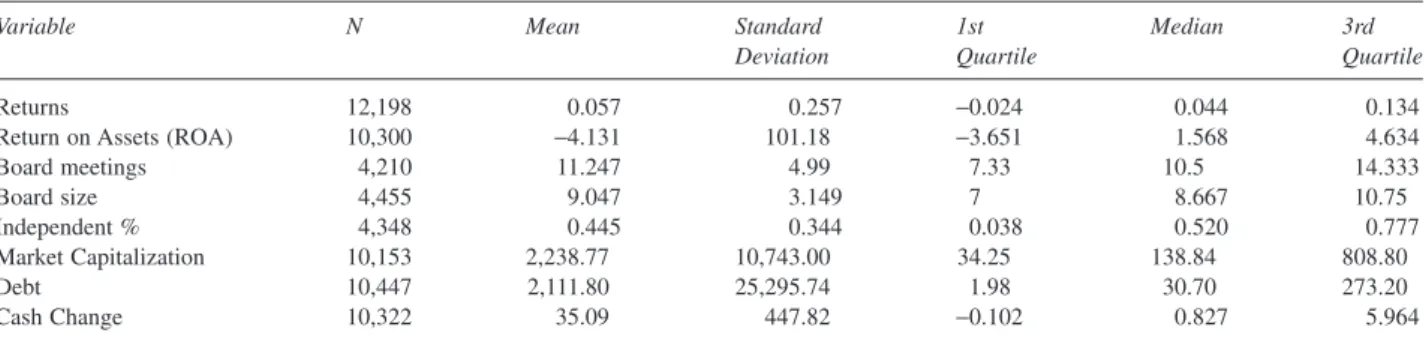
Table 3 Descriptive statistics (whole sample)
Variable N Mean Standard
Deviation 1st Quartile Median 3rd Quartile Returns 12,198 0.057 0.257 −0.024 0.044 0.134
Return on Assets (ROA) 10,300 −4.131 101.18 −3.651 1.568 4.634
Board meetings 4,210 11.247 4.99 7.33 10.5 14.333 Board size 4,455 9.047 3.149 7 8.667 10.75 Independent % 4,348 0.445 0.344 0.038 0.520 0.777 Market Capitalization 10,153 2,238.77 10,743.00 34.25 138.84 808.80 Debt 10,447 2,111.80 25,295.74 1.98 30.70 273.20 Cash Change 10,322 35.09 447.82 −0.102 0.827 5.964
This table reports descriptive statistics for the variables used in our analyses. We report the mean, standard deviation and values of the interquartile range for the following variables: Returns is the average 10-year return in the 2002–2012 period. ROA is the 10-year average return on assets. Board meetings is the average number of meetings held by the board during the 2002–2012 period. Board size is the average number of board members during the 2002–2012 period. Independent % is the average percentage of independent directors on the board during the 2002–2012 period. Market Capitalization (multiplier: billions) is the average value of common equity during the 2002–2012 period. Debt (multiplier: billions) is the 10-year average debt. Cash change is the change in cash, averaged over the 2002–2012 period.
negative relationship between corruption and perfor-mance is stronger in the following industries: consumer services, financials, oil & gas and technology. Therefore, the order of magnitude of the co-movement between returns and corruption varies among industries. Of course, this has strong asset allocation implications. By focusing on emerging stocks, Donadelli and Persha (2014) obtain a similar result. Specifically, they observe that the negative relationship between stock market excess return and control of corruption is stronger in the following industries: basic materials, consumer goods, financials, industrials.
Entries in Table 6 report the effect of the board char-acteristics on returns and, of course, allow us to test for hypotheses 2, 3, 4 and 5.
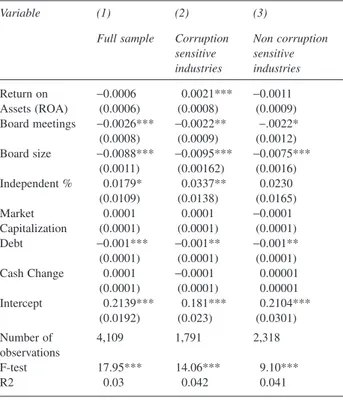
Model 1 shows that the three variables of interest are significant. In particular, Board meetings and Board size are negatively associated with returns, while Independ-ent % is positively associated with the dependIndepend-ent vari-able at the 10% significance level. Model 2 and model 3 are run respectively over a subsample of companies operating in corruption-sensitive and non-corruption-sensitive industries. The comparison of significance levels and the coefficients’ magnitude allows us to answer our research questions.
Board meetings are significant both in model 2 and in model 3, and the magnitude of the coefficients is roughly the same. This suggests that the association between the number of meetings held by the board and the ability of the company to produce positive cash flows in the future (as measured by returns) is not dif-ferent between the two subsamples. The number of board meetings has been analysed by the literature and associated with higher efficiency and control of the board (Lipton and Lorsch, 1992). Our results suggest that the higher the number of board meetings, the lower the market returns. Board size is significant at the 1% level in all the three models, but while the coef-ficient is –0.0095 in model 2, it is –0.0075 in model 3. This suggests that the economic significance of Board size is higher for companies operating in industries in which the negative relationship between corruption and
financial performance is higher. Finally, the percentage of independent directors is, in the overall sample, posi-tively correlated with returns, as shown by the coeffi-cient 0.0179. However, this result seems to be driven mainly by those companies operating in corruption-sensitive industries. In fact, model 2 shows that the coefficient of the variable Independent % is positive and significant at the 5% level, while model 3 shows that the same variable is not significant.
Overall, these empirical findings confirm Hypothesis 2: companies operating in industries where the effect of corruption on performance is higher will have to face higher conflicts of interests between managers and owners. In other words, corruption exacerbates agency conflicts between managers and owners.
The negative association between Board size and performance is stronger in corruption-sensitive indus-tries. In line with previous works (see Yermack, 1996; Eisenberg et al., 1998), this suggests that a larger board is less effective in monitoring management, and that this effect is stronger in companies operating in corruption-sensitive industries, where the conflicts between manag-ers and ownmanag-ers are stronger and need a more effective board to keep them under control. Besides this effect, this empirical result is also consistent with another argu-ment proposed in framing Hypothesis 2: the higher the number of board members, the higher the potential for corruption. Board members have a central role in the firm and potential chances for corruption are likely to arise because of direct interactions between board members and public officials.
Looking at the Independent % variable, we see that a higher percentage of independent directors is associated with better performance for companies operating in corruption-sensitive industries, suggesting once again that in those industries, the agency problem is more severe. In fact, these companies benefit to a greater extent from the corporate governance mechanism that is meant to reduce the agency problem, coherently with previous studies (Fama, 1980; Fama and Jensen, 1983). Our results, overall, provide evidence confirming our Hypothesis 2. Managers operating in high-corruption
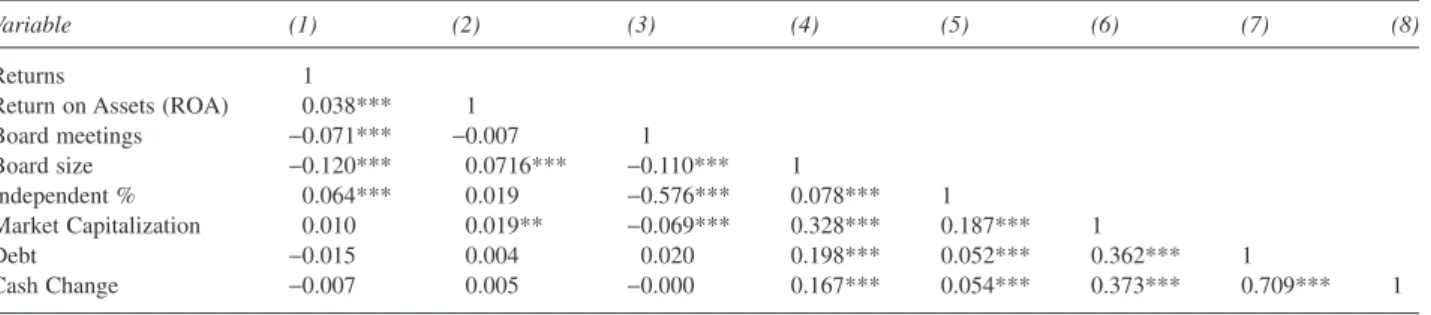
Table 5 Correlation matrix
Variable (1) (2) (3) (4) (5) (6) (7) (8)
Returns 1
Return on Assets (ROA) 0.038*** 1
Board meetings −0.071*** −0.007 1 Board size −0.120*** 0.0716*** −0.110*** 1 Independent % 0.064*** 0.019 −0.576*** 0.078*** 1 Market Capitalization 0.010 0.019** −0.069*** 0.328*** 0.187*** 1 Debt −0.015 0.004 0.020 0.198*** 0.052*** 0.362*** 1 Cash Change −0.007 0.005 −0.000 0.167*** 0.054*** 0.373*** 0.709*** 1
This table displays the Pearson pairwise correlations among our main variables of interest for our sample of observations. Levels of significance are indicated by: *p< 0.10, **p < 0.05, ***p < 0.01.
environments may have incentives to obtain business opportunities providing short-term benefits. However this may jeopardize the company’s ability to create value in the future. Anecdotal evidence shows several cases of
companies that have been convicted for corruption, with a negative impact on their reputation and on their ability to work with other public entities in the long term. Beyond the cases mentioned previously, there are many
Figure 1 Control of corruption vs. industry stock returns
Notes: This figure plots countries’ ‘average control of corruption’ (on the horizontal axis) against ‘industry average stock return’ (on the vertical axis). Industry average returns are computed from stock price indices. Corruption data are from the Worldwide Governance Indicators. Data are annual and run from 2002–2012.
other significant cases (see SEC, 2014). Additionally, they may corrupt public officials, using resources of the firm, in order to gain personal benefits.
These results make significant contributions to aca-demic literature, and in particular to the vast stream of literature relying on the agency theory. The theory (see Berle and Means, 1932) has been absolutely central for many academic studies in the field of man-agement and accounting. Over the years, the agency theory has been refined and adapted to different con-texts. In firms characterized by concentrated owner-ship, in particular family firms, which provide typical evidence in Continental Europe, the agency conflict is not between managers and owners (as in classic agency theory), but rather between majority and minority shareholders (see Shleifer and Vishny, 1986; La Porta
et al., 1999).
In our article, we show that agency problems are more severe in corruption-sensitive industries. We employ a new construct (the level of corruption) in order to further investigate how the agency theory applies to different
contexts. We focus on the level of corruption existing in some countries/industries, looking at the impact of this phenomenon on agency theory problems. This repre-sents an important step towards the adaptation of the agency theory to different contexts in modern globalized society.
Finally, we analyse the single board characteristics and their effects on returns. Hypothesis 3 is confirmed, because the economic significance of the coefficient of Board size is higher in model 2 compared to model 3. Therefore, higher board sizes are associated with a lower stock market performance, in line with previous studies (see Lipton and Lorsch, 1992; Jensen, 1993; Yermack, 1996). Additionally, we observe that the effect is more pronounced for companies operating in corruption-sensitive industries. This result is consistent with prior literature, and the difference in the magnitude of the coefficients suggests that there is a further effect on companies operating in corruption-sensitive industries. The effect may be due to the fact that a higher number of directors increases the probability of companies to be in contact with public officials, which increases the possibility of bribes and corruption activities. Or it may simply be due to the fact that the board is less effective.
Our empirical results do not allow us to draw any definitive evidence for Hypothesis 4, because Board meeting is associated negatively with returns both in model 2 and model 3, also indicating that its effect does not significantly vary between corruption-sensitive and non-corruption-sensitive industries. The result seems counter-intuitive, as Board meeting is negatively associ-ated with returns also in the context of low correlation between performance and corruption. Further analysis is necessary in order to examine the issue more.
Finally, Hypothesis 5 is confirmed, because the percentage of independent directors is significant and positive in the subsample of companies operating in corruption-sensitive industries. This shows that, coher-ently with Hypothesis 2, the companies benefiting from such corporate governance mechanisms to a greater extent are the companies with the greatest need to be protected from corruption. Our results are aligned with previous literature stating that independent directors are believed to be more talented in monitoring managers and CEOs (Fama and Jensen, 1983; Weisbach, 1988).
The analysis provides important insight both for aca-demics and practitioners. As agency theory needs to be contextualized and analysed in different contexts, simi-larly it is important to define the effect of different corporate governance mechanisms on performance. Therefore, companies operating in corruption-sensitive industries may consider this result in order to shape their corporate governance system in the most effective way. Similarly, investors may take the corporate governance characteristics of firms operating in corruption-sensitive
Table 6 Effect of board characteristics on Returns
Variable (1) (2) (3)
Full sample Corruption sensitive industries Non corruption sensitive industries Return on Assets (ROA) −0.0006 0.0021*** −0.0011 (0.0006) (0.0008) (0.0009) Board meetings −0.0026*** −0.0022** −.0022* (0.0008) (0.0009) (0.0012) Board size −0.0088*** −0.0095*** −0.0075*** (0.0011) (0.00162) (0.0016) Independent % 0.0179* 0.0337** 0.0230 (0.0109) (0.0138) (0.0165) Market Capitalization 0.0001 0.0001 −0.0001 (0.0001) (0.0001) (0.0001) Debt −0.001*** −0.001** −0.001** (0.0001) (0.0001) (0.0001) Cash Change 0.0001 −0.0001 0.00001 (0.0001) (0.0001) 0.00001 Intercept 0.2139*** 0.181*** 0.2104*** (0.0192) (0.023) (0.0301) Number of observations 4,109 1,791 2,318 F-test 17.95*** 14.06*** 9.10*** R2 0.03 0.042 0.041
This table analyses the determinants of Returns. The dependent variable is Returns, and the main variables of interest are Board meetings, Board size and Independent %. Model (1) relies on the full sample. Model (2) relies on a subsample of companies included in corruption sensitive industries, defined as the four industries in our sample with the highest R2 in the OLS regression with returns (dependent variable) and level of corruption (independent variable). Model (3) refers to the subsample of companies operating in non-corruption-sensitive industries. Standard errors in parentheses.
Levels of significance are indicated by: *p< 0.10, **p < 0.05, ***p< 0.01.
industries into account in order to make their investment decisions. We emphasize that our study builds on and extends the field of literature on corporate governance mechanisms and their relation with performance.
Conclusions
This study examines the effects of corruption at the country, industry and firm levels, providing new insight for academics as well as practitioners. At the country level, it shows that corruption has (on average) a negative impact on stock returns. This builds on and extends early empirical evidence (see Mauro, 1995; Prosperi, 2013; Donadelli and Persha, 2014). At the industry level, exploiting the magnitude of this macro relationship, we classify firms operating in ‘corruption-sensitive industries’ and ‘non-corruption-sensitive industries’. This is a relevant methodological innova-tion because, to the best of our knowledge, no previous study has operated such a distinction before. This empirical strategy allows us to focus on ten different industries, rather than merely on the country, and to test whether corruption exacerbates agency conflicts. Empirical findings suggest that companies operating in corruption-sensitive industries tend to face higher agency costs. The result is linked to the first part of the paper, providing some rationale to the negative impacts of corruption. Agency theory has played a key role in the academic debate, and will continue to play a key role in the future. Over the years, the initial intuition by Berle and Means (1932) has been developed further, contextualizing and making the construct more refined in different contexts. Our contribution allows the exten-sion of agency theory predictions to contexts (more specifically: industries) with different levels of corrup-tion on performance.
At the firm level, building on the evidence that corruption-sensitive industries have different charac-teristics in terms of agency problems compared to non-corruption-sensitive industries, we examine the ability of three corporate governance mechanisms to protect companies from agency costs in the context of corruption-sensitive industries. Specifically, empirical evidence suggests that the greater the size of the board, the lower the performance, and that this effect tends to be more pronounced in corruption-sensitive industries. Similarly, the positive effect of independent directors on performance is stronger in industries that are corruption-sensitive.
This study provides a relevant contribution to current literature. First, it introduces a methodological innova-tion by classifying industries in corrupinnova-tion-sensitive and non-corruption-sensitive. This allows one to go beyond the standard country-level perspective and focus on the industry level, which we believe will become increasing
relevant in the future, given the increasing globalization of culture and markets. Second, it provides evidence that may be useful to investors, which may take the charac-teristics of corporate governance mechanisms into account in making their investment decisions. Third, it extends agency theory by contextualizing and studying its prediction in different contexts (corruption-sensitive industries).
The present work also has some limitations, which may be addressed by future studies. First, our three-level approach is new and helpful but, at the same time, it offers three sections of information that are not fully integrated. Future research could build on our insights by introducing a truly multivariate analysis that com-bines all three levels into one theoretical model and estimates this multi-level model in one stage. In other words, our work is an important first step towards the creation of a truly multi-level analysis of corruption. Second, we did not analyse companies operating in con-texts of extreme corruption, such as some African and Latin American countries. Such analysis goes beyond the scope of our work, but may be the object of future study, as it deals with even less analysed contexts. Third, future studies may employ different performance meas-ures (such as accounting measmeas-ures of performance) in order to tackle the research issue. Our work is one of the first attempts to link macro (corruption) and micro (firm performance and corporate governance) business dimen-sions. Future research is needed in order to make sig-nificant progress on this theme, and such an effort needs to be accomplished by the whole field of study on cor-porate governance.
Acknowledgements
The authors are grateful for invaluable assistance by Carlo Miclet and Marco Lobbia.
References
Alexander, J. A., M. L. Fennell and M. T. Halpern,1993,
“Leadership instability in hospitals: the influence of Board-CEO relations and organizational growth and decline”,
Administrative Science Quarterly, 38: 74–99.
Agrawal, A. and C. R. Knoeber, 1996, “Firm performance and
mechanisms to control agency problems between managers and shareholders”. Journal of Financial Quantitative
Analy-sis, 31: 377–397.
Athanasouli, D., A. Goujard and P. Sklia, 2012, “Corruption
and firm performance: evidence from Greek firms”.
Interna-tional Journal of Economic Sciences and Applied Research,
5: 43–67.
Bardhan, P., 1997, “Corruption and development: a review of
issues”. Journal of Economic Literature, 35: 1320–1346.
Berle, A. A. and G. C. Means, 1932, The modern corporation
Bliss, C. and R. Di Tella, 1997, “Does competition kill
corrup-tion?”. Journal of Political Economy, 105: 1001–1023.
Brown, L. D. and M. L. Caylor, 2006, “Corporate governance
and firm valuation”. Journal of Accounting and Public Policy,
25: 409–434.
Caselli, F., 2005. “Accounting for cross-country income
differ-ences”. In P. Aghion and S. Durlauf (eds.) Handbook of
Economic Growth. Elsevier, pp. 679–741.
Cazzavillan, G., M. Donadelli and L. Persha, 2013,
“Eco-nomic growth and poverty traps in sub-Saharan Africa: The role of education and TFP shocks”. Research in Economics,
67: 226–242.
Chen, G. M., D. N. Gao and O. M. Rui, 2006, “Ownership
structure, corporate governance and fraud: evidence from China”. Journal of Corporate Finance, 12: 424–448.
Cole, M. A., R. J. R. Elliott, and J. Zhang, 2009, “Corruption,
governance and FDI location in China: A province-level analysis”. Journal of Development Studies, 45: 1494– 1512.
Daily, C. M., D. R. Dalton and A. C. Cannella, 2003,
“Cor-porate governance: Decades of dialogues and data”. Academy
of Management Review, 28: 371–382.
Dey, A., 2008, “Corporate governance and agency conflicts”.
Journal of Accounting Research, 46: 1143–1181.
Diamonte, R. L., J. M. Liew and L. S. Ross, 1996, “Political
risk in emerging and developed markets”. Financial Analysts
Journal, 52: 71–76.
Di Pietra, R., C. A. Grambovas, I. Raonic and A. Riccaboni,
2008, “The effects of board size and ‘busy’ directors on the market value of Italian companies”. Journal of Management
& Governance, 12: 1–19.
Doh, J. P., P. Rodriguez, K. Uhlenbruck, J. Collins and L. Eden, 2003, “Coping with corruption in foreign markets”.
Academy of Management Executive, 17: 114–127.
Donadelli, M. and L. Persha, 2014, “Understanding emerging
market equity risk premia: Industries, governance and mac-roeconomic policy uncertainty”. Research in International
Business and Finance, 30: 284–309.
Edison, H. J., R. Levine, L. Ricci and T. Slock, 2002,
“Inter-national financial integration and economic growth”. NBER Working Paper 9164.
Eisenberg, T., S. Sundgren and M. T. Wells, 1998, “Larger
Board size and decreasing firm value in small firms”. Journal
of Financial Economics, 48: 35–54.
Fama, E. F., 1980, “Agency problems and the theory of the
firm”. Journal of Political Economy, 88: 288–307.
Fama, E. F. and M. Jensen, 1983, “Separation of ownership
and control”. Journal of Law and Economics, 26: 301– 325.
Faruq, H. and M. Webb, 2013, “Corruption, bureaucracy and
firm productivity in Africa”. Review of Development
Econom-ics, 17: 117–129.
Garmaise, M. J. and J. Liu, 2005, “Corruption, firm
govern-ance, and the cost of capital”. Working Paper, Anderson School (UCLA).
Gaviria, A., 2002, “Assessing the effects of corruption and
crime on firm performance: Evidence from Latin America”.
Emerging Markets Review, 3: 245–268.
Gompers, P., J. Ishii and A. Metrick, 2003, “Corporate
gov-ernance and equity prices”. Quarterly Journal of Economics,
118: 107–156.
Goyal, V. K. and C. W. Park, 2002, “Board leadership
struc-ture and CEO turnover”. Journal of Corporate Finance, 8: 49–66.
Gupta, S., H. Davoodi, and E. Tiongson, 2001, “Corruption
and the provision of health care and education services”. In A. K. Jain (ed.) The political economy of corruption. New York: Routledge, pp. 111–141.
Habib, M. and L. Zurawicki, 2002, “Corruption and foreign
direct investment”. Journal of International Business Studies,
33: 291–307.
Harris, M. and A. Raviv, 2008, “A theory of board control
and size”. The Review of Financial Studies, 21: 1797– 1832.
Hermalin, B. E. and M. Weisbach, 1998, “Endogenously
chosen boards of directors and their monitoring the CEO”.
American Economic Review, 88: 96–118.
Himmelberg, C. P., R. G. Hubbard and I. Love, 2001,
“Inves-tor protection, ownership and the cost of capital”. World Bank Policy Research Working Paper 2834.
Jain, A. K., 2001, “Corruption: A review”. Journal of Economic
Surveys, 15: 71–121.
Jensen, M. C., 1993, “The modern industrial revolution, exit,
and the failure of internal control systems”. Journal of
Finance, 48: 831–880.
Jensen, M. C. and W. Meckling, 1976, “Theory of the firm:
Managerial behaviour, agency costs and ownership structure”.
Journal of Financial Economics, 3: 305–360.
Johnson, S. A., H. E. Ryan and Y. S. Tian, 2009, “Managerial
incentives and corporate fraud: The sources of incentives matter”. Review of Finance Work, 13: 113–145.
Klein A., 1998, “Firm performance and board committee
struc-ture”. Journal of Law and Economics, 4: 275–304.
La Porta, R., F. Lopez-de-Silanes and A. Schleifer, 1999,
“Corporate ownership around the world”. The Journal of
Finance, 54: 471–517.
Lee, C. M. and D. Ng, 2006, “Corruption and international
valuation: Does virtue pay?” MPRA Paper 590.
Lipton, M. and J. W. Lorsch, 1992, “A modest proposal for
improved corporate governance”. The Business Lawyer, 48: 59–77.
Magnanelli, B. S. and L. Pirolo, 2014, “Preventing financial
statement frauds through better corporate governance”. LUISS Guido Carli, Working Paper.
Mak, Y. T. and Y. Li, 2001, “Determinants of corporate
own-ership and board structure: evidence from Singapore”.
Journal of Corporate Finance, 7: 235–256.
Prosperi, L., 2013, “Opaque information and rare disasters: The
role of transparency in explaining cross-country differences in the ERP”. Toulouse School of Economics, Working Paper.
Mauro, P., 1995, “Corruption and growth”. Quarterly Journal
of Economics, 110: 681–712.
Robinson, H. D. and R. Sartore, 2011, “Managerial incentives,
fraud, and monitoring”. Financial Review, 46: 281–311
Rodriguez, P., D. S. Siegel, A. Hillman and L. Eden, 2006,
“Three lenses on the multinational enterprise: Politics, cor-ruption, and corporate social responsibility”. Journal of
Inter-national Business Studies, 37: 733–746.
Rose-Ackerman, S., 1975, “The economics of corruption”.
Journal of Public Economics, 4: 187–203.
Rose-Ackerman, S., 1978, Corruption: a study in Political
Rosenstein, S. and J. G. Wyatt, 1990, “Outside directors,
board independence, and shareholder wealth”. Journal of
Financial Economics, 26: 175–191.
Sahakyan, N. and K. W. Stiegert, 2012, “Corruption and firm
performance”. Eastern European Economics, 50: 5–27.
Salancik, G. R. and J. A. Pfeffer, 1978, “Social information
processing approach to job attitudes and task design”.
Admin-istrative Science Quarterly, 23: 224–253.
SEC 2014, “SEC enforcement actions: FCPA cases”, Available
from http://www.sec.gov/spotlight/fcpa/fcpa-cases.shtml. Last accessed 6 November 2014.
Shleifer, A. and R. W. Vishny, 1986, “Large shareholders and
corporate control”. Journal of Political Economy, 94: 461– 488.
Shleifer, A. and R. W. Vishny, 1993, “Corruption”. Quarterly
Journal of Economics, 108: 599–619.
Shleifer, A. and R. W. Vishny, 1994, “Politicians and firms”.
Quarterly Journal of Economics, 109: 995–1025.
Smarzynska-Javorcik, B. and S. J. Wei, 2000, “Corruption
and the composition of foreign direct investment: firm-level evidence”. Discussion paper series – Centre for Economic Policy Research, Vol. DP2967.
Smarzynska-Javorcik, B. and S. J. Wei, 2005, “Pollution
havens and foreign direct investment: dirty secret or popular myth?” Contributions to Economic Analysis & Policy, 3: Article 8.
Steiner, I. D., 1966, “Models for inferring relationships
between group size and potential group productivity”.
Behavioral Science, 11: 273–283.
Svensson, J., 2003, “Who must pay bribes and how much?
Evidence from a cross section of firms”. Quarterly Journal of
Economics, 118: 207–230.
Svensson, J., 2005, “Eight questions about corruption”. Journal
of Economic Perspectives, 19: 19–42.
Teal, F. and J. McArthur, 2002, “Corruption and firm
Performance in Africa”. University of Oxford, Depart-ment of Economics, Economics Series Working Papers: WPS/ 2002–10.
Treisman, D., 2000, “The causes of corruption: A
cross-national study”. Journal of Public Economics, 76: 399– 458.
Uhlenbruck, K., P. Rodriguez, J. Doh and L. Eden, 2006,
“The impacts of corruption on entry strategy: evidence from telecommunication projects in emerging economies”.
Organi-zation Science, 17: 402–414.
Yermack, D., 1996, “Higher market valuation of companies
with a small board of directors”. Journal of Financial
Eco-nomics, 40: 185–211.
Wei, S. J., 2000, “How taxing is corruption in international
investors?”. The Review of Economics and Statistics, 82: 1–11.
Weisbach, M. S., 1988, “Outside directors and CEO turnover”.
Journal of Financial Economics, 20: 431–460.
Weitzel, U. and S. Berns, 2006, “Cross-border takeovers,
corruption, and related aspects of governance”. Journal of
International Business Studies, 37: 786–806.
Wu, X., 2005, “Corporate governance and corruption: A