0
La Chimica è materia,
ma anche immaginazione,
che dà vita all’invisibile agli occhi.
La Chimica è vita e spazio circostante,
è il vuoto e ciò che lo riempie.
La Chimica è l’inizio e l’equilibrio,
la domanda e la risposta,
la magia, la follia.
1
UNIVERSITA’ DEGLI STUDI DI SALERNO
Facoltà di Scienze MM.FF.NN.
Dipartimento di Chimica e Biologia
Dottorato di Ricerca in Chimica – XII CICLO
Tesi di Dottorato
Transport properties of drug precursor molecules
in nanoporous polymers.
Relatore:
Candidata:
Prof. Vincenzo Venditto
Marianna Loria
Mat. 8880700110
Coordinatore
Prof. Gaetano Guerra
2
Summary
Abstract
pag. 4
Chapter 1 – Introduction
pag. 6
1.1 The illegal trafficking of drugs
pag. 9
1.2 CUSTOM device
pag. 15
1.3 Concentrating porous materials
pag. 21
1.4 Nanoporous structures of syndiotactic
polystyrene
pag. 22
1.5 Microporous forms of syndiotactic polystyrene
pag. 25
Chapter 2 - Results and discussion
pag. 32
2.1 Aerogel beads of sPS δ form
pag. 32
2.2 Drug precursors analyzed
pag. 36
2.3 Benzylmethylketone (BMK)
pag. 38
2.4 Ephedrine (Eph)
pag. 49
2.5 Safrole
pag. 50
2.6 Acetic Anhydride (AcAn)
pag. 58
3
Chapter 3 - Experimental part
pag. 96
3.1 Materials and techniques
pag. 96
3.2 Procedure for the preparation of beads of
nanoporous δ sPS aerogel
pag. 97
3.3 Degree of crystallinity
pag. 98
3.4 Porosity evaluation of beads of nanoporous δ
sPS aerogel
pag. 100
3.5 Procedure for the preparation of aqueous
solutions at different concentrations pag. 100
3.6 Procedure for building calibration lines and
equilibrium uptake curves
pag. 101
3.7 Procedure to obtain the desired AcAn
concentration in the air flow
pag. 102
Chapter 4 – Conclusions
pag. 105
4
Abstract
This PhD thesis is framed in the European project CUSTOM, which aims to develop a small size device able to detect drug precursors molecules in the air, even when they are just in traces. The project is part of the European strategies to fight the illegal drug trafficking, that is a serious problem experienced in all countries worldwide. Recently, in fact, drug traffickers smuggle drug precursor molecules, that is molecules that are converted into the final product through chemical processes, once arrived in the country of destination. For this reason many efforts are making to detect the presence of precursors in very low concentrations using dedicated sensors. The low concentration of these kind of molecules requires that the sampling techniques concentrate as much as possible the target analytes. For this purpose, syndiotactic polystyrene (sPS), a cheap and commercial thermoplastic polymer, can be a good choice: it can be achieved in highly porous crystalline morphologies (aerogels) able to maximize molecules sorption and desorption kinetics thanks to their high surface area1. High-porosity sPS aerogels can be
obtained by supercritical CO2 extraction of the solvent
present in sPS physical gels (gels in which the junctions between polymer chains consist of crystalline regions).
5
Furthermore, sPS crystalline aerogels can be achieved in two different nanoporous crystal forms, delta (δ) and epsilon (ε). These two phases present well-defined empty spaces distribute into the crystal lattice as cavities (δ form) or channels (ε form). Both these two crystalline forms are able to rapidly absorb volatile organic compounds (VOCs), mainly halogenated or aromatic hydrocarbons, from water and air also when present at very low concentrations2. This
polymer, combined with a suitable detection system for these precursor molecules, could be a winning choice for the purposes of the CUSTOM project.
Within the project, our tasks and objectives are to evaluate the capacity and the effectiveness of the polymer to absorb some target drug precursors, to validate the air sampling module which will be implemented in the device and, finally, to establish if and how the presence of some common pollutants in the air could affect the sorption of the selected precursors.
6
Chapter 1
Introduction
This PhD thesis is framed and funded by the European research project CUSTOM, acronym of “Drugs and Precursors Sensing by Complementing Low Cost Multiple Techniques”, set up by different companies and scientific research centres under the Seventh Framework Programme of European Union. This research project aims to develop a portable device capable of detecting traces of chemical drug precursors used in the manufacture of the most dangerous drugs on the International market. The device will consist of two detectors (Laser photo-acoustic spectroscopy or LPAS and Light Emitting diode – Induced Fluorescence or LED-IF), a control board and an air sampling part. The core of this latter part is a preconcentrator unit (PCU), based on porous materials necessary to trap and concentrate as much as possible the drug precursors from the air, where they are difficult to detect due to their very low concentration in the vapour phase. Moreover, there is also the need to detect these precursors in a short time because this device is thought to be used in different scenarios such as ports, airports, railway stations, customs and so on.
7 respective tasks are:
1. SELEX-ES (Italy), a new brand of FINMECCANICA holding, world leader of Defence Systems and Sensors and Air Traffic Management and Control. It is in charge of the management of the project, of the definition of sensor and control board requirements and of the device integration and testing.
2. GASERA Ltd. (Finland), a university based spin-off company developing novel technologies for the measurements of gas concentrations, is involved in the architecture of the sensor node.
3. University of Turku (Finland), where its Laboratory of Optics and Spectroscopy is focused on theory and applications of the photoacoustic trace gas detection and on quantum optics, so it takes part in the design of the LPAS sensor chamber.
4. Tecnalia (Spain), a private technological centre providing research and technological development services to institutions and productive industries, here engaged with realization of LED-IF sensor. 5. III-V Lab (France), a private R&D organisation
focused on research in the field of III-V semiconductors. Its task will be the realization of the quantum cascade laser (QCL) for the LPAS
8 sensor.
6. CNR IBP (Italy), the Institute of Protein Biochemistry of the Italian National Research Council that studies proteins and enzymes using the most advanced approaches and techniques, and that in the project deals with fluorescence optochip sensing.
7. ENEA (Italy), the Italian National Agency for New Technologies, Energy and the Environment, a public organisation operating in the fields of energy, environment and new technologies to support competitiveness and sustainable development. Here it is concerned with the design and electronics of air traces sampling part, in particular of the PCU. 8. INSTM (Italy), the National Institute for the Science
and Technology of Materials, a consortium of universities that collects more than 44 Italian institutes. For the execution of this project, the groups representing INSTM are the University of Modena and Reggio Emilia, involved in the design of algorithms to create a data base software, and the University of Salerno, involved in the molecular concentrator of drug precursors from air traces. 9. Aalto University Foundation (Finland), whose
Department of Micro and Nanosciences focuses in optoelectronics, photonics and microelectronics,
9
takes care of microelectromechanical systems (MEMS) of the LPAS sensor.
10. Direction National du Reinsegnement et des Enquêtes Douanières (France), belonging to the French Customs Administration. Its task are the identification of application scenarios and the device test in real environment.
1.1 The illegal trafficking of drugs
The problem of trafficking in illegal drugs is a serious concern that involves various Nations all over the world and many efforts have been made in the past twenty years to stem this problem.
A good way to prevent the trafficking of illegal drugs is intercept them before they are shipped to countries of destination, that is those ones in which they will be consumed. Another way to stop this trafficking is checking the route of substances used to manufacture the drug, also known as chemical precursors (or simply precursors). In fact, the traffickers recently use to smuggle the drug precursors rather than the drugs as such, because it is easier since the same type of drug can be obtained from different precursors. Moreover, a lot of time is needed to point out systems capable to intercept them, so the traffickers can act almost undisturbed and they have
10
enough time to change the way of smuggling until the authorities catch them up.
The chemical precursors are substances that play two essential roles in the production of illegal drugs: both as starting reagents for the production of synthetic drugs and as refining agents and solvents in the processing of plant-based materials.
In the definition of precursors are then included both substances extracted from plants such as opium poppy and coca useful in the production of heroin and cocaine, respectively, which can be easily replaced by other molecules with similar properties, and substances used in synthetic drug (like methamphetamine and ecstasy) production which are incorporated in the final product and are less easily replaceable with other molecules.
The International Narcotics Control Board (INCB) focuses its efforts on preventing the diversion of chemical precursors used in the illicit manufacture of heroin, cocaine and amphetamine-type stimulants. The official reference work for the international control of precursors is the Annex to the Article 12 of the 1988 United Nations Convention Against Illicit Traffic in Narcotic Drugs and Psycothropic Substances3, that establishes two tables
listing 23 substances frequently used in the manufacture of drugs and whose diversion to illicit purposes should be
11
prevented. These tables (collected in the following Table 1.1) are regularly updated to take account of developments and evolutions in the production of illegal drugs, thanks to the information shared by different countries in collaboration with the INCB. The Article 12 and the list of the 23 most common drug precursors under international control were adopted also by European legislation in 1990, even if the substances were separated in three categories4.
12
Table 1.1. Lists of the 23 substances considered chemical precursors by the United Nations Convention.
Table I Table II
Acetic anhydride Acetone
N-Acetylanthanilic acid Anthranilic acid
Ephedrine Ethyl ether
Ergometrine Hydrochloric acid
Ergotamine Methyl ethyl ketone
Isosafrole Phenylacetic acid
Lysegic acid Piperidine
3,4-Methylnedioxyphenyl-2-propanone Sulphuric acid Norephedrine Toluene 1-Phenyl-2-propanone Piperonal Potassium permanganate Pseudoephedrine Safrole
Some substances in “Table I” and “Table II” are indispensable for the manufacture of synthetic drugs (amphetamine-type stimulants), such as ephedrine and pseudoephedrine for methamphetamine; 3,4-Methylnedioxyphenyl-2-propanone, isosafrole and safrole for ecstasy; 1-Phenyl-2-propanone for amphetamine and methamphetamine. Other substances of these tables,
13
instead, are important reagents used in the production of cocaine and heroin, such as potassium permanganate and acetic anhydride.
The substances in the column “Table I” are the less replaceable in the production of illegal drugs and those ones above mentioned are the most seized in the last years, according to the INCB5-6. Anyway, it is not simple for
the authorities to intercept the precursors diverted by the traffickers from their legitimate purposes and licit trades. Diversion from licit trades can be done in many ways. The chemicals may be diverted with the complicity of the chemical producers, even if this is less frequent. Instead, most diversion takes place due to the ability of criminals to exploit gaps in the regulatory frameworks in place to monitor the trade in drug precursors and identify suspicious transactions. International trade in drug precursors can be exploited by traffickers through different means. Precursors can be imported legally into drug-producing countries with official import permits and subsequently diverted into neighbouring illegal drug-producing countries. In parts of the developing world, traffickers often arrange for chemicals to be shipped to countries where no viable regulatory systems exist for their control (figure 1.1).
14
Figure 1.1 Routes of drug precursors diversion
Criminals often conceal their identity by using front-companies or by misusing the names of well-known companies. They also obtain chemicals by bribing or blackmailing the employees of legitimate companies. In some cases they disguise the destination or nature of chemical shipments by mislabelling or re-packaging controlled chemicals as unregulated materials. Traffickers also obtain precursors through theft, either from storage or during transit.
However, in the last years smuggling from third countries into drug producing countries has increased dramatically. This tactic is emerging as a key method in response to the increasing efforts of more countries to implement legislative and administrative controls to prevent diversion
15 from legitimate commercial trade.
1.2 CUSTOM device
The CUSTOM project rises just with the aim to avoid the illegal trafficking of the substances above mentioned and intercept their diversion into illicit uses, by designing and realizing a proper device capable to operate in different kinds of environmental conditions, different scenarios and that is a competitive apparatus. The device, in fact, will be portable to work in scenarios such as ports, airports, railway stations, customs border, where there is a large flow of people, shipments, cars, trucks, trains. It will be also capable to analyze both solid and liquid chemical precursors. Besides, the device is expected to be easy to handle and operate for dimensions, weight, data acquisition; capable of giving trusting results for targeted precursors; having low cost of production, selling, and maintenance.
CUSTOM project partners have made a selection of target chemical precursors that will be detected by the sensors of the device. In order to select the most critical precursors smuggled, only substances listed in the column “Table I” of the United Nations Convention in 1988 have been taken into account, discarding chemicals listed in the column “Table II”. Based on the major trends identified for illicit
16
trafficking in chemical precursors5, on the precursors most
seized in Europe and worldwide, on the objective of the CUSTOM project to reveal precursors for drugs of both vegetal and synthetic origin, the project partners proposed to develop a device for the detection of the following five chemical precursors:
1. 1-Phenyl-2-propanone (or benzyl methyl ketone) 2. Acetic anhydride
3. Safrole 4. Ephedrine
5. Potassium permanganate
Studying the devices already available on the market, the CUSTOM project aims to develop a technology which offers an appropriate detection of the target precursors and can be easily extended and adapted to other precursors detection.
Common characteristics which are also limitation of commercially existing devices are the absence of flexibility respect to the target substances and the uniqueness of the adopted sensing technology. In fact, each device is specific for a fixed number and type of target compounds, while the fight against illicit substances requires adaptive sensors because easier replaceable drug precursors can be easily found in ever changing chemical formulas produced by drug dealers. Moreover, all the commercially existing
17
devices are based on a single detection technique but, for the same reasons mentioned above, it would be better employing more than one detection system.
Among the different techniques already adopted in available devices, those ones selected for CUSTOM sensor device are:
LPAS (Laser Photo-acoustic Spectroscopy) technique that is proven to have high sensitivity for one with respect to other techniques based on infrared spectroscopy for a high probability of detection.
LED-IF (Light Emitting diode – Induced Fluorescence) infrared optochip that is a low cost, compact device that can be made very selective with respect to the various drug specimens for a low probability of false alarm.
The LPAS sensor is highly sensitive but poorly selective towards the target drug precursors molecules, so if it gives a positive answer to the presence of one of these molecules, then the LED-IF technique, more selective than the first one, will be able to say definitely whether the molecule in question is actually present or not in the analyzed sample. Furthermore, both technologies will be enhanced.
18
The fluorescence signal will be intensified by development of organic macromolecules sensitive to specific classes of compounds involving our target molecules. The fluorescence analysis will be based on an optochip which can incorporate an array of different fluorescent chemical proteins able to bind to the analytes. An array classes of compounds will be thus fast discriminated by one-shot measurement. Thus, the probability of detection of the LED-IF technique will be increased.
The selectivity of medium infra-red (MIR) and microelectromechanical systems (MEMS) cantilever based photoacoustic cell (PAS) techniques will be improved by adopting a high power, high stability and tunable quantum cascade laser (QCL).
Anyway, to increase the sensitivity and the selectivity of both kinds of sensors, it is necessary to concentrate the precursors. For this reason in the architecture of the CUSTOM device is designed the PCU, based on porous materials being able to host the precursors molecules. The PCU can make more selective the LPAS technique uptaking only target molecules and not the volatile organic compounds (VOCs) interfering agents, too, and can make more sensible LED-IF sensor by rising the concentration of detected molecules.
19
be made is reported in figure 1.2. All the parts of the device, control board, air sampling and detectors, are included in a mechanical cover. The control board is connected to an external PC to collect and visualize measurement results.
Figure 1.2 The block diagram of CUSTOM device components.
In figure 1.3, instead, is shown in more detail the block diagram of the air sampling system. An air flow is sucked by a pump from the surrounding environment and passes through the PCU. The air flow outgoing from the PCU is send to LED-IF (or FLUO) and LPAS sensors, whose response is analyzed by the control board, and then ejected to the external environment.
20
Figure 2.3 The block diagram of air sampling system.
The mechanical part of the PCU, shown in figure 1.4, is like a sort of box having some slots covered by Peltier elements to allow heating/cooling cycles, necessary to perform the sorption and desorption of the molecules in a short time. Inside these slots are placed aerogel beads of a porous polymer, the syndiotactic polystyrene (sPS), which is the concentrating material able to host the molecules in its crystalline phase and it is provided by our group. Within the CUSTOM project, our tasks are not only the production, characterization and supply of this polymer, but also the demonstration of its efficacy in concentrating target molecules and the validation of the PCU, as it will be implemented in the device, through measurements of
21
sorption and desorption of targeted precursors.
Figure 3.4 The mechanical part of the preconcentrator unit (PCU).
1.3 Concentrating porous materials
In the analytical field the use of preconcentrating materials is widely used to increase the concentration, or the amount, of trace components. Preconcentration also facilitates the sampling because allows the trace components to be isolated and determined, diminishing the sampling error and enhancing the sensitivity of an instrument7. The materials used for preconcentration of
different analytes such as metals, explosives, drugs, VOCs, proteins are really various like fullerenes8, organosilicas9,
metal-organic frameworks (MOFs)10, cavitands11,
poly(methyl methacrylate) matrix covered with cellulose12,
nanoscale carbon-based materials13 and generally other
22
In our case, we deal with a very interesting challenge because we have the task to supply a material that is very fast both in sorption and in desorption of the targeted molecules. The only way to achieve this goal is to produce a material with high surface area and which allows rapid diffusion of molecules within it.
In the set up phase of the CUSTOM project, a micro- and nanoporous polymeric material has been selected. The first nanoporous polymer, syndiotactic polystyrene (sPS), has been described by Guerra and co-workers14 ; moreover the
same research group has recently discovered another nanoporous polymer, the poly(2,6-dimethyl-1,4-phenylene)oxide generally known as PPO15. Anyway, within
the CUSTOM project, the selected preconcentrating material designed to concentrate targeted molecules is sPS. Its crystalline phase in the δ form, in fact, is nanoporous, that is it has very small pores with diameters of just few nanometers.
1.4 Nanoporous structures of syndiotactic
polystyrene
The sPS shows a very complex polymorphic behaviour that can be described in terms of two crystalline forms, α and β, whose chains are in trans-planar zigzag conformation and two forms, γ and δ, containing helical chains in s(2/1)2
23
conformation16. More recently, another crystalline form of
sPS, named ε, has been discovered17. The δ and ε forms
are the only showing nanoporous crystalline phases: the former presenting isolated cavities (whose volume is around 120 Å3)14 in the crystalline structure, the latter has
instead long channels, as shown in the representations of figures 1.518 and 1.619, respectively.
Figure 4.5 View of the host nanoporous crystalline δ form of sPS. Four adjacent unit cells along the c axis parallel to the (002) crystallographic
plane. Each crystalline cavity (gray region) is confined by ten host phenyl rings.
The molecular chains in the δ form are packed in a monoclinic unit cell with axes a = 17.4 Å, b = 11.85 Å, c = 7.70 Å, and γ = 117° according to the space group P21/a20. This form is also characterized by two identical
24
cavities and eight styrene monomeric units per unit cell, with a crystalline density of 0.977 g/cm3, lower than the
density of the corresponding amorphous phase (1.055 g/cm3)20.
Figure 5.6 View along the c axis of the nanoporous ε form of sPS. Grey circles indicate the channels passing through all the crystal. R =
right-handed, L = left-handed helical chains.
The unit cell proposed for the ε form, instead, is orthorhombic with axes a = 16.2 Å, b = 22.0 Å, c = 7.9 Å, and γ = 90°, belonging to the space group Pbcn19. Its
crystalline density is 0.98 g/cm3, similar to that one of the
δ phase21, with four chains of sPS in the s(2/1)2 helical
conformation included in the unit cell.
Moreover, the δ and ε forms of sPS show the great ability to include in their crystalline structure, in cavities or in
25
channels respectively, low molecular mass guest molecules, forming co-crystalline molecular complexes called clathrates22-23 and intercalates23-24. The sorption of
such guest molecules from water and air occurs rapidly and selectively, also when these molecules are present at very low concentration.
Thus, the two nanoporous crystalline forms of sPS act as host to trap (and so to concentrate) guest molecules of suitable size, shape and polarity.
1.5 Microporous forms of syndiotactic polystyrene
In literature many microporous materials have been described, such as the most studied silica aerogels25, and
they are defined as materials containing pores with diameters less than 2 nm. Extremely porous materials with microporous cavities are described as aerogels. Also the δ form of sPS can be achieved in this morphology. The first sPS δ form microporous aerogels and their preparation have been described by Guerra and co-workers26, and they
are defined also nanoporous because they include a high percentage of crystalline δ phase of sPS, which is nanoporous. The sPS nanoporous δ form aerogel is obtained by removal, through CO2 in supercritical
conditions, of the solvent molecules from the micropores of the starting gel. We deal with a physical gel, in which the
26
polymer chains are connected by intermolecular physical bonding, that form junction zones. These junctions are the polymer-rich (or clathrate) phase of the gel and consist of crystalline regions27. The corresponding sPS nanoporous δ
form aerogels derived from such physical gels present a fibrillar morphology, shown in figure 1.7.
Figure 1.7Scanning electron micrograph (SEM) of sPS δ form aerogel with fibrils of diameter between 50 and 100 nm.
In figure 1.8, instead, a schematic representation of the texture and of the crystalline structure of the sPS nanoporous δ form aerogel is reported28.
27
Figure 1.8 Schematic representation of the texture (left) and the crystalline structure (right) of the sPS δ form aerogels.
The sPS nanoporous δ form aerogels can be obtained in different porosity, depending on the concentration of the solvent used to prepare the starting gel1. Aerogels of sPS δ
form with higher porosity show faster sorption and desorption kinetics; this behaviour is also due to the high surface area (about 290 m2/g) typical for aerogels26,28. An
example of the behaviour above mentioned is shown in the figure 1.9, where sorption and desorption kinetics of 1,2-dichloroethane (DCE) from 100 ppm aqueous solution at room temperature are shown for sPS nanoporous δ form aerogels with different porosity1.
28
Figure 1.9 Sorption (left) and desorption (right) kinetics at room temperature of DCE from 100 ppm aqueous solutions for sPS nanoporous δ form aerogels with a porosity P = 98.5%(▲), P = 90%(■)
and P = 80%(+).
Moreover, these materials also present a great sorption capacity, typical of sPS δ form and it is due to the sorption of molecules as isolated guests in its host nanoporous crystalline phase. This behaviour is widely reported in literature and here we show, just as an example in figure 1.1028, the comparison in chloroform vapour sorption
among a sPS nanoporous δ form aerogel, a β form sPS aerogel and a sPS nanoporous δ form film. Clearly is pointed out not only the much higher sorption capacity possessed by sPS nanoporous δ form aerogel respect to that of other forms of sPS aerogel, such as the β form, but also the much faster sorption kinetics of the aerogel respect to other morphologies such as the film.
29
Figure 1.10 Chloroform vapor sorption kinetics obtained at Pchloroform =
667 Pa and T = 56 °C for the δ (●) and β (○) form aerogels and for the δ form film (+).
Another example about the great sorption capacity of the δ form of sPS and the faster sorption kinetics of the aerogel respect to other morphologies, is illustrated in figure 1.111,
where the comparison among aerogels of sPS δ form at different porosity, β form sPS aerogel, δ and γ form sPS powders are reported. Here, too, it is clear shown that the δ form of sPS is the one with the highest sorption capacity and that the aerogel morphology is the one showing the faster sorption kinetics.
30
Figure 1.11. Nitrogen sorption isotherms in the range 0–0.30 p/p0 of δ-aerogels (P = 91% and 98.5%), β-aerogel (P = 91%), δ-powder, and γ-powder at 77 K. The sorption is expressed as cm3 of nitrogen in normal
conditions (1 atm, 273 K) per gram of polymer.
Aerogels of sPS δ form can be achieved in different shapes, such as monoliths, membranes, beads. This last shape has been found, by the ENEA agency CUSTOM partner who takes care of air sampling and developed PCU, the right one to fill in the slots of the PCU. The reasons of this choice are both the low hydraulic impedance, that is the minimization of pressure loss and optimization of air flow rate during air sampling, shown by the beads in some previous tests performed by ENEA, and the high surface area exposed to the air flow containing the precursors. We
31
obtained these beads of sPS nanoporous δ form aerogel in a range of 100-1000 µm, as shown in figure 1.12.
Figure 1.12 sPS nanoporous δ form aerogel beads in the size range 100-1000 µm.
32
Chapter 2
Results and discussion
2.1 Aerogel beads of sPS in nanoporous δ form:
preparation and characterization
Studies carried out by ENEA unit of the CUSTOM consortium have shown that the bead morphology has low hydraulic impedance and good interaction surface, both desirable and suitable properties to make the PCU work in a correct and effective way. For this reason, the bead morphology has been chosen to test the behaviour of sPS towards the target drug precursors of the project.
It is well known that it is possible to obtain natural polymer aerogels in bead morphology 29-30, thus we developed a
specific procedure to obtain sPS nanoporous δ form aerogels with this morphology
The preparation procedure, described in the experimental part (chapter 3, paragraph 3.2), requires that a polymer solution, with an appropriate concentration, is transferred still warm into a fluid dispenser which allows to have regular dropping at controlled rate. The polymer solution then drips through a syringe in an organic solvent held at low temperature (-80°C). The organic solvent has been properly selected among the non-solvents for the polymer,
33
so that the formed polymer solution drops coagulate in it forming gels with bead shapes.
The solvent is removed from the gel beads of sPS nanoporous δ form by extraction with CO2 in supercritical
conditions and sPS nanoporous δ form aerogel beads are achieved.
Aerogel bead samples were characterized by Fourier transform infrared spectroscopy (FTIR; figure 2.1) and wide angle X-ray diffraction (WAXD; figure 2.2). In figure 2.1, the whole FTIR spectrum is reported, even if the typical fingerprint of the sPS ranges between 1600 and 500 cm-1.
Just in this spectral region, the conformation and packing sensitive peaks of the nanoporous sPS δ form are present, located at 969, 944, 934, 548, 535, 503 cm-1.31
Moreover, the absence of chloroform bands (e.g the typically strong band at 1214 cm-1) confirm that all the
solvent of the gel has been surely removed from the polymer.
34 3500 3000 2500 2000 1500 1000 500 A b s o rb a n c e ( a .u .) Wavenumber (cm-1)
Figure 2.1. FTIR spectrum of sPS nanoporous δ form aerogel in bead morphology.
In the WAXD spectrum (figure 2.2) the typical pattern of the crystalline sPS nanoporous δ form28, with the characteristic
35 10 15 20 25 30 35 40 In te n s it y ( a .u .) 2(degrees) 8.2 13.6 16.7 20.7 23.5
Figure 2.2. WAXD spectrum of sPS nanoporous δ form aerogel in bead morphology.
From X-ray diffraction and FTIR spectra, the degree of crystallinity of the sPS nanoporous δ form aerogel samples has also been evaluated and it resulted to be around 45% for all the samples obtained through the preparation procedure previously described.
The aerogel beads porosity has been also evaluated, for the different batches of beads produced, by using the procedure described by Daniel et al.1 and reported in the
experimental part (chapter 3, paragraph 3.4). Thus, a porosity in the range 87-91%, was evaluated for all the aerogel bead samples.
36
2.2 Drug precursors analyzed
As reported in chapter 1 paragraph 1.2, the CUSTOM project selected five drug precursors; among these ones we focused our attention on four of them, to test the CUSTOM prototype device: benzyl methyl ketone (BMK), ephedrine (Eph), safrole and acetic anhydride (AcAn), that are the most important, essential, the less replaceable and also the most trafficked and seized drug precursors used for illicit purposes.
Anyway, these precursors have also licit uses, for example BMK is used in the chemical industry for the synthesis of propylhexedrine (a vasoconstrictor used mainly to treat symptoms of nasal congestion due to colds, allergies and allergic rhinitis), and in the pharmaceutical industries for the production of methamphetamine and derivatives in medical applications. Eph is used as stimulant, appetite suppressant, concentration aid, decongestant, and to treat hypotension associated with anaesthesia. Safrole is used in perfumery, in the manufacture of piperonal (a molecule structurally related to benzaldehyde and vanillin, having a floral odour similar to that of vanillin and cherry), and to denature fats in soap manufacture. AcAn, instead, is used in chemical and pharmaceutical industries for manufacture of cellulose acetate, textile sizing agents and cold bleaching activators, polishing of metals, production of
37
brake fluids, dyes and explosives. The structures of the four precursors, whose transport properties within sPS nanoporous δ form aerogel were studied, are depicted in figure 2.3, together with the relative achievable psychotropic substances and the chemical reactions needed to obtain them.
For the CUSTOM project aims it is necessary to reveal such precursors when they are present in very low concentrations, but to identify the most relevant peaks in the FTIR and WAXD spectra as well as changes in thermogravimetric analysis (TGA) and mass spectrometer (MS) measurements, due to the behaviour and the influence of this precursors on the absorbing polymer, we started to perform tests at higher concentrations of this molecules.
38
Figure 2.3 Drug precursors used to test the CUSTOM prototype device and relative psychotropic substances.
2.3 Benzyl methyl ketone (BMK)
In order to have a fast reply about the absorbing capacity of the polymer towards BMK and to easily identify the most intense FTIR and WAXD signals of BMK, a simple preliminary test was conducted exposing a sample of sPS nanoporous δ form aerogel to BMK vapours for 2 hours, at a temperature of about 40°C (temperature ensuring a relatively high BMK vapours pressure, which is 0.16 mm Hg at 25°C). The concentration in gas phase of BMK was evaluated to be around 840 ppm and the uptake of BMK in
39
the polymer, valued by TGA, was around 30% by weight, corresponding to a concentration factor (ratio between the concentration of the guest in the polymer and in the air) in the polymer of about 350. The nanoporous δ sPS aerogel sample after the BMK sorption was characterized by FTIR and WAXD and the results are reported in figures 2.4 and 2.5, respectively.
In figure 2.4 the FTIR spectrum of sPS aerogel sample after exposure to BMK vapours, and the same sample before the exposure, are compared. In the same figure, to make easier the comparison between the spectra, also the FTIR spectrum of the pure BMK is reported.
40 1800 1700 1600 1500 1400 1300 1200 1100 1000 900 800 700 600 500 1355 1155 478 1229 A b s o rb a n c e ( a .u .) Wavenumber (cm-1) 1715
Figure 2.4 FTIR spectra of sPS nanoporous δ form aerogel (bottom), BMK absorbed in sPS nanoporous δ form aerogel (thick line) and pure
BMK (top).
In the FTIR spectrum of the sPS nanoporous δ form aerogel sample exposed to BMK vapours, all the typical most intense infrared bands of BMK, e.g. those at 1715, 1355, 1229, 1155 and 478 cm-1 labelled in figure, are present.
The the infrared bands at 1715 and 1355 cm-1 are in
saturation condition, i.e. the intensity of these bands fall out from the range of linear response given by the law of Lambert-Beer. It is worth noting that the infrared absorbance region showed in figure corresponds to the wavenumbers range in which the main absorbance bands of the polymer and BMK are present.
41
In the figure 2.5, the WAXD spectra of a sPS nanoporous δ form aerogel sample exposed to BMK vapours (top) and of the same sample before the exposure (bottom), are reported. 6 8 10 12 14 16 18 20 22 24 26 28 30 32 34 36 38 40 7.6 sPS form + BMK 13.6 10.2 In te n s it y ( a .u .) 2degrees 8.2 sPS form
Figure 2.5 WAXD spectra of sPS nanoporous δ form aerogel (bottom) and of sPS nanoporous δ form aerogel exposed to BMK vapours (top).
They are worth noting the differences in some reflections between the two diffraction spectra of fig.2.5. The enhancement of the reflection intensity at 2θ = 10.2° and the depression of those at 2θ = 8.2 (also shifted to 7.6°) and 13.6°, observed in the sample exposed to BMK vapours (top curve in figure), mean that some changes in the polymer crystalline structure, due to the sorption of
42
BMK, occurred. This WAXD pattern is characteristic of a sPS co-crystalline structure 20, in which guest molecules
are included in the crystalline cavities of the nanoporous δ sPS (host). The shift of the reflection from 2θ = 8.2° to values < 8°is typical of a sPS clathrate structure. The presence of a guest molecule enlarges the unit cell (mostly the b axis) so that, also molecules that are definitely larger than the cavity of the sPS δ form, make stable clathrates14.
In this case, the estimated amount of the cavities of the crystal lattice of sPS δ form filled by BMK molecules resulted to be around 90%.
In order to verify the effectiveness of BMK sorption in sPS nanoporous δ form aerogel samples also when BMK is present in low concentrations (the typical working conditions supposed for the CUSTOM designed device), a series of sorption experiments from aqueous solution at different BMK concentration (1, 10, 50, 100, 250 and 500 ppm) have been performed. A more detailed description of these experiments is reported in the experimental part (chapter 3, paragraph 3.5).
FTIR and WAXD measurements of sPS nanoporous δ form aerogel samples exposed to BMK aqueous solutions are shown in the figures 2.6 and 2.7, respectively.
In figure 2.6, the FTIR spectra in the regions 1100-1300 cm-1 and 1600-1800 cm-1 of all the sPS nanoporous δ form
43
aerogel samples exposed to BMK aqueous solutions, are reported. It is worth nothing that the considered spectral regions are those in which the most intense infrared bands of BMK (1715, 1229 cm-1), not overlapping to sPS
absorbance bands, are present.
1800 1750 1700 1650 1600 1250 1200 1150 1100 1229 A b s o rb a n c e ( a .u .) Wavenumber (cm-1) 1715
Figure 2.6 FTIR spectra of sPS nanoporous δ form (bottom), pure BMK (top) and sPS nanoporous δ form samples exposed to BMK 1, 10, 50,
100, 250 and 500 ppm aqueous solutions.
The percent of guest uptake in each sPS aerogel sample immersed in a BMK aqueous solution is reported in Table 2.1. These percentages have been evaluated through two calibration lines, one for the highest concentrations and the other for the lower ones, built as described in chapter
44
3, paragraph 3.6, that correlates the intensity of the BMK absorbance bands in FTIR with the results of TGA measurements.
Table 2.1. BMK uptake in nanoporous δ sPS aerogel samples immersed in BMK aqueous solutions.
BMK aqueous solution BMK uptake
1 ppm 0.9 % 10 ppm 0.8 % 50 ppm 0.9 % 100 ppm 1 % 250 ppm 5 % 500 ppm 10 %
In figure 2.7, the WAXD spectra of the sPS nanoporous δ form aerogel samples immersed in BMK aqueous solutions at different concentrations, are shown.
45 6 8 10 12 14 16 18 20 22 24 26 28 30 32 34 36 38 40 0.8 % BMK 0.9 % BMK 1 % BMK 10% BMK In te n s it y ( a .u .) 2 (degrees) 5 %BMK sPS form
Figure 2.7 WAXD spectra of sPS nanoporous δ form aerogel (bottom) and of sPS nanoporous δ form aerogel samples immersed in BMK aqueous solutions at different concentrations. The BMK uptake is also
reported.
It is clear that as the BMK content in the samples increases, the intensity of the reflection at 2θ = 10.2° is enhanced as well as the intensity of the reflections at 2θ = 8.2°and at 2θ = 13.6° is reduced. In particular, when the BMK uptake is 10% (test performed in 500 ppm aqueous solution) the WAXD pattern is characteristic of a sPS co-crystalline structure 20, in which guest molecules are
included in the crystalline cavities of the sPS nanoporous δ phase. For this sample, the calculated amount of the
46
cavities of the crystal lattice of sPS nanoporous δ form filled by BMK molecules resulted to be about 35%.
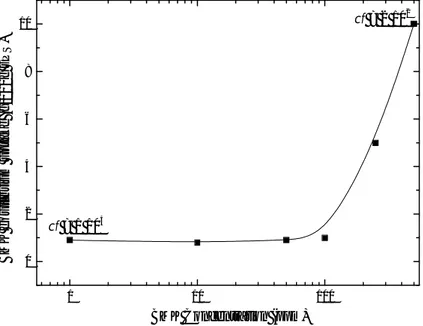
The BMK equilibrium uptake values vs the BMK aqueous solution concentrations are reported in figure 2.8. The BMK equilibrium uptake values has been valued by FTIR measurements, as reported in experimental section chapter 3 paragraph 3.6, considering the BMK absorbance bands at 1715 and 1229 cm-1. 1 10 100 0 2 4 6 8 10 cf = 1 104 B M K e q u ili b ri u m u p ta k e ( g /1 0 0 g s P S ) BMK Concentration (ppm) cf = 2 102
Figure 2.8 BMK equilibrium uptake vs BMK concentration in aqueous solution; cf of 1 and 500 ppm BMK aqueous solutions are also shown.
For two points, corresponding to 1 and 500 ppm BMK concentration, of the sorption curve in figure 2.8 the concentration factor (cf), that is the ratio between the
47
concentration of the guest in the polymer and in aqueous solution, is also reported.
It is worth noting that the cf in the polymer increases as the BMK concentration in the aqueous solution decreases, passing from 2·102 when the concentration of BMK
solution is 500 ppm, up to 1·104 when the concentration of
BMK solution is 1 ppm32.
These data indicate that the sPS in nanoporous δ form is highly effective in concentrating the drug precursor molecules when presents at very low concentration in the environment.
These data are in well agreement with the polymer behaviour described by Daniel et al. 1,33 with other
molecules, such as 1,2-dichloroethane (DCE). An example of this similar behaviour is shown in figure 2.9, where DCE equilibrium uptake is reported versus DCE concentration in aqueous solution 1.
48 1 10 100 1000 0 2 4 6 8 10 12 cf = 5 104 DCE e q u ili b ri u m u p ta k e ( g / 1 0 0 g s P S )
DCE concentration in aqueous solution (ppm)
Figure 2.9 DCE equilibrium uptake vs. DCE concentration in aqueous solution; cf of 1 ppm DCE aqueous solution is also shown. Data from
ref. 1.
As you can see, the trend of the values of the equilibrium uptake curve and the effectiveness in DCE sorption are very similar to those ones shown for the BMK (compare the cf reported in figure 2.9 with that one reported in figure 2.8), showing that this behaviour is characteristic of the semicrystalline δ form of sPS. Apparently, the nanocavities in the crystalline phase of δ sPS are capable to trap and concentrate the guest molecules in a very effective way when they are in very low concentrations.
49
2.4 Ephedrine
In order to verify the sorption capacity of the sPS nanoporous δ form aerogel towards ephedrine (Eph), preliminary tests were conducted by exposing a polymer sample to Eph vapours for about 2 hours at 40°C (increasing Eph vapour pressure, that is 0.009 mmHg at 25°C). The FTIR spectroscopy measurements on this polymer sample have shown that sPS nanoporous δ form aerogel is not able to absorb this precursor. Further Eph sorption tests were conducted immersing polymer aerogel samples in Eph aqueous solutions at different concentrations, but the sorption of this precursor did not occur neither in these cases.
We tried to dissolve Eph in solvents, like acetone, chloroform, ethanol, acting as a carrier for this precursor into the polymer, but it was not absorbed.
We initially attributed these behaviours to a lack of affinity between Eph and the sPS nanoporous δ form aerogel, being the former a polar molecule and the second a non-polar polymer. Then, it is very likely that Eph is not soluble in the polymer.
We thought to make partially polar the polymer by selectively functionalizing only its amorphous phase with sulfonic groups34, which could potentially be able to absorb
50
sPS nanoporous δ form aerogel was able to absorb Eph, neither from its vapours nor from aqueous solutions at different concentrations.
Probably, Eph tends to be associated perhaps in the form of dimer, so its dimensions are too big for the cavities of the nanoporous sPS δ form. However, also in the nanoporous sPS ε form this precursor is not absorbed.
2.5 Safrole
As previously shown for the BMK, to quickly know which is the sorption capacity of the polymer towards safrole and what are the characteristic signals of safrole for an easy identification, we performed a preliminary test by simply exposing a sPS nanoporous δ form aerogel sample to safrole vapours for 30 minutes, at a temperature of about 40°C (to increase safrole vapour pressure, that is 0.07 mmHg at 25 C). The safrole concentration in the vapour phase was around 470 ppm and the uptake of safrole in the polymer was 20%, as arose from TGA measurements. Moreover, the valued amount of the cavities of the crystal lattice of sPS nanoporous δ form filled by safrole molecules in this sample is around 50%.
The sPS nanoporous δ form aerogel sample after the safrole sorption was characterized by FTIR and WAXD measurements, whose spectra are reported in figure 2.10
51 and 2.11, respectively.
In figure 2.10, the FTIR spectra of the polymer sample after exposure to safrole vapours and before the exposure are compared. Moreover, for an easier comparison between the spectra, the FTIR spectrum of the pure safrole is shown. 1600 1500 1400 1300 1200 1100 800 700 600 500 400 1285 670 588 597 440 421 808 855 1094 1123 1184 1246 1641 A b s o rb a n c e ( a .u .) Wavenumber (cm-1)
Figure 2.10 FTIR spectra of sPS nanoporous δ form aerogel (bottom), safrole absorbed in sPS nanoporous δ form aerogel (thick line) and
pure safrole (top).
In the FTIR spectrum of the polymer sample exposed to safrole vapours, the characteristic most intense infrared bands of safrole at 1641, 1285, 1246, 1184, 1123, 1094, 855, 808, 670, 597, 588, 440 and 421 cm-1 labelled in
52
figure, are present. The infrared band at 1246 cm-1 is in
saturation condition, i.e. it does not fall in the range of linear response of the Lambert-Beer law, while some bands are labelled with arrows for clarity. The infrared absorbance region reported in figure is that in which the main absorbance bands of sPS and safrole are evident. In figure 2.11, the WAXD spectra of the nanoporous δ sPS aerogel sample exposed to safrole vapours (top) and of the same sample before exposure (bottom) are reported.
6 8 10 12 14 16 18 20 22 24 26 28 30 32 34 36 38 40 7.8 13.6 10.2 8.2 sPS form + safrole In te n s it y ( a .u .) 2 (degrees) sPS form
Figure 2.11 WAXD spectra of sPS nanoporous δ form aerogel (bottom) and of sPS nanoporous δ form aerogel exposed to safrole vapours
(top).
53
vapours (top curve in figure 2.11) is typical of a sPS co-crystalline structure20, in which safrole forms a host/guest
complex with the sPS nanoporous δ form. Comparing the WAXD spectrum of the polymer exposed to safrole vapours (top curve figure 2.11) with that one of polymer exposed to BMK vapours (top curve figure 2.5), you can see that the intensity of the peak at 2 = 7.8° is much lower in the former case than in the latter. This datum can be explained considering the bigger size and weight of safrole with respect to BMK.
Likewise to what done for the BMK, we performed some experiments from aqueous solutions at different safrole concentrations (1, 10, 25 and 50 ppm). A detailed procedure of the performed tests is reported in the experimental part (chapter 3, paragraph 3.5).
The FTIR and WAXD measurements of all sPS nanoporous δ form aerogel samples immersed in safrole aqueous solutions are shown in figures 2.12 and 2.13, respectively. In figure 2.12, only the ranges between 1670-1580 cm-1
and 880-400 cm-1 are shown, because the most intense
infrared absorbance bands of safrole at 1641, 855, 808, 670, 597, 588, 440 and 421 cm-1 labelled in figure, which
do not overlap with those ones of sPS, are present. It is noteworthy that the infrared bands at 1641, 808 and 588 cm-1 do not follow the linearity of the law of Lambert-Beer,
54
so they are in saturation condition, and that some bands are marked with arrows for clarity.
1650 1600 800 700 600 500 400 421 440 588 597 670 808 855 A b s o rb a n c e ( a .u .) Wavenumber (cm-1) 1640
Figure 2.12 FTIR spectra of sPS nanoporous δ form aerogel(bottom), pure safrole (top) and sPS nanoporous δ form samples exposed to
safrole 1, 10, 25 and 50 ppm aqueous solutions.
In Table 2.2, the amount of safrole uptake in the sPS aerogel samples immersed in the safrole aqueous solutions is reported. These values have been calculated through a calibration line, described in chapter 3, paragraph 3.6, in which the intensity of the safrole absorbance bands in FTIR and TGA data are correlated.
55
Table 2.2. Safrole uptake in sPS nanoporous δ form aerogel samples immersed in safrole aqueous solutions.
Safrole aqueous solution Safrole uptake
1 ppm 5 %
10 ppm 15 %
25 ppm 24 %
50 ppm 33 %
The WAXD spectra of the sPS nanoporous δ form aerogel samples immersed in safrole aqueous solutions at various concentrations are reported in figure 2.13. It is evident the enhancement of the intensity of the reflections at 2θ = 10.2°, while the intensity of the reflections at 2θ = 8.2 (shifted to 7.8°) and 13.6° is reduced, as the safrole amount in the sPS samples increases. All the X-ray diffraction patterns shown are typical of a co-crystalline structure between the host polymer and the guest molecule20. For the sample whose safrole uptake is 33%
(corresponding to the test performed with 50 ppm aqueous solution), the cavities of the crystal lattice of sPS nanoporous δ form filled by guest molecules resulted to be around 80%.
56 6 8 10 12 14 16 18 20 22 24 26 28 30 32 34 36 38 40 33% safrole 24% safrole 15% safrole 5% safrole In te n s it y ( a .u .) 2 (degrees) sPS form
Figure 2.13 WAXD spectra of sPS nanoporous δ form aerogel (bottom) and of sPS nanoporous δ form aerogel samples immersed in safrole aqueous solutions at different concentrations. The safrole uptake is
also reported for each spectrum.
The safrole equilibrium uptake values vs safrole aqueous solutions concentrations are reported in figure 2.14. The data of the figure have been evaluated by FTIR measurements, as reported in the experimental part (chapter 3, paragraph 3.6), on the basis of the safrole infrared absorbance band at 1640 cm-1.
57 0,1 1 10 0 5 10 15 20 25 30 35 cf = 6 103 S a fr o le e q u ili b ri u m u p ta k e ( g / 1 0 0 g s P S )
Safrole concentration in aqueous solution (ppm)
cf = 5 104
Figure 2.14 Safrole equilibrium uptake vs. safrole concentration in aqueous solution; cf of 1 and 50 ppm safrole aqueous solutions are
also shown.
For the lowest and the highest value on the sorption curve of figure 2.14, corresponding to 1 and 50 ppm safrole aqueous solution concentration, respectively, the cf is reported. It is remarkable the enhancement of cf moving from a higher concentration to a lower one. In fact, the cf passes from 6·103 at safrole concentration in solution of
50 ppm, to 5·104 when safrole concentration in solution is
1 ppm32. These data show that the sPS nanoporous δ form
aerogel is highly effective to concentrate safrole too, even if it is present in low concentrations.
58
Also in the case of safrole, as already seen for BMK; the data and the trend of the sorption equilibrium uptake curve are in good agreement with the behaviour of sPS described by Daniel and co-workers1,33.
2.6 Acetic Anhydride (AcAn)
The last precursor tested for the aims of the CUSTOM project is the acetic anhydride (AcAn). As in the previous cases, a sample of sPS nanoporous δ form aerogel has been exposed to AcAn vapours, for 2 minutes at about 25°C since AcAn is quite volatile (its vapour pressure at 20°C is 4 mmHg and the concentration of AcAn in air was about 16000 ppm), in order to verify the sorption capacity of sPS towards AcAn and to identify the main signals of this precursor. By TGA we were able to evaluate the uptake of AcAn within the polymer, that is around 4%, corresponding to the 17% of filled cavities in the crystal lattice of sPS nanoporous δ form by AcAn molecules. On the nanoporous δ sPS sample exposed to AcAn vapours, FTIR and WAXD measurements have been performed, as shown in figure 2.15 and 2.16 respectively.
In figure 2.15, the FTIR spectra of the polymer after AcAn exposure and before this exposure are reported for comparison. Moreover, the FTIR spectrum of pure AcAn is shown for clarity. In the infrared absorbance spectrum of
59
the sPS aerogel sample exposed to AcAn vapours, all the typical most intense absorbance bands of AcAn, i.e. those at 1829, 1756, 1367, 1226, 1128 and 996 cm-1 also
labelled in figure, are present.
2000 1800 1600 1400 1200 1000 800 996 1128 1226 1367 1756 A b s o rb a n c e ( a .u .) Wavenumber (cm-1) 1829
Figure 2.15 FTIR spectra of sPS nanoporous δ form aerogel (thin line, bottom), AcAn absorbed in sPS nanoporous δ form aerogel (thick line)
and pure AcAn (thin line, top).
Moreover, the WAXD spectra of figure 2.16 confirm that the sorption of AcAn also occurs in the crystalline phase of the polymer, as illustrated by the typical co-crystalline structure pattern of the sPS nanoporous δ form aerogel exposed to AcAn vapours (top)20.
60 6 8 10 12 14 16 18 20 22 24 26 28 30 32 34 36 38 40 sPS form + AcAn In te n s it y ( a .u .) 2(degrees) 10.2 8.2 13.6 sPS form
Figure 2.16WAXD spectra of sPS nanoporous δ form aerogel (bottom) and of sPS nanoporous δ form aerogel exposed to AcAn vapours (top).
Unlike the previous precursors studied, BMK and safrole, AcAn hydrolyzes in water forming acetic acid. For this reason, it was not possible to prepare aqueous solutions of AcAn to control its concentration. Anyway, to test the effectiveness of sPS nanoporous δ form aerogel in concentrating AcAn at low concentrations, we performed some experiments in gas phase with a proper homemade apparatus35, which is able to produce an air flow
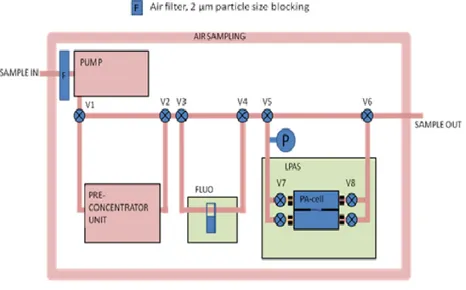
containing one or more analytes in low concentrations. The apparatus used is shown in figure 2.17 and it included also the PCU, whose tasks were to accommodate the
61
beads of polymer in its slots and to control temperature, thanks to Peltier elements, and air flow.
Figure 2.17. Apparatus to produce air flow containing analytes: (1) mass flow controllers; (2) mass flow controllers control unit; (3) analyte saturator; (4) manometer; (5) preconcentrator; (6) mass
spectrometer.
In the apparatus shown above, the air flow containing a well defined amount of AcAn, which is regulated by mass flow controllers (MFC) and MFC control unit, passes through the PCU and then is send to the mass spectrometer (MS) detector. A simplified scheme of the profiles of sorption and desorption processes is shown in figure 2.18.
62
Figure 2.18. Scheme of the sorption (left) and desorption (right) processes.
On the left of figure 2.18, the profile of sorption process at a certain concentration of AcAn is depicted. At the beginning of the measurement, the air flow containing a mixture of air and AcAn does not pass through the PCU and it is detected by MS, which gives a constant signal intensity (A). As soon as the air flow passes through PCU, the sorption process occurs (B) and continues until the signal intensity reaches the starting level again (C). During the sorption, that is an exothermic process, the Peltier elements of the PCU are held at low temperature.
After the complete sorption of AcAn by the polymer, the temperature is increased up to 50°C to allow the desorption (that is an endothermic process) of the precursor. For the desorption process the intensity of the MS signal is dropped to zero (D). When desorption occurs (E),the intensity of the MS signal increases of several times with respect to the starting level. When all the AcAn has
63
been desorbed, the intensity of the MS signal returns to zero (F).
Hence, with the system above described, we were able not only to test the effectiveness of the polymer in the AcAn sorption at low concentrations, but also to validate the PCU working conditions.
The mass flow of AcAn to be set to the MFC control unit, considering a mixture made of air and AcAn, is calculated starting from Raoult’s law, as reported in the experimental part (chapter 3, paragraph 3.7).
The working conditions used to perform the tests on sorption/desorption of AcAn were the following:
temperature of PCU during sorption: 15°C temperature of PCU during desorption: 50°C air flow used in the sorption tests: 128 NL/h air flow used in the desorption tests: 60 NL/h
The AcAn concentrations tested for the sorption and desorption of this guest in beads of sPS nanoporous δ form aerogel were 5, 10, 20, 40 and 100 ppm36.
In figure 2.19 is reported an example of the MS detector response in a sorption/desorption cycle of AcAn in the beads of nanoporous δ sPS aerogel. In this figure, the initial concentration of AcAn is 5 ppm. It is worth noting that the intensity of the signal given by MS detector is
64
proportional to AcAn concentration, according to the calibration line described in the experimental part (chapter 3, paragraph 3.6).
Figure 2.19. Example of the sorption/desorption cycle of AcAn in beads of sPS nanoporous δ form aerogel. AcAn concentration in air flow: 5
ppm.
On the top of the figure, for major clarity, the sorption and desorption schemes are also reported. The sorption begins at t=7.2 min and lasts until t=41.5 min. After that the temperature of PCU is increased from 15 to 50°C and the desorption begins (t=51.3 min), giving rise to the high peak
65
containing 67 ppm of AcAn, so the precursor has been concentrated of about 13 times with respect to its initial 5 ppm concentration.
As already done for BMK and safrole, the curve of absorbed AcAn equilibrium uptake at different concentrations is reported in figure 2.20. The values of the curve were obtained by integration of AcAn concentration profiles during the sorption phase.
1 10 100 0,0 0,1 0,2 0,3 0,4 0,5 cf = 1 102 A c A n e q u ili b ri u m u p ta k e ( g / 1 0 0 g s P S )
AcAn concentration in air flow (ppm)
cf = 2 102
Figure 2.20 AcAn equilibrium uptake vs. AcAn concentration in air flow;
cf of AcAn in air flow at 5 and 40 ppm are also shown.
On the sorption curve of figure 2.20 there are also shown the cf for the AcAn concentrations in air flow at 5 and 40 ppm, that are 2·102 and 1·102 respectively32. Once again,
66
at the lowest initial concentration of the precursor corresponds the highest cf within the polymer.
The experimental apparatus allowed us to gain also information about the kinetics of AcAn sorption and desorption, as shown in the following figures. In figure 2.21 the amount of AcAn absorbed by the polymer in the PCU vs sorption time is reported, and for each curve the AcAn concentration in the inlet air has been indicated. It is already clear from this figure that, in about 16 minutes, the beads of sPS nanoporous δ form aerogel are saturated by AcAn flow, whatever the AcAn concentration in the inlet air is. 0 2 4 6 8 10 12 14 16 18 20 22 24 26 0,0 0,1 0,2 0,3 0,4 0,5 0,6 100ppm 40ppm 20ppm 10ppm A c A n u p ta k e ( g / 1 0 0 g s P S ) Time (min) 5ppm
Figure 2.21 Amount of AcAn absorbed by the polymer vs the sorption time. For each curve the initial AcAn concentration has indicated.
67
In figures 2.22 and 2.23 the sorption and desorption kinetic curves are respectively depicted. These kinetic curves are in normalized form, i.e. Mt/M∞ vs time1/2 . The
subscripts t and ∞ refer to mass (M) of AcAn evaluated at time t and at sorption equilibrium (∞).
In figure 2.23, the kinetic curve of the desorption at concentration 100 ppm is not reported, because this process was performed at 15°C while the desorption at the other concentrations was conducted at 50°C. So, the desorption at 100 ppm is not comparable with desorption occurred for other concentrations. Anyway, the desorption kinetic curve of AcAn at concentration 100 ppm is reported in figure 2.24, together with the relative sorption curve.
68 0 1 2 3 4 0,0 0,2 0,4 0,6 0,8 1,0 5ppm 10ppm 20ppm 40ppm 100ppm M (t ) / M ( )
Sorption time1/2 (min1/2)
Figure 2.22 Sorption kinetic curves of different AcAn concentrations.
0 1 2 3 4 0,0 0,2 0,4 0,6 0,8 1,0 M (t ) / M ( ) 5ppm 10ppm 20ppm 40ppm
Desorption time1/2 (min1/2)