UNIVERSIT `A DEGLI STUDI DI CATANIA
FACOLTA DI SCIENZE MATEMATICHE` , FISICHE E NATURALI DOTTORATO DI RICERCA IN FISICA
CLAUDIA AGLIOZZO
LUMINOUS BLUE VARIABLE STARS:
EXPLORING THE MASS-LOSS HISTORY
THROUGH A MULTIWAVELENGTH ANALYSIS
OF THEIR EJECTA
PH.D. THESIS Supervisor: Prof. F. Leone Tutor: Doct. G. Umana Doct. C. Trigilio Coordinator: Prof. F. Riggi XXV CICLO (2009-2012)Contents
Introduction 1
1 Luminous Blue Variable stars 5
1.1 Evolutionary track on the H-R diagram . . . 6
1.2 Observed properties . . . 8
1.2.1 Luminosities and Temperatures . . . 8
1.2.2 Photometric and Spectroscopic variability . . . 10
1.2.3 Abundances . . . 10
1.2.4 Membership and recent census of LBVs . . . 12
1.3 Proposed mass-loss mechanisms . . . 12
1.4 LBV Nebulae . . . 17
1.4.1 The dust . . . 20
1.4.2 The gas . . . 22
1.5 Motivations of this thesis . . . 23
I
A galactic template: the candidate LBV G79.29+0.46
25
2 EVLA and GBT observations of the nebula around G79.29+0.46 28 2.1 Introduction . . . 292.2 Observations and Data Reduction . . . 30
2.2.1 EVLA observations . . . 31
2.2.2 GBT observations and data processing . . . 34
2.2.3 Archival VLA data . . . 38
2.2.4 Spitzerdata . . . 39
2.3 The radio maps . . . 41
2.3.1 EVLA maps . . . 41
2.3.2 GBT maps . . . 43
2.3.3 Final GBT&EVLA maps . . . 43
2.4 Analysis of the radio continuum . . . 44
2.4.1 Spectral index . . . 44
2.4.2 EM and ionized mass . . . 45
2.4.3 Current-day mass-loss and spectral type of the star . . . 47
2.5 Ionized component versus dust components . . . 49
2.5.1 Determination of the nebula kinematical age . . . 51
2.6 Discussion . . . 51
3 Multiwavelength analysis of the nebula around G79.29+0.46 54 3.1 Introduction . . . 54
3.2 The datasets . . . 55
3.2.1 Herschelimages . . . 57
3.2.2 MSXimages . . . 58
3.2.3 ISOPHOT and ISOCAM images . . . 58
3.2.4 ISOLWS and SWS spectra . . . 58
3.2.5 SpitzerIRS spectra and IRAC and MIPS images . . . 59
3.3 Analysis of the mid-IR spectra . . . 60
3.3.1 Correction for extinction . . . 60
3.3.2 Detected lines and shock-versus-PDR diagnostics . . . 67
3.3.3 Electron density from mid-IR line ratios . . . 68
3.4 Herschelimages of G79.29+0.46 . . . 71
3.5 Analysis of the infrared images . . . 73
3.5.1 Temperature and mass of the dust . . . 73
3.5.2 Total mass and gas-to-dust ratio . . . 77
3.6 Spectral Energy Distribution . . . 78
3.7 Discussion/Conclusions . . . 79
II
LBVs in the Large Magellanic Cloud
81
4 Radio detection of nebulae around four LBV stars in the LMC 84 4.1 Introduction . . . 844.2 Observations and data reduction . . . 86
4.2.1 ATCA observations . . . 86
4.3 Morphology of the radio nebulae . . . 89
4.4 Data Analysis . . . 90
4.4.1 Intrinsic extinction and spectral index . . . 90
4.4.2 Mass of the ionized nebula . . . 93
4.5 Discussion/Conclusions . . . 94
5 High-resolution imaging and analysis of LBVNe in the LMC 97 5.1 Introduction . . . 97
5.2 ATCA observations and data reduction . . . 98
5.3 Radio maps and morphology of the nebulae . . . 100
5.4 Analysis of the radio emission . . . 103
5.4.1 Spectral index analysis . . . 103
5.4.2 The nature of the inner object in R127 . . . 105
5.4.3 Nebula mass versus ˙M . . . 107
5.4.4 Spectral type of the stars . . . 109
5.5 Extinction maps: evidence of dust? . . . 110
5.6 Discussion/Conclusions . . . 112
5.7 Outlook . . . 114
5.7.1 Modelling the dust nebula in R127 . . . 114
5.7.2 Simulation of ALMA observations . . . 115
Discussion and Conclusions 118
List of Tables
2.1 EVLA observational summary. . . 31
2.2 GBT observational summary. . . 31
2.3 Properties of the radio maps. . . 33
3.1 Archival data summary. . . 56
3.2 Summary of photometers properties. . . 57
3.3 SWS line fluxes. . . 61
3.4 Derived line fluxes from LWS spectra, obtained at six different position of the slit on the nebula. . . 64
3.5 Line fluxes derived from the IRS/CH3 spectrum, after the background subtraction. . . 65
3.6 Line fluxes derived from the IRS/CH0 spectrum, after the background subtraction. . . 65
3.7 Line fluxes derived from the IRS/CH1 spectrum, after the background subtraction. . . 66
3.8 Line ratios and electron densities. . . 70
3.9 Photometric observations and flux densities. . . 74
3.10 Assumed chemical composition, grain size and absorption coefficient; de-rived optical depth, temperature and mass of the dust. . . 77
4.1 ATCA observational summary. . . 86
4.2 Observed flux densities at 5.5 and 9 GHz, angular sizes at 9 GHz. . . 89
4.3 Electron density, electron temperature, effective temperature available in the literature. . . 91
4.4 Hα line integrated flux, expected free-free flux density at 5.5 and at 9 GHz. 91 4.5 Spectral index, emission measure, linear size, geometrical depth, source solid angle, average electron density, ionized mass. . . 93
5.1 ATCA observational summary. . . 98 5.2 Properties of the radio maps. . . 100 5.3 Observed flux densities and angular sizes at 17 GHz. Spectral index
be-tween measurementsaat 5.5, 9 and 17 GHz. . . 103
5.4 Terminal wind velocity, mass-loss rate, UV flux, spectral type. . . 108 5.5 Size, expansion velocity, kinematical age. . . 108
Introduction
Massive stars play a fundamental role in the evolution of galaxies. They are major contrib-utors to interstellar UV radiationand, via their strong stellar winds, provide enrichment of processed material(gas and dust) and mechanical energy to the interstellar medium. Despite their importance, the details of post-Main Sequence (MS) evolution of massive stars are still poorly understood. Recent evolutionary models suggest that Luminous Blue Variable (LBV) stars and related transition objects may play a key role in massive star evolution, representing a crucial phase during which a star loses most of its H envelope (Lamers & Nugis 2002).
LBV stars are intrinsically bright objects, exhibiting different kinds of photometric and spectroscopic variabilities. They are massive post-MS stars, characterized by intense mass-loss rates, which can also occur in the form of eruptive events. As a result, they are often surrounded by extended, dusty circumstellar nebulae. Although eruptive events have been witnessed very rarely (i.e.,η Carinae and P Cygni) the presence of these nebulae in most of the known objects suggests that these are a common aspect of the LBV behaviour (Weis 2008). There are, however, many aspects of the LBV phenomenon that are not completely understood. Among these are the total mass lost during the LBV phase (a key parameter necessary to test evolutionary models), the origin and shaping of the LBV neb-ulae (LBVNe), and how the mass-loss behaviour (single versus multiple events, bursts) is related to the physical parameters of the central object.
Humphreys & Davidson (1994) and later Smith & Owocki (2006) have suggested that eruptive episodes, which must form the bulk of a LBVN, are metallicity independent. If this is true, LBVs may have had a role in the evolution of the early Universe, when massive stars would have been more numerous than in the present epoch, and may have provided processed material and dust for future generations of stars.
More recently, it has also been pointed out that LBVs might be direct Supernovae 1
2
(SNe) progenitors (Kotak & Vink 2006; Smith et al. 2008), enhancing their importance in the framework of stellar evolution.
LBVs have also been considered as possible dust producers in high-redshift galaxies (Gall, Hjorth, & Andersen 2011), where the significant amount of dust observed in the sub-mm remains as yet an unanswered question. To explain the observations, a fast and efficient dust production mechanism is needed and, together with Core-Collapse Super-novae (CCSNe) and Asymptotic Giant Branch (AGB) stars, LBVs are promising channels for producing dust in the early Universe (Gall, Hjorth, & Andersen 2011).
Finally, LBVs could be cosmological distance indicators (Wolf 1989), thanks to the relationship between their variability amplitude and luminosity.
All these possibilities make LBVs important and fascinating objects to study.
The evolution of massive stars is influenced by the mass-loss during their lifetime, which also determines the stellar remnant (neutron star, black hole, or no remnant at all, Heger et al. 2003). Also the LBV evolution is strongly influenced by the mass-loss which the star undergoes during its post-MS phase.
The mass-loss archaeology of the central object can be recovered from an analysis of its associated nebula. A successful approach is based on a synergistic use of differ-ent techniques, at differdiffer-ent wavelengths, that allows one to analyse the several emitting components coexisting in the nebula (Umana et al. 2011a). In particular, a detailed com-parison of the optical, IR and radio emissions provide estimates of both ionized gas and dust masses and allow us to identify morphological differences in the maps which can be associated with mass-loss behaviour during the LBV phase (Buemi et al. 2010; Umana et al. 2010).
Some galactic LBVNe have been recently studied following this multi-wavelength approach (Umana et al. 2011a), aimed at tracing both the gas and the dust components coexisting typically in LBVNe. Among the most interesting aspects highlighted in these studies, there are: the morphology of the gas and the dust, which can be differently dis-tributed (IRAS 18576+034, Buemi et al. 2010); the chemistry in the nebula, which can be rich in complex molecules, such as Polycyclic Aromatic Hydrocarbons (PAHs) (e.g. HD 168625, Umana et al. 2010), evidence that dust can survive despite the hostile environ-ment due to the UV radiation from the star.
LBVs are quite rare objects: a census of known confirmed and candidate LBVs reports 35 objects in our Galaxy and 25 in the Magellanic Clouds (Clark, Larionov, & Arkharov
3
2005; van Genderen 2001). Hence our knowledge of LBVNe is still very limited due in part to the small number of known LBVs and in part to the short lifetime (t ∼ 10−5− 10−4yr) of the LBV phase. Despite this, the characterization of LBVNe is fundamental to understand the evolution of massive stars.
Adopting the multiwavelength approach mentioned above, we have selected a sub-sample of known LBVs and candidate LBVs (cLBVs) as follows.
We have chosen a galactic cLBV, namely G79.29+9.46, for which a huge amount of data at different wavelengths are available in the archives and new resolution, high-sensitivity observations were scheduled at the Expanded Very Large Array (EVLA) (P.I. Umana G.) during the first year of this PhD program. With its properties, this object appeared to be a good template for studying other LBVs.
To extend the study of the LBV phenomenon in environments different from the galac-tic one, i.e. in galaxies with different metallicity, we have searched in the data archive for LBVNe in the Large Magellanic Cloud (LMC), which is the nearest galaxy (with an ac-cepted distance of ∼ 48.5 kpc) and with half the solar metallicity (Z ∼ 0.5 Z⊙). We found that for LBVs in the LMC very few observations were performed so far in the the mid-IR wavelengths, while no information in the radio were available at all. However, evidence of extended nebulae around LBVs and cLBV in the LMC were reported from a study in the optical. Weis (2003) and Weis, Duschl, & Bomans (2003) performed high-resolution observations of 9 LBVs and cLBV in the LMC with the Hα filter using the Hubble Space Telescopeand the EMMI instrument at ESO. In particular, they found that 5 of these ob-jects show a very well defined shell in Hα, with sizes in the range 5” − 18”, indicating the presence of a nebula around them.
Based on these studies we have selected a group of LVBNe that could be detected at radio wavelengths (which allow us to probe the properties of the ionized gas) through the estimation of the radio free-free emission from the observed hydrogen Hα recombination-line. Hence first radio observations of a small sample of LBVs in the radio have been ob-tained with the Australia Telescope Compact Array (ATCA) during this PhD program in the 3+6 cm band (P.I. Agliozzo C.). Further higher-resolution observations of the detected systems have been performed in January 2012 in the 1.5 cm band (P.I. Agliozzo C.). In this work we present the first radio observations of four LBVNe in the LMC, namely: cLBVs S61 and S119, plus LBVs R127 and R143.
The thesis is organized as follows:
In Chapter 1 we present a review of the literature: LBVs are described in terms of their post-MS evolutionary track and their observed properties. The most important
4
mass-loss mechanisms proposed in the literature are discussed as well as the open issues. Finally a section is dedicated to the motivations of this thesis.
After this general introduction, we describe the investigations performed in this work. The thesis is then organized in two parts:
Part 1is dedicated to the study of the galactic cLBV G79.29+0.46, for which we obtained initial observations at the Expanded Very Large Array (EVLA), followed by observations at the Green Bank Telescope (GBT). These works are discussed in
Chapter 2. First results of these studies have already been published in Umana et al. (2011b). Chapter 3 contains a study performed with archival data, at different wavelengths in the IR domain, that permit us to compare different emitting compo-nents in the ejecta and to derive physical parameters related to the dust and the gas in the nebula. A model obtained with the photo-ionization code CLOUDY is also discussed.
Part 2addresses the study of four LBVs in the LMC (S61, S119, R127 and R143).
Chapter 4contains the first radio detection of LBV nebulae in the LMC obtained with Australia Telescope Compact Array (ATCA) observations. This work has been published in MNRAS (Agliozzo et al. 2012). In Chapter 5 further high-resolution radio observations are presented, together with a morphological and photometric comparison with the Hubble Space Telescope (HST) optical images.
Chapter
1
Luminous Blue Variable stars
The Luminous Blue Variable stars (LBVs) are evolved, luminous (L ∼ 105− 106.3L⊙), massive (MZAMS> 22 M⊙) and hot (T ∼ 7000 −35000 K) stars, characterised by spectro-scopic and photometric variability, and by moderate or extreme mass-loss ( ˙M ∼ 10−6− 10−4M⊙yr−1). As a result of the mass-loss, these stars are surrounded by a large mass (some M⊙) of dust and gas, forming spectacular and huge nebulae (typical sizes range from 0.2 to 2 pc). A review of LBVs was presented first by Humphreys & Davidson (1994) and later by van Genderen (2001) and Vink (2009).
The ejection of the outer envelopes of the star is a necessary condition before they evolve as Wolf-Rayet stars (WRs). In fact, it has been believed that LBVs are progenitors of the hot stars known as WRs, whose destiny is to explode as SN (type Ib/c), but recently it has been proposed that LBVs may skip the WR stage and experience directly the SN event (Kotak & Vink 2006; Vink et al. 2008).
Famous LBVs areη Carinae (η Car), P Cygni (P Cyg) and S Doradus (S Dor). S Dor is widely considered the prototype of photometric and spectroscopic variability and many LBVs are often referred as S Dor variables for this reason. Conversely, P Cyg and η Car are the only two case of eruptive events witnessed in our Galaxy. They suffered such violent eruptions that were observed with naked-eyes, P Cyg in AD 1600 andη Car in the XIX century.
In this chapter we briefly review the LBVs in term of their evolutionary track on the Herzsprung-Russel (H-R) diagram and we describe the physical and observational properties of both the star and the ejected nebula, the open issues related to the mass-loss mechanism and we report the current proposed explanation for it. We also give a glimpse of the aspects that make these stars an intriguing and important object of study. Finally, we dedicate a section to the motivations of this thesis.
1.1 Evolutionary track on the H-R diagram 6
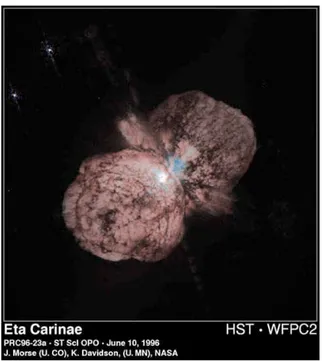
Figure 1.1: The Homunculus Nebula aroundηCar as seen with the Hubble Space Telescope in the optical light (Morse et al. 1998).
1.1
Evolutionary track on the H-R diagram
The evolution of massive stars is believed to be driven by mass-loss. In fact, the reduction of a star mass profoundly affects the size of its convective core, its core temperature, its angular momentum evolution, its luminosity as a function of time, and hence its evolu-tionary track on the H-R diagram and its MS lifetime (Chiosi & Maeder 1986; Smith & Owocki 2006).
As described in Conti & Frost (1976), the main steps in the life of a massive star can be represented with the the following scheme
O → LBV → W R → SN
At the end of its MS life, when the convective core has exhausted the H-burning, the star begins to expand and becomes a blue supergiant with a radius ∼ 102R⊙ and an enhanced He and N surface abundance (Lamers & Nugis 2002). In the H-R diagram, the star moves to the right (cooler temperatures, till T ∼ 8 × 10³K), with moderate mass-loss (see Fig. 1.2).
At some point the star becomes unstable, because it approaches the limit for stability (the Eddington limit): the gravity can not contrast the radiation pressure and, as a conse-quence, the star suffers high mass-loss. This causes the star to move toward the warmer temperatures (T ∼ 3.5 × 10⁴K), until it temporarily stabilizes again. In the meanwhile, the rapid mass-loss increases the star L/M ratio, which reduces its stability. Therefore the
1.1 Evolutionary track on the H-R diagram 7
Figure 1.2: Evolutionary track for LBVs, from Herrero et al. (2010). There are marked the region occupied by LBVs during outburst (vertical box) and the one occupied by LBVs during visual minimum (slanted strip, both from Smith, Vink, & de Koter 2004).
instabilities soon recurs when the star evolves toward cooler temperatures again. At this point the star has become a LBV.
Empirically it was found that for the hottest stars, the luminosity limit for the stability depends not only on the mass, but also on the temperature. This new stability limit is an extension of the Eddington limit and in the H-R diagram can be represented by a locus known as “Humphreys and Davidson strip” (or even “S Dor variability strip”, Humphreys & Davidson 1994, slanted line in Fig. 1.2 and 1.3).
Once the star has become a LBV, it has been believed that the star fluctuates in the H-R diagram around small temperature variations, at constant luminosity. These changes of the effective temperatures are only apparent. In fact, when the LBV approaches the limit for stability, it suffers enhanced mass-loss episodes ( ˙M ∼ 10−5− 10−4M
⊙yr−1). As a consequence, it forms an optically thick pseudo-photosphere, which absorbs the hot radiation from the star and re-emits it at longer wavelengths, causing an apparent temperature decreasing (active state). While the star declines toward the quiescent state, with more moderate mass-loss rate ( ˙M ∼ 10−7− 10−5M
⊙yr−1), the pseudo-photosphere previously formed becomes a circumstellar envelope that evolves from an optically thick to an optically thin nebula. Thus the star surface is again exposed and it appears hot (T ∼ 3.5 × 10⁴K) again (quiescent state).
After the LBV phase, when the star has ejected its H-envelope, the star contracts and becomes a WR (M ∼ 20 M⊙), with higher mass-loss rate ( ˙M> 10−5M
⊙yr−1) and higher wind velocity (v∞∼ 103km s−1, while for LBVs it is typically v∞∼ 102km s−1).
1.2 Observed properties 8
Figure 1.3: A schematic H-R diagram for the most luminous stars (Humphreys & Davidson 1994). The dashed lines represent observed transit in the
H-R diagram
of some LBVs, while the solid lines the empirical upper luminosity boundary.
However, as proposed by various authors (e.g. Kotak & Vink 2006; Smith et al. 2008; Vink 2009), LBVs may not be always traditional objects between O and WR stars and may suffer a final explosion during or at the end of the LBV phase (Vink 2009).
1.2
Observed properties
In this section we give a description of the stellar parameters changes during the LBV excursion in the H-R diagram.
1.2.1
Luminosities and Temperatures
The classical LBVs have log(L/L⊙) greater than 5.8, with bolometric magnitudes in the range Mbol -8 to -11. One of the most important properties of LBVs is their closeness1
to the Eddington limit for stability against radiation pressure for their luminosities and current masses. Historically the Eddington luminosity Lewas defined as
Le=
4πGcM κF
(1.1) where κF is the opacity for electron scattering and the other symbols have their usual
meaning.
The dimensionless Eddington parameter for electron scattering Γe is defined as the
ratio between the outward radiation force and the inward gravity force:
Γe= Lσe
4πcGM (1.2)
1.2 Observed properties 9
Figure 1.4: The LBVs in the H-R diagram. The shaded areas represent the S Dor instability strip (visual minimum, diagonal) and the position of the LBVs during outburst (vertical). The dashed vertical line at 21000 K indicates the bi-stability jump (described in Section 1.3), while the horizontal ones the observed transit of known LBVs. Figure in Vink et al. (2008) adapted from Smith et al. (2004).
whereσeis the electron scattering cross-section. This ratio can not exceed unity, implying
an upper limit to L/M.
LBVs are generally close to the Eddington limit, so radiation pressure reduces their stability.
To explain the observed behaviour of LBVs, Humphreys & Davidson (1984) proposed a modified Eddington limit, where they considered an opacityκdependent on the effective temperature and on the density. Hence the luminosity is not independent of the temper-ature and in the H-R diagram the instability limit appears as a slanted line (the so-called Humphreys and Davidson instability strip).
The apparent changes of the effective temperature during the excursion between the quiescent (or else visual minimum) and active (outburst or visual maximum) states move in the range from 35000 K (corresponding to spectral type late O/early B) to 8000 K (spectral types A-F).
Fig. 1.4 shows known confirmed and candidate LBVs on the H-R diagram, with their transit (the dotted horizontal lines) between their quiescence and active states. The slanted band is the “S Dor instability strip”, indicating the quiescent state, or visual minimum. The amplitude of the S Dor excursions (dashed horizontal lines) becomes larger with increasing luminosity: Wolf (1989) proposed hence that the most LBVs could be used as
1.2 Observed properties 10
cosmological distance indicators.
1.2.2
Photometric and Spectroscopic variability
One of the properties of LBVs is their variability at constant bolometric luminosity. Even though a general classification based on LBVs properties has not been defined as yet, it is possible to distinguish between at least three types of LBV, depending on the variability cycles and the visual magnitudes changes (Humphreys & Davidson 1994; Vink 2009):
(i) the normal LBV variability cycles (S Dor variables) with visual magnitudes changes of 1-2 magnitudes at constant luminosity (e.g. S Dor in the LMC), on timescales of years (short S Dor phases) to decades (long S Dor phases);
(ii) eruptions with visual magnitudes changes of 1-2 magnitudes or more, on timescales of 10-40 years. At visual maximum the star atmosphere is greatly expanded and the bolometric magnitude is unchanged. The visual brightening is due to a redshift of the UV radiation to the optical, caused by the pseudo-photosphere;
(iii) the giant eruption LBVs (e.g.η Car and P Cyg) with visual magnitudes changes of 3 magnitudes or more. This is the only case where the total bolometric luminosity increases.
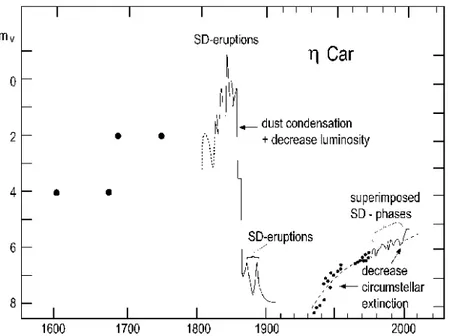
Fig. 1.5 shows the visual light curve ofη Car in the last five centuries. The peak of visual magnitude is the famous “Great Eruption”, occurred between 1837-1860, when the object could be observed easily with naked eyes.
At the photometric variations also correspond variations in the spectra. At the visual minimum the spectrum is dominated by emission-lines of H, HeI, FeII and [FeII], resem-bling a hot supergiant, while at the visual maximum the FeII is weaker and the optically thick expanded atmosphere resembles a cool supergiant of spectral type A of F.
An important spectroscopic feature observed in the emission-lines of these objects is the P-Cygni profile, as shown in Fig. 1.6. In particular, it consists of two components in the Hα line, one in absorption and one in emission. The emission component traces the systemic velocity (Castor & Lamers 1979), the blue-ward part of the absorption compo-nent relates to the velocity of the moving envelope from the star.
1.2.3
Abundances
During the evolution of a massive star, the atmospheric abundances of He and CNO cycle products change, once that the nuclear reactions products have reached the stellar surface.
1.2 Observed properties 11
Figure 1.5: Visual light curve ofηCar (van Genderen 2001).
Figure 1.6: Spectrum of P Cyg in the wavelengths range 6550-6800 ˚A (http://maps. seds.org/Star_sen/Spectra/pcyg.html).
1.3 Proposed mass-loss mechanisms 12
LBVs show a wide span of CNO ratios. Although most LBVs have He and N en-hanced atmospheres, it seems unlikely that all of them have reached equilibrium CNO values in their outer atmospheres (Vink 2009).
Najarro, Hillier, & Stahl (1997) found a He atmospheric abundance n(He)/n(H) rang-ing between 0.25-0.55 in P Cyg, while for a typical LBV nebula Lamers et al. (2001) provide n(He)/n(H)∼0.1-0.2.
1.2.4
Membership and recent census of LBVs
To officially qualify as LBV, an object should at least have shown the combination of spectroscopic/photometric variations, which are characteristic of S Dor-type variability due to changes in the apparent temperature of the star. Together with the variability, van Genderen (2001) included also other two criteria: the evidence of ejecta and high luminosity, coupled to high mass-loss rates (Sterken et al. 2008).
Depending on these criteria, catalogues in the literature contain two kind of objects: confirmed LBVs and candidate LBVs. Two main catalogues have been considered up to now: van Genderen (2001) and Clark, Larionov, & Arkharov (2005) counted 35 objects in the Milky Way (12 LBVs and 23 cLBVs) and 25 in the Magellanic Clouds (MCs).
Based on the discovery of many ring nebulae surrounding luminous stars, through observations with the space telescope Spitzer, Wachter et al. (2010) and Gvaramadze, Kniazev, & Fabrika (2010) have investigated the nature of such stars and proposed new objects as cLBVs in our Galaxy.
Considering the new entries, Naz´e, Rauw, & Hutsem´ekers (2012) have updated the cLBVs catalogue, that now counts 67 objects in the Milky Way (see Table 1 in Naz´e, Rauw, & Hutsem´ekers 2012). The confirmed galactic LBVs stay 12, as in Clark, Lari-onov, & Arkharov.
Summarizing, at the moment the known galactic cLBVs are 67, the magellanic cLBVs and LBVs are 25 and a few are known in other nearby galaxies (M31 and M33).
1.3
Proposed mass-loss mechanisms
To become a WR star (with M< 20 M⊙), a massive (22< MZAMS
M⊙ < 150) star has to shed its H envelope (Abbott & Conti 1987; Crowther, Lennon, & Walborn 2006). Stellar winds during the MS life of a star are not sufficient to strip off the H envelope and also moderate winds during the LBV phase could not be intense enough. For example, considering a mass-loss rate of 10−5− 10−4M⊙yr−1 in a lifetime of a few times 104− 105yr, a LBV star can lose between 0.1 − 10M⊙, which is a substantial amount in the case of the lowest
1.3 Proposed mass-loss mechanisms 13
massive stars to reach the WR phase, but not enough for the most massive stars. Hence, higher mass-loss rates are needed to reduce the star total mass and possibly through short-duration giant eruptions or explosions (Smith & Owocki 2006; Humphreys & Davidson 1994), like the outburst experienced by η Car in the 19th century, during which about 12 ∼ 20 M⊙ (Humphreys, Davidson, & Smith 1999; Smith et al. 2003) were ejected2. However, such events have been witnessed very rarely (e.g,η Car3and P-Cyg4). Hosted by nearby galaxies, other examples of eruptive events are known: for example, SN 1954J and SN 1961V, which were initially mistaken for SN events and later renamed as SN impostors(Humphreys, Davidson, & Smith 1999; van Dyk 2005).
Which mechanism drives the drastic events suffered by giant and normal eruption LBVsand the high or moderate mass-loss experienced by S Dor-type variables is not well-established. Moreover, whether and how the S Dor-type variables change the mass-loss via optically thin line-driven winds in optically thick winds (or in pseudo-photosphere) is also not clear (Vink 2009).
We give a brief summary of the main mass-loss mechanisms proposed until now in the literature.
Line-driven winds and the Bi-stability Jump Mass-loss in massive stars is gener-ally due to opticgener-ally thin line-driven winds, where the driving is caused by the radiation pressure on millions ionic spectral lines. The first description of the mechanism was pro-posed by Castor, Abbott, & Klein (1975) and then improved by Puls, Vink, & Najarro (2008), Lucy (2007), Vink (2000). Metal ions are efficient photon absorbers at specific line-frequencies, and where the resulting radiative acceleration dominates on the inward pointing gravitational acceleration, an outflow results (Vink 2008; Vink & de Koter 2002). In particular, the most efficient absorber in stellar winds is Fe, thanks to its highly complex atomic structure, with millions of line transitions5, which make it an efficient absorber of radiation. However, line-driven winds are not sufficient to explain the mass ejecta (some ∼ M⊙) observed around different LBVs, in typical LBV timescales (104− 105yr).
Moreover, it has been noticed (e.g. the galactic LBV AG Carinae, hereafter AG Car) and then predicted that ˙M changes drastically during the LBV excursion between the quiescent and the active phases (between the maximum and minimum apparent effective
2By proper-motion measurements it was found that the Great Eruption, observed visually in the 1840s,
gave origin to the Homunculus nebula aroundηCar (Fig. 1.1).
3η Car must be considered an extreme example of LBV star, with the highest mass-loss rate derived,
˙
M ∼ 10−3M
⊙yr−1(van Boekel et al. 2003).
4It has been believed that the XVII century outburst, during which P-Cyg brightened several times, was
characterized by an astonishing mass-loss rate, of the order of ∼ 10−2M ⊙yr−1.
5Thanks to these line transitions, Fe results a better absorber in respect to H, despite this in the Milky
1.3 Proposed mass-loss mechanisms 14
Figure 1.7: Empirical (dashed line) and predicted (dotted line) mass-loss rates for AG Car as a function of Te f f, as analysed by Stahl et al. (2001) and Vink & de Koter
(2002) respectively. Figure taken from Vink & de Koter (2002).
Figure 1.8: The predicted wind efficiency numberη= ( ˙Mv∞)/(L∗/c) as a function of effective temperature (from Vink, de Koter, & Lamers 2000). Note the presence of a local maximum at the position of the bi-stability jump around Te f f = 21000 K.
1.3 Proposed mass-loss mechanisms 15
temperature, see Fig. 1.4 and 1.7). More specifically, ˙M would increase strongly when stars evolve towards the B supergiant regime. This phenomenon is known as the bi-stability mechanism.
The cause of the bi-stability jump6in the mass-loss rate (in Fig. 1.4 the dashed vertical line and in Fig. 1.7 the jump in ˙M) is that the most important line-driving element, Fe, recombines from FeIV to FeIII at 21000 K and that suddenly the Fe lines become much more effective, as they fall in the wavelengths range where the flux distribution is maximal (Vink 2011) and more lines are available to drive the wind. The result is an increase in ˙M and a drop in terminal velocity7(see Fig. 1.7 and 1.8). The latter has been confirmed in observed data (e.g. Lamers, Snow, & Lindholm 1995) but, as pointed out by Vink (2011), the jump in mass-loss rate is still controversial (e.g. Crowther, Lennon, & Walborn 2006; Benaglia et al. 2007).
The relevance is that LBVs brighter than log(L/L⊙)=5.8 are expected to encounter the jump continuously, on timescales of their photometric variability, inducing variable mass-loss rates (Vink 2011).
The mass-loss rate modelled by Vink, de Koter, & Lamers (1999, 2000) can be written as a function of the stellar parameters
˙
M∝ L2.2M−1.3Te f f(v∞/vesc)−1.3 (1.4)
where v∞ and vesc are respectively the terminal flow and the effective escape velocities.
This model is valid in the range Te f f=12500-5000 K, except for the bi-stability jump
around 21000 K, where the predicted mass-loss properties change drastically, with a drop of v∞and a jump of ˙Mby a factor of five (Vink, de Koter, & Lamers 1999; Vink 2011).
Metallicity independent mechanisms Recently, Smith & Owocki (2006) showed that high or even extreme mass-loss rates, needed to explain the observed nebulae, would cause heavy saturation for the line opacity and hence lines could not drive the wind. This means that if mass-loss during these eruptions occurs via a wind, it must be a super-Eddington wind driven by continuum radiation pressure (Thomson scattering opacity) from the stellar surface.
6The bi-stability jump was first discussed by Pauldrach & Puls (1990) in the context of their model
calculations of the LBV P Cygni. The first empirical work on the bi-stability jump for a sample of stars was that by Lamers, Snow, & Lindholm (1995).
7The wind characteristics as a function of stellar spectral type are described also in terms of the wind
efficiency numberη(see Fig. 1.8):
η=Mv˙ ∞
L/c (1.3)
1.3 Proposed mass-loss mechanisms 16
An alternative proposed by Smith & Owocki (2006) to the continuum-driven wind is a deep-seated hydrodynamic explosion. They explain that it may be due to inefficiency of the convection when the star is near the Eddington limit, generating a density inversion which leads to a violent explosion (Joss, Salpeter, & Ostriker 1973; Arnett, Meakin, & Young 2005; Young et al. 2005). In this case, unlike steady winds which are driven by lines, the driving in these eruptions may be independent of metallicity (Smith & Owocki 2006).
This must be yet established. However, very recently, a very interesting study of light echoes of the XIX century η Car Great Eruption seems to support the hydrodynamic explosion theory as mechanism responsible for the famous outburst (Rest et al. 2012).
What we know at the moment is that when a LBV is in the quiescent phase line-driven winds can justify the estimated mass-loss rate, but to explain the mass in the observed neb-ulae an extreme mass-loss mechanism must occur during the active phase. Which mech-anism (an optically thick continuum-driven wind or a hydrodynamic explosion) cause the ejection of a huge amount of mass is not yet clear. Further, the duration and the frequency of these events in the lifetime of a massive star are also poorly understood. Concerning this, we know from the observations that bothη Car and P Cyg, among the most stud-ied LBVs, are surrounded by multiple shells, indicating that LBVs can suffer different extreme mass-loss episodes during their life (Walborn 1976; Meaburn 2001).
Among the most appealing explanations (e.g. Humphreys & Davidson 1994; Smith et al. 2011)for deep-seated hydrodynamic explosions there are:
Critical rotation limit. A star may reach instability because of rapid rotation. However, it is not clear how reaching this critical rotation will induce a sudden out-burst of mass-loss, and it does not explain the observed increase in the bolometric luminosity of giant eruptions.
Shell-burning explosions. Explosive burning may be triggered by mixing of fresh H-rich fuel into deeper and hotter layers of the star. The mixing may be due to oscillations in the outer envelopes of the star.
Close-binary interaction events.It has been suspected that some LBVs are in a bi-nary system with a companion (e.g.ηCar, HR Car). Increasing of the stellar radius during the post-MS evolution may cause collisions with the companion surface. It is possible thatη Car XIX outburst was due to such kind of collision.
Implications If the only mechanism responsible for the mass-loss is the line-driven wind, then low-metallicity leads to less mass-loss in low-metallicity environments,
per-1.4 LBV Nebulae 17
haps resulting in a preference of long Gamma-Ray Burst (GRB) in the early Universe (Vink 2011). In low-metallicity environments the efficiency of Fe drops drastically. Ob-jects that are born with fewer Fe atoms may lose less matter by the time they reach the end of their lives, despite their longer contents of CNO material (Vink 2011). In this case host galaxy metallicity may play a crucial role for the evolution of massive stars.
Conversely, if the bulk of the mass ejected by the star is due to hydrodynamic explo-sions, rather than steady winds, as proposed by Smith & Owocki (2006), then the LBV phenomenon is independent of the metallicity and gives LBVs a great relevance in the evolution of the early Universe.
1.4
LBV Nebulae
The evolution of LBV stars is strongly influenced by the mass-loss during their post-MS life. As a result of intense and possible multiple mass-loss episodes (eruptions and/or sta-tionary winds), LBVs are generally surrounded by circumstellar nebulae of gas (ionized, atomic, and maybe molecular) and dust (thermal, possibly PAHs...) that emit at different wavelengths. These nebulae represent, therefore, a fossil record of the most important mass-loss phase experienced by stars (Smith 2011). This is one of the reasons that make them interesting objects to study.
Based on the very limited number of LBVNe studied in detail, we present here some common aspects and possible similarities.
LBVNe are very massive. Fig. 1.13 shows nebular massed deduced by various authors (Fig. 1 in Smith & Owocki 2006). Not all LBVNe are massive as the one ofη Car or Pistol star (∼10-20 M⊙). Some are only about ∼0.1 M⊙8. Usually these nebulae are few solar masses.
These ejecta are typically 0.2-2 pc sized and ring-like or shell-like shaped (for example AG Car - Fig. 1.10 - and He3-519 - Fig. 1.12 - respectively), but many appear bipolar or hourglass-shaped (remember η Car - Fig. 1.1 and compare with Sher 259 - Fig. 1.11), and one is irregular (R143).
The dust and gas morphologies are sometimes very similar (co-spatial), but often very different (see for e.g. IRAS 18576+0341, Fig. 1.9). Some cases have shown the presence of different epoch shells (e.g. AG Car10, Sher 25), implying the question: how many
8
This is sometimes even seen in the same star: after ejecting ∼15 M⊙ in its 1840s eruption,η Car
subsequently ejected ∼0.1-0.2 M⊙in its smaller 1890 eruption (Smith 2005).
9cLBV Sher 25 has a circumstellar ring of gas that is considered the galactic twin of the ring surrounding
the LMC SN 1987A. It also presents a bipolar outflows, as visible in Fig. 1.11.
10The AG Car nebula show two nested, concentric shells, which display differences in their expansion
1.4 LBV Nebulae 18
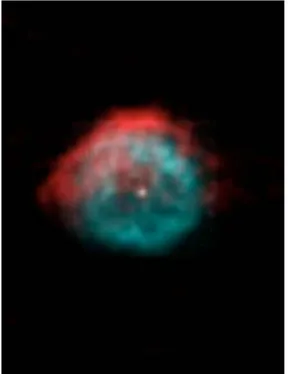
Figure 1.9: Composite image of IRAS 18576+0341 obtained by superposition of VLA radio images at 6 cm (red) and VISIR 17.65µm (blue). Figure taken from Buemi et al. (2010).
Figure 1.10: HST color image of the nebula around AG Car (Weis 2011).
Figure 1.11: Hα HSTimage of Sher 25.
Figure 1.12: Hα HST image of He3-519. Figure taken from Weis (2011)
1.4 LBV Nebulae 19
Figure 1.13: Deduced masses of LBV (filled circles) and cLBV nebulae (open circles) as a function of the central star bolometric luminosity. Luminosity are taken from Smith, Vink, & de Koter (2004), while references for the masses are given in Smith & Owocki (2006). The shaded part corresponds to luminos-ity of stars that may be post-RSGs. Fig-ure taken from Smith (2008).
violent eruptions LBVs pass through?(Humphreys & Davidson 1994).
Quantitative analysis of the ejecta shows that they are N and He rich, indicating that nuclear material processed through the CNO cycle has risen to the surface and has been ejected (e.g. Davidson et al. 1986; Lamers et al. 2001; Smith 2011).
Among the open issues, there is the question whether Photo-Dissociation Region (PDR) are present in such ejecta. In fact, some LBV nebulae show complex molecules (e.g., PAHs), or other features typical of PDRs (e.g low-excitation fine structure lines), but if this is common to all the LBVs it is not yet established.
Several aspects of the LBV evolution can be investigated analysing the LBV ejecta, most of these aspects are linked to the mass-loss archaeology of the star. Among the most interesting aspects are the following:
• the total mass lost during the LBV stage. This can be recovered if one knows its duration and a time-averaged mass-loss rate (Humphreys & Davidson 1994). Or, better, one can evaluate the current mass-budget by observing the different emitting components;
• the geometry of the mass-loss, through a morphological study of the ejecta. For example, the bipolar nature of the Homunculus nebula (Fig. 1.1) shows that the Great Eruption must have been strongly aspherical.
• the epoch of the mass-loss episodes and the timespan between the most important events. The kinematical age can be directly determined knowing the nebula expan-sion velocity and radius.
1.4 LBV Nebulae 20
• the origin of bipolarity. This may be attributed to mass-loss from a rapidly rota-tion star (e.g. Smith 2006), or to various degrees of asymmetry in the pre-existing environment (Frank, Balick, & Davidson 1995).
• the frequency of the outbursts.
1.4.1
The dust
Most well known galactic LBVNe contains dust. Formation of grains in LBVNe is yet unclear, as well as their capacity to survive despite the strong UV field from the star.
Infrared spatial observatories (IRAS, ISO, MSX, Spitzer) have shown very often an excess IR or, even, spatially resolved circumstellar material around these stars (e.g. Clark et al. 2003). In most cases, this emission is attributable to thermal graphite and silicates.
Spectroscopic studies revealed amorphous silicates in some LBVNe (for example, HR Car, Lamers et al. 1996; Umana et al. 2009).
In the case of HR Car, Umana et al. (2009) found that these silicates are distributed in the inner nebula and suggested that the dust formation during the LBV phase is pos-sible. Crystalline dust features (e.g. AG Car, WRA 751, R71, Waters et al. 1998; Boyer et al. 2010) have also been observed, with similarity to dust found in Red Super Giant (RSG) stars, suggesting that the conditions in the dust forming layers (density, temper-ature, chemical composition) of these objects have been similar (Waters et al. 1998). Waters et al. hence proposed that AG Car and WRA 751 may have been RSG stars when they expelled the observed mass ejecta. However, this is still controversial (Lamers et al. 2001).
Complex molecules such as PAHs have been observed in some LBVNe (for example, in AG Car, Trams, Waters, & Voors 1997). PAH emission has been also indicated in R71 and in HD 168625 (Fig. 1.14, Umana et al. 2010).
AG Car and HD 168625 also show reflection nebulae, suggesting the presence of large grains. The nebula of HD168625 extends beyond the Hα ring; this is also the case in some parts of the AG Car nebula and of the HR Car nebula (Voors et al. 1997).
Dust temperature in LBVNe is generally between 50 and few hundreds K. Interesting is the correlation between the dust temperature and the optical nebular radius, as Hutse-mekers (1997) noticed in its study of a sample of LBV stars (Fig. 1.16). This result is not strange, as the inner dust receives more heat from the star than the outer one.
What allows dust formation? Conditions for the dust formation depend on the envi-ronment where it forms, in particular the chemical composition of the gas phase and the
1.4 LBV Nebulae 21
Figure 1.14: IRS-SL spectrum and in the upper left the fraction of the nebula sampled by the module. Figure as in Umana et al. (2010).
1.4 LBV Nebulae 22 Figure 1.16: The nebular dust temperature as a function of the optical nebular radius of a sample of galactic LBVs (filled squares), LMC LBVs (open squares), WN8 and WN5-6 (losanges and circles).
internal energy of the grain just formed. In general, the ideal gas temperature must range from ∼ 700 K to ∼ 2000 K, while the density between ∼ 10−13− 10−15g cm−3 (Feder et al. 1966; Clayton 1979; Sedlmayr 1994; Gall, Hjorth, & Andersen 2011).
LBVs stars are late O, early B stars and have hence a strong ultraviolet radiation field that should prevent dust formation. Also the low-particle density environment should inhibit the dust growth. But it is evident that LBVs form considerable amount of dust, probably during the eruptive phase.
In fact, as discussed recently by Kochanek (2011), LBVs can expel enormous amount of material under conditions favourable to the growth of dust grains. For example, this is illustrated by the massive (∼ 10 M⊙), optically thick dusty shell surroundingη Car. The phenomenon is more common than previously thought, since many 24 µm shells have been discovered with Spitzer around massive stars (e.g. Gvaramadze, Kniazev, & Fabrika 2010).
An explanation could be that high mass-loss rates favour particle growth and an opti-cally thick environment (as the pseudo-photosphere) can shield the dust formation region.
1.4.2
The gas
In LBVNe the gas is almost ionized by the ultraviolet radiation from the star. The gas is hence observed mainly through continuum free-free emission in the centimetric and
1.5 Motivations of this thesis 23
millimetric range, or through the optical Hα recombination-line emission, if not extin-guished11by dust or obscured by strong stellar radiation (as HR Car, Nota et al. 1997).
Radio emission from LBVNe has been already detected in AG Car, He3-519, WRA 751, HR Car (Duncan & White 2002), in IRAS 18576+0341 and HD168625 (Umana et al. 2005; Buemi et al. 2010; Umana et al. 2010), in Pistol Star (Lang et al. 2005).
Mid-IR and far-IR line emission from ionized elements are, for example, [NiII] 8.68 and 12.77µm, [NeII] 12.81µm, [CoII] 14.74µ, [FeII] 17.93µm, [SIII] 18.71 and 33.48 µm, [FeIII] 22.92µm, [SiII] 34.81µm, [OIII] 51.81 and 88.36µm. Low-excitation fine structure lines ([FeII] and [SiII]) are indicative of the presence of a PDR, as pointed out by Umana et al. (2009) studying the mid-IR spectrum of HR Car (see Fig. 1.15).
Rotational lines of CO have been detected by Nota et al. (2002) in AG Car, but whether molecules are common features in LBVNe is an open question.
1.5
Motivations of this thesis
The number of known LBVs is still limited. The reasons are several. First of all, their are transition objects with a short lifetime (∼ 104yr), as a consequence most of them evolved very rapidly. And a massive star itself is short-lived in comparison to the solar system timescale. Another reason is that these objects must experience spectroscopic and photometric variability to be members of the LBVs class. In the catalogues, most of the known objects are only candidate LBVs, probably because they were observed in the dormant phase (quiescence) and they did not experience outbursts during the observations. However, it has been proposed (van Genderen 2001) that a requirement to classify a star as LBV could be the presence of a nebula with properties that appear to be very common in the known LBVs.
One of the purpose of this thesis is to study, through a detailed multiwavelength anal-ysis, the different emitting components in the ejecta of one among the most significant cLBV (G79.29+0.46) in our Galaxy. This analysis has the goal to better understand the physical and chemical properties of the nebula. Another goal is to recover the mass-loss history through analysis of the multiple-shells, indicative of different mass-loss episodes, and of the current-day mass-loss. Similar investigations may be then used as template to identify new objects through analysis of their ejecta and of the mass-loss phenomenon.
Until few years ago it has been believed that, being metal-free, the first stars would not have experienced mass-loss12 before to explode as SNe. However, if the driving
11As the most LBVs in our Galaxy.
1.5 Motivations of this thesis 24
mechanism for the outburst which LBVs seem to suffer is not sensitive to metallicity, as suggested by Smith & Owocki (2006), then the first massive star evolution must be revisited. As pointed out by the authors of the mentioned work, since we do not know yet what triggers LBV eruptions, we can not claim that these eruptions occurred in the first stars.
A way to understand the phenomenon, from an observational point of view, is to study the LBVs in environments with a metallicity different from the solar one. The intriguing aspect of this study is the cosmological implication that would have. In fact, if the LBVs outbursts occurred also in the early Universe, when massive stars would have been more numerous, with a flatter initial mass function than stars at the present epoch (Bromm & Larson 2004), then they could have had a paramount importance providing the necessary processed material and mechanical energy to the interstellar medium for future generations of stars.
Studying LBV nebulae in an environment different from those galactic is one of the purpose of this work. Here we provide a pilot study at the radio wavelengths of LBV ejecta in the LMC, which is the closest galaxy to the Milky Way and has half the solar metallicity. The goals of this pilot study are: to detect for first time LBVNe in the LMC at centimetric wavelengths; to study the nature of the radio emission; to recover the ejecta mass and size and the mass-loss history, through analysis of the current-day mass-loss rate and of possible multiple shells in the selected targets; to compare these properties with galactic examples.
LBVs have also been considered as possible dust producers in high-redshift galaxies (Gall, Hjorth, & Andersen 2011), where the significant amount of dust observed in the sub-mm is yet unexplained. To explore this possibility, we should understand how much dust LBVs produce. Most of the galactic objects has already shown the presence of dusty nebulae. Instead, observations in the IR have not been performed so far in LMC objects (except few cases), in part because of unsuitability of the current instruments.
Therefore, another goal of this work is to explore the dust content in the LMC’s LBVNe, by comparing high-resolution radio maps obtained during this PhD program with Hα HST images. This analysis may be then used as starting point to plan high-resolution observations with the upcoming Atacama Large Millimeter/submillimeter Ar-ray (ALMA).
Part I
A galactic template: the candidate LBV
G79.29+0.46
26
Figure 1.17: Three-colour image of the galactic cLBV G79.29+0.46 in the Spitzer/IRAC bands. Red: 8 μm; Green: 5.4 μm; Blue 3.6 μm. Maps provided by the Cygnus-X Legacy Survey (http://www.ipac.caltech.edu/spitzer2008/ proceedings.html).
G79.29+0.46 is a candidate LBV located in the Cygnus-X (D ∼ 1.7 kpc, Schneider et al. 2006), one of the richest star forming regions in our Galaxy. Thanks to its location and also to its beautiful aspect and intriguing nature, this star and its associated nebula have been widely observed in the spectral domains, ranging between the optical and the radio, with plenty of instruments. This makes this source a perfect object to study applying a multiwavelength approach. The advantage of the former is that it permits the study of different aspects and different emitting components related to the LBV phenomenon, useful to constrain fundamental parameters in the context of the massive star evolution.
This work started with the observations on G79.29+0.46 performed at EVLA (P.I. Umana G.), which we present in Chapter 3 together with the infrared images taken by the satellite Spitzer. This investigation was followed hence by further radio observations at GBT (P.I. Trigilio C.) and by the analysis of almost all the data available in the archives, as illustrated in Chapter 4.
27
and NASA/IPAC and was supported by a grant from JPL/Caltech that allowed the author of this thesis to spent four months in Pasadena, CA.
Chapter
2
EVLA and GBT observations of the
nebula around G79.29+0.46
Abstract
We have observed the nebula around the candidate LBV G79.29+0.46 with the EVLA at 20 and 6 cm, using the array in the configurations D and C. The maps of the radio nebula have an angular resolution of ∼ 3.1” at 6 cm and of ∼ 25” at 20 cm and sensitivities ranging between 0.07-2.6 mJy beam−1.
We have also performed GBT observations of the radio nebula, in order to complement the interferometric datasets with the most extended emission. At GBT we used the same bands (L and C) as at EVLA and got a sensitivity of 20 Jy beam−1 in band L and of 5 Jy beam−1in band C, with the beams respectively 8.4’ and 2.4’.
Analysis of the radio maps provides us with: the spectral type, the current-day mass-loss and the spectral index of the central object; the spectral index map and the ionized mass of the nebula around G79.29+0.46.
The radio maps are then compared with the Spitzer IRAC (8 μm) and MIPS (24 μm and 70 μm) images, which we retrieved from the data archive and reprocessed. We con-firm the presence of a second shell at 24 μm and provide evidence of its detection at 70 μm.
The comparison between the radio emission, which traces the ionized gas, and the IR emission, which traces the dust, shows that different emitting components are distributed in different shells. Moreover, there are at least two populations of dust: the warmer one, at shorter distances from the star, emitting in the IRAC bands, and the colder dust, which is distributed in two shells at bigger radii and emits in the MIPS bands.
We also estimate the kinematical age of the nebula and the timespan between the two great eruptions occurred in the past. All the parameters found in this work are consistent
2.1 Introduction 29
with previous estimates and with values of other galactic LBVs.
Finally, we discuss finer details of the ionized gas distribution, which can be appre-ciated thanks to the improved quality of the new 6 cm image, for example brighter fea-tures associated with the interaction between the nebula and the surrounding interstellar medium. In particular, the brighter filaments in the south-west region appear to frame the shocked south-western clump reported from CO observations. These filaments show to be related to the shock also in our spectral index map.
Part of this work has been published in a special edition of the Astrophysical Journal Letters (Umana et al. 2011b).
2.1
Introduction
G79.29+0.46 is a galactic candidate LBV placed in the Cygnus-X star forming region. It has been discovered in the radio by Wendker, Higgs, & Landecker (1991), which found a highly symmetric ring-like nebula surrounding the star, after DRAO Synthesis Telescope observations. Later Higgs, Wendker, & Landecker (1994) performed high-resolution in-terferometric VLA observations and attributed to the continuum radio emission a thermal nature. They suggested that the ring-like nebula is an ionized shell of swept-up interstel-lar material. The real nature of the nebula was determined by Waters et al. (1996) which, by examining infrared IRAS images, pointed out that the ring-like structure is a detached shell formed during an epoch of high mass-loss (∼ 5 × 10⁻⁴M⊙yr−1) and followed by a more quiet period.
G79.29+0.46 was hence proposed to be a LBV, but it is still a candidate because its observed properties to date do not satisfy the spectral and photometric variability needed to be accepted as LBV (see Sections 1.2.2 and 1.2.4 for further details). However, recently Vink et al. (2008) found Hα variations, suggestive of mass-loss variability during S-Dor variations.
More recently, the space telescope Spitzer provided high-sensitivity, high-resolution InfraRed Array Camera (IRAC) (Fig. 1.17) and Multiband Imaging Photometer for Spitzer (MIPS) maps (The Cygnus-X Spitzer legacy program, Hora et al. 2010) which provided a better understanding of the dust properties (Kraemer et al. 2010).
Based on observations made with the Submillimeter Telescope (SMT), Rizzo, Jim´enez-Esteban, & Ortiz (2008) investigated the molecular gas surrounding the nebula. They detected CO millimeter emission in large-scale features, which are probably background and/or foreground emission associated with the star forming region DR15, but also in minor-scale high density features, coincident with more than half the IRAS nebula. They
2.2 Observations and Data Reduction 30
also reported the presence of a shock front, interpreted as a natural consequence of differ-ent wind regimes during the cdiffer-entral object’s evolution. The observed clumps may have been formed during a mass-eruption occurred about 103− 104yr ago.
Our knowledge of the radio emission has been limited to the 1988 VLA data reported by Higgs, Wendker, & Landecker (1994) and to the 1400 and 350 MHz Westerbork obser-vations, carried out between 1996 and 1997 and reported by Setia Gunawan et al. (2003). These observations were limited in resolution and especially in sensitivity.
For this reason we performed new Expanded Very Large Array (EVLA) observations with sufficient dynamical range, sensitivity, and angular resolution to provide a good match to the Spitzer images. The EVLA observations allow, for the first time, a de-tailed morphological comparison with other maps tracing the different components of the nebula.
However, a problem typical of interferometers is related to the short spacing in the uv-plane. In fact, an array does not provide the “zero baseline”. When a source is very extended, it has much more power at the short spacing. If these spacing are unsampled the result is that it is impossible to interpolate the total flux, i.e. the extended emission. In principle the appropriate value would be that measured by a single element of the array, but in practice, single array elements rarely have sufficient sensitivity to provide this estimate accurately (Cornwell, Braun, & Briggs 1999). To overcome this problem, we carried out observations with a single, big and sensitive radiotelescope, the Green Bank Telescope.
In order to study the nature of the central object, previously detected by Higgs, Wend-ker, & Landecker (1994), we have also retrieved and analysed VLA archive data at 8.46 GHz.
In Section 2.2 we describe our radio observations and data reduction processing, to-gether with the Spitzer images, which we reprocessed for a comparison of the IR emission with that radio. We show the obtained radio maps in Section 2.3, followed by the analysis of the ionized gas emission (Section 2.4). In Section 2.5 we compare the gas distribution versus the dust components present in the nebula. Finally, we present our final remarks in Section 2.6.
2.2
Observations and Data Reduction
In this section we describe our EVLA and GBT observations, together with the data re-duction process made in this work. Tables 2.1 and 2.2 summarize the observational strat-egy adopted. A subsection is dedicated to the archival VLA data at 8.46 GHz and to the
2.2 Observations and Data Reduction 31 Table 2.1: EVLA observational summary.
Observing Configuration Frequency Integration time Phase Cal
dates (GHz) on-source (min)
2010 June 1 D 1.391 75 J2052+3635
2010 June 11 D 4.959 75 J2015+3710
2010 December 1 C 1.391 75 J2015+3710
2010 December 5 C 4.959 75 J2015+3710
Table 2.2: GBT observational summary.
Observing Frequency Integration time
dates (GHz) (s)
2011 June 4-6 1.475 97.2
2011 June 4-6 5.100 97.2
Spitzerimages that we reprocessed for a comparison with our radio maps.
2.2.1
EVLA observations
Observations of the radio nebula surrounding G79.29+0.46 were made at 1.4 and 5 GHz with the EVLA in two configurations (D and C, respectively on 2010 June 1 and 11 and 2010 December 1 and 5) and a total bandpass of 256 MHz (P.I. Umana G.). The observa-tions consisted in 5-min scans on the target (centred at RA 20:31:42.0, Dec +40:21:59.0, J2000), preceded and followed by 1-min scans on the phase calibrator, for a total of 75 minutes on-source integration time. J0137+3309 was pointed to obtain both the bandpass and flux calibrations.
Dadasets were edited and reduced by using the Common Astronomical Software
Applications (CASA) package, version 3.0.2. Bad baselines and channels were removed when noisy or not properly working. After applying the bandpass and time-based gain corrections, the datasets were imaged adopting a natural weighting scheme to the visi-bilities and using the Clark algorithm for the dirty image deconvolution. The cleaned images were therefore convolved with a 2D-Gaussian, with the Half Power Beam Width (HPBW) reported in Table 2.3. Following this scheme, we have obtained four maps,
2.2 Observations and Data Reduction 32
Figure 2.1: EVLA radio maps obtained in this work. On the left: 20 cm maps at three different resolutions. On the right: 6 cm maps. In the bottom-left corner of each panel the synthetic beam is shown, i.e. the resolution in the map. The map in the bottom-right corner has already been published in Umana et al. (2011b).
2 .2 O b se rv a tio n s a n d D a ta R ed u ct io n 3 3
Table 2.3: Properties of the radio maps.
Configuration HPBW PA LAS Peak on-source rms
& frequency (arcsec)2 (deg) (arcsec) (mJy beam−1) (mJy beam−1)
EVLA:D, 1.4 GHz 50.40×42.83 163.6 129 26.0 2 EVLA:D, 5 GHz 16.46×14.16 -33.2 88 6.8 0.7 EVLA:C, 1.4 GHz 27.72×14.44 44.4 258 9.6 2.5 EVLA:C, 5 GHz 9.41×4.84 58.7 124 2.11 0.18 EVLA:D+C, 1.4 GHz 26.84×24.65 36.1 129 13.17 2.6 EVLA:D+C, 5 GHz 4.56×3.09 101.16 124 1.76 0.07 GBT, 1.4 GHz 504×504 0 4500 19.83×10³ 10.9×10³ GBT, 5 GHz 144×144 0 1500 14.27×10³ 10.66×10³ GBT&EVLA:D+C, 1.4 GHz 26.84×24.65 36.1 4500 17.5 4.3 GBT& EVLA:D+C, 5 GHz 4.56×3.09 101.16 1500 3.07 0.63
2.2 Observations and Data Reduction 34
which we present in the top and middle panels of Fig. 2.1. In the table we also report the peak flux density (on-source) and the rms evaluated on the map.
The corrected visibilities at 1.4 and 5 GHz in both the two configurations were then combined, in order to increase the uv-coverage1. This consists in the concatenation of data with different spatial frequency in the visibility plane. Once we got a single dataset per frequency, we performed a new imaging process, with the Clark algorithm. This time we chose a Briggs-type weighting scheme for visibilities for the map at 6 cm, by setting the robust parameter equal to 0, a compromise between uniform weighting of the baseline for highest-resolution and natural weighting for highest-sensitivity. To achieve high-resolution images that are also sensitive to extended structure (Brogan et al. 2006), we used the multi-scale CLEAN method. At 5 GHz the resulting image rms-noise is 0.07 mJy beam−1 and the synthetic beam 4.56”×3.09”. At 1.4 GHz the rms-noise is 2.6 mJy beam−1 and the synthetic beam is 26.84”×24.65”. Peak on-source is listed in Table 2.3 for all the maps.
The final images are shown in the last two panels of Fig. 2.1 and are described in Table 2.3. The best image obtained is the 6 cm map, which offers the highest-resolution and the best sensitivity.
2.2.2
GBT observations and data processing
As shown in the figures, the radio nebula is about 2′×2′sized. The Largest Angular Scale (LAS) of EVLA (see column 2 in Table 2.3) filters out the extended emission. Hence we expect that diffuse emission from the nebula is not detected.
In order to complement the EVLA dataset, single-dish observations were performed at the Green Bank Telescope (GBT) at 1.4 and 5 GHz and G79.29+046 was observed as target within the project “Unveiling the nature of Galactic Bubbles” (P.I. Trigilio, C.). The sensitivity achieved is 20 mJy beam−1 at 1.4 GHz and 5 mJy beam−1 at 5 GHz, where the beam is respectively(8.4′)2 and (2.4′)2. The field of fiew of the maps, which were obtained running 30 scans on both RA and DEC directions, is 1◦15′at 1.4 GHz and 25′ at 5 GHz. Calibration and imaging processing of the GBT data are not the goal of this work and are described in the PhD thesis of Adriano Ingallinera. The maps are shown in Fig. 2.2 and 2.3. White circles in the figure centre represent position and size of the radio nebula as observed with the EVLA. Black circles in the left bottom corner represent instead the GBT beam.
The GBT maps were reprocessed in this work in order to be comparable to the EVLA maps, as in the following discussion.
2.2 Observations and Data Reduction 35
Figure 2.2: GBT image at 1.4 GHz. The white circle represents size and position of the radio nebula observed with EVLA, while the black one the GBT beam.
Figure 2.3: GBT image at 5 GHz. The white circle represents size and position of the radio nebula observed with EVLA, while the black one the GBT beam.
2.2 Observations and Data Reduction 36
The process of combining single-dish and interferometric data has the advantage to recover the zero baseline (i.e. the largest angular scale visible by a single telescope), but also to maintain the high-resolution provided by the maximum baseline of the interfer-ometer (corresponding to the smallest angular scales resolved and the fine details in the nebula).
Before combining the two datasets, we processed them at the same units. In fact, the GBT map is in unit of the antenna temperature TA. Therefore, first we converted in Jy
beam−1according to the formula
S= TA
G [Jy beam
−1] (2.1)
where the GBT antenna gain is G= 2.84ηA, with the antenna efficiencyηA= 0.72, valid
at both the frequencies 1.4 GHz and 5 GHz (see observing manual for the GBT at www. gb.nrao.edu/gbtprops/man/GBTpg.pdf).
The maps were then rescaled to the same central frequency of the EVLA data (being in origin the GBT central frequencies 1.475 and 5.100 GHz and the EVLA ones 1.391 and 4.959 GHz). This conversion was performed assuming that the emission is almost due to optically thin free-free (α ∼ −0.1), valid assumption in LBVNe. The resulting peak flux density and rms-noise in the maps are: 19.83 Jy beam−1and 10.09 Jy beam−1at 1.4 GHz; 14.27 Jy beam−1 and 10.66 Jy beam−1. The dynamical range in both the maps is limited by the background diffuse emission in the whole area covered by the GBT observations.
The new single-dish maps were then imported into the CASA 3.4 format and pro-cessed together with the EVLA maps at 1.4 and 5 GHz (left and right respectively of bottom panels in Fig. 2.1), using the task feather, which is an algorithm for combin-ing two images with different spatial resolution. It consists in: regrid the low-resolution image to the same grid of the high-resolution image; Fourier transform each image to the gridded visibility plane; sum the gridded visibilities; transform back to the image plane (http://casaguides.nrao.edu/).
The final maps at both the frequencies 1.4 and 5 GHz are shown in Fig. 2.4 and 2.5. As we are interested only in the nebula of G79.29+0.46 we plot a zoom of the maps. In the bottom left corner the black circle represents the size and shape of the interferometric beam. At 1.4 GHz the peak flux density on the nebula is 17.5 mJy beam−1 and the rms-noise is 4.3 mJy beam−1, where we remember that the beam is 26.84”×24.65”. At 5 GHz instead the peak is 3.07 mJy beam−1 and corresponds to the background point-source projected on the nebula in the north-west direction. In this case the rms-noise is about 0.63 mJy beam−1, where the resolution is the synthetic beam obtained with EVLA:D&C configurations.
2.2 Observations and Data Reduction 37
Figure 2.4: Final image at 1.4 GHz, after combining GBT and EVLA im-ages. In the bottom-left corner the synthetic beam (provided by the EVLA maximum baseline) is shown.