doi: 10.3389/fphar.2018.00327
Edited by: M. Foster Olive, Arizona State University, United States Reviewed by: Andrzej Pilc, Institute of Pharmacology (PAN), Poland Víctor Fernández-Dueñas, Universitat de Barcelona, Spain *Correspondence: Luca Ferraro [email protected]
Specialty section: This article was submitted to Neuropharmacology, a section of the journal Frontiers in Pharmacology Received: 29 January 2018 Accepted: 21 March 2018 Published: 05 April 2018 Citation: Beggiato S, Borelli AC, Tomasini MC, Castelli MP, Pintori N, Cacciaglia R, Loche A and Ferraro L (2018) In Vitro Functional Characterization of GET73 as Possible Negative Allosteric Modulator of Metabotropic Glutamate Receptor 5. Front. Pharmacol. 9:327. doi: 10.3389/fphar.2018.00327
In Vitro Functional Characterization
of GET73 as Possible Negative
Allosteric Modulator of Metabotropic
Glutamate Receptor 5
Sarah Beggiato1,2, Andrea C. Borelli1,2, Maria C. Tomasini1,2, M. Paola Castelli3,4,
Nicholas Pintori3, Roberto Cacciaglia5, Antonella Loche5and Luca Ferraro1,2,6* 1Department of Life Sciences and Biotechnology, University of Ferrara, Ferrara, Italy,2IRET Foundation, Bologna, Italy, 3Department of Biomedical Sciences, University of Cagliari, Cagliari, Italy,4Center of Excellence “Neurobiology of Addiction”, University of Cagliari, Cagliari, Italy,5Laboratorio Farmaceutico CT Srl, Sanremo, Italy,6LTTA Centre, University of Ferrara, Ferrara, Italy
The present study was aimed to further characterize the pharmacological profile of N-[4-(trifluoromethyl) benzyl]-4-methoxybutyramide (GET73), a putative negative allosteric modulator (NAM) of metabotropic glutamate subtype 5 receptor (mGluR5) under development as a novel medication for the treatment of alcohol dependence. This aim has been accomplished by means of a series of in vitro functional assays. These assays include the measure of several down-stream signaling [intracellular Ca++levels, inositol
phosphate (IP) formation and CREB phosphorylation (pCREB)] which are generally affected by mGluR5 ligands. In particular, GET73 (0.1 nM–10µM) was explored for its ability to displace the concentration-response curve of some mGluR5 agonists/probes (glutamate, L-quisqualate, CHPG) in different native preparations. GET73 produced a
rightward shift of concentration-response curves of glutamate- and CHPG-induced intracellular Ca++ levels in primary cultures of rat cortical astrocytes. The compound
also induced a rightward shift of concentration response curve of glutamate- and
L-quisqualate-induced increase in IP turnover in rat hippocampus slices, along with a reduction of CHPG (10 mM)-induced increase in IP formation. Moreover, GET73 produced a rightward shift of concentration-response curve of glutamate-, CHPG-and L-quisqualate-induced pCREB levels in rat cerebral cortex neurons. Although the engagement of other targets cannot be definitively ruled out, these data support the view that GET73 acts as an mGluR5 NAM and support the significance of further investigating the possible mechanism of action of the compound.
Keywords: intracellular calcium, CREB, Inositol trisphosphate, alcohol dependence, mGluR5
INTRODUCTION
Alcohol dependence is a chronic relapsing disorder, which continues to be a concerning health and socio-economic issue worldwide (World Health Organization [WHO], 2014). Several national and international health Organizations activated programs aimed at monitoring the burden related to alcohol dependence and at promoting the development of new medical interventions, in order
Abbreviations:IP, inositol phosphate; NAM, negative allosteric modulator; PAM, positive allosteric modulator; pCREB, CREB phosphorylation.
to effectively treat this disorder. In fact, possibly due to the neurobiological complexity and the clinical heterogeneity of alcohol dependence, the effects of the drugs currently approved in the United States for alcohol dependence treatment (i.e., acamprosate, naltrexone, nalmefene and disulfiram) are modest/moderate, both in terms of number needed to treat and effects size (Spanagel, 2009; Swift and Aston, 2015; Goh and Morgan, 2017; Soyka and Müller, 2017). Consequently, there is an urgent medical need for the identification of new pharmacological targets and for the development of new and more effective medications (Leggio et al., 2010;Edwards et al., 2011; Soyka and Lieb, 2015; Mason, 2017; Soyka and Müller, 2017). The development of N-[4-(trifluoromethyl) benzyl]-4-methoxybutyramide (GET73) falls within this context. In preclinical studies this compound has shown the ability to reduce alcohol intake along with anxiolytic-like properties (Loche et al., 2012; Ferraro et al., 2013). Its possible mechanism of action has been related to the modulation of glutamate neurotransmission through the metabotropic glutamate subtype 5 receptor (mGluR5) (Ferraro et al., 2011, 2013; Beggiato et al., 2013), a promising target for the development of pharmacological alcohol dependence treatments (Olive, 2009; Duncan and Lawrence, 2012; Holmes et al., 2013; Goodwani et al., 2017), and for many other psychiatric conditions, such as anxiety and depressive states (Tatarczynska et al., 2001). The results of several Phase 1 clinical studies indicate that GET73 is safe and well-tolerated both in healthy volunteers (Haass-Koffler et al., 2017a,b), and in alcohol-dependent patients (ongoing study NCT01842503)1.
The mechanism of action of GET73 is still under study. This compound did not show affinity for a series of biological targets involved in drug addiction and alcohol dependence, including dopamine, serotonin, GABA, ionotropic glutamate receptors, along with dopamine and serotonin reuptake systems (Loche et al., 2012); despite this negligible binding profile, the compound affected GABA and glutamate neurotransmission in the rat hippocampus (Ferraro et al., 2011;Beggiato et al., 2013). Based on these data, additional studies were addressed to explore the possibility that GET73 could modulate metabotropic glutamate receptor (mGluR) functions, and specifically mGluR5. To this purpose, experiments were performed to evaluate the interaction between GET73 and two mGluR5 ligands, the orthosteric mGluR5 agonist (R,S)-2-chloro-5-hydroxyphenylglycine (CHPG), and the mGluR5 NAM 2-methyl-6-(phenylethynyl) pyridine hydrochloride (MPEP). The results of both in vitro and in vivo microdialysis studies carried out in the rat hippocampus, suggested that GET73 might exert a double negative/positive allosteric modulation at mGluR5. Specifically, low nM concentrations exerted a negative modulation at mGluR5, and a possible amplification of MPEP-induced effects. On the other hand, the GET73-induced increase in glutamate and GABA signaling, exerted at higher µM concentrations, were counteracted by MPEP, suggesting that GET73 might also exert a positive modulation at mGluR5, at least in the model employed for those studies
1http://clinicaltrials.gov/ct2/show/NCT01842503
(Ferraro et al., 2011, 2013; Beggiato et al., 2013). However, the above studies only indirectly suggested the existence of a possible interaction between GET73 and mGluR5.
The present study was aimed at further investigating the interactions between GET73 and mGluR5 by means of a series of in vitro functional assays. Briefly, GET73 was explored for its ability to displace the concentration-response curve of some mGluR5 agonists/probes (glutamate,L-quisqualate, CHPG) on different intracellular signaling molecules/pathways (intracellular Ca++
levels, IP formation and pCREB). GET73 effects were explored in different native systems, including the hippocampus, the brain area extensively explored for the neuropharmacological characterization of the compound.
MATERIALS AND METHODS
Chemicals
Glutamate, the selective mGluR5 agonist (RS)-2-Chloro-5-hydroxyphenylglycine (CHPG) and the AMPA/group I mGluR agonist (L)-(+)- α-Amino-3,5-dioxo-1,2,4-oxadiazolidine-2-propanoic acid (L-quisqualate) were purchased from Tocris (Ballwin, MO, United States). GET73 was synthetized by Laboratorio CT (Sanremo, Italy).
Animals
Adult male Sprague Dawley rats (Charles-River, Milan, Italy) were used in this study. Animals were housed 4 per cage at a temperature of 22◦
C and 60% humidity under a 12-h light/dark cycle (lights on from 7.00 am). Tap water and standard laboratory rodent chow (Mucedola, Settimo Milanese, Italy) were provided ad libitum in the home cage. The experimental protocols performed in this study were in accordance with the new European Communities Council Directive of September 2010 (2010/63/EU) a revision of the Directive 86/609/EEC and were approved by the Italian Ministry of Health and by the Ethical Committee of the University of Ferrara (D.M. n◦
104/2017).
Calcium Mobilization Experiments
The experiments have been performed on primary cultures of rat cortical astrocytes. These cells express mGlu5Rs (Zhang et al., 2005).
Primary Cultures of Rat Cortical Astrocyte Preparation
Primary cultures of cerebral cortical astrocytes were obtained from newborn rats (1 or 2 days old). Briefly, cerebral cortices were removed and dissociated by mild trypsinization at 37◦
C, followed by mechanical trituration to obtain single cells. Cells were suspended in the culture medium [Gibco R
DMEM, 5% inactivated fetal bovine serum (Thermo-Fisher Scientific, Waltham, MA, United States), 100 IU/ml penicillin, and 100µg/ml streptomycin (all from Sigma-Aldrich, Milan, Italy)] and then seeded in 75-cm2flasks at a density of 3 × 10⁶cells/flask. The cells were incubated at 37◦
C in a humidified atmosphere, 5% CO2/95% air. The culture medium was replaced after 24 h and again twice weekly until astrocytes were grown to form a
monolayer firmly attached to the bottom of the flask (12 or 14 days after dissection). At cell confluence, flasks were vigorously shaken to separate astrocytes (which remained adherent in the bottom of the flasks) from microglia and oligodendrocytes (which floated on the supernatant) (Tomasini et al., 2015). Collected astrocytes were counted and then plated in poly-L-lysine at a density of 50,000 cells/well or 96-well plates black, clear bottom plates (Corning R
; Sigma-Aldrich, Milan, Italy).
Calcium Mobilization Measurement
After 24 h of incubation, the cells were loaded with Hank’s Balanced Salt Solution (HBSS) supplemented with 2.5 mM probenecid (Sigma-Aldrich, Milan, Italy), 3µM of the calcium sensitive fluorescent dye Fluo-4 AM (Thermo-Fisher Scientific, Waltham, MA, United States), 0.01% pluronic acid and 20 mM HEPES (pH 7.4; Sigma-Aldrich, Milan, Italy) for 30 min at 37◦
C. Afterwards the loading solution was aspirated, a washing step with 100 µl/well of HBSS, HEPES (20 mM, pH 7.4), 2.5 mM probenecid and 500µM Brilliant Black (Sigma-Aldrich, Milan, Italy) was carried out. Subsequently 100 µl/well of the same buffer were added for 10 min. Concentrated solutions of ligands (i.e., glutamate, L-quisqualate, CHPG and GET73) were freshly prepared and serial dilutions were made in HBSS/HEPES (20 mM) buffer (containing 0.02% BSA fraction V). After placing cell culture and compound plates into the FlexStation II (Molecular Devices, Sunnyvale, CA, United States), the on-line additions were carried out in a volume of 50 µl /well and fluorescence changes were continuously measured for 2 min at 37◦
C. The calcium peak level has been then selected to evaluate the effects of treatments.
Inositol Phosphate Turnover
Experiments
The experiments have been performed on rat hippocampus slices. This preparation expresses mGlu5Rs (Zhang et al., 2005;Purgert et al., 2014).
Rat Hippocampal Slices
On the day of the experiment, the animals were euthanized, their brain promptly isolated and 400µm thick slices (15–20 mg each) were obtained from both the left and right hippocampi, by using a McIlwain tissue Chopper fresh tissue. The tissue was then allowed to equilibrate for 20 min at room temperature in Krebs’ solution (composition in mM: NaCl 118; KC1 4.4; CaC121.2; MgS041.2; KH2P041.2; NaHC0325; glucose 10) and gassed with a mixture of 95% O2 plus 5% CO2 (Ferraro et al., 2011).
Measurements of Inositol Phosphate Turnover in Rat Hippocampus Slices
Slices were placed in test tubes containing 0.3 ml of oxygenated Krebs solution with myo-[3H]inositol 0.3 µM (NEN, Boston, MA, United States). After 30 min of incubation, glutamate receptor agonists (i.e., glutamate, L-quisqualate, CHPG) were added and the incubation was prolonged for a further 30 min period (Morari et al., 1994). The concentration-response curves of glutamate receptor agonists were assessed in the absence or
in the presence of different concentrations of GET73, incubated 15 min before the addition of glutamate receptor agonists. The reaction was stopped by washing each slice in ice cold Krebs solution containing LiCl 10 mM and by plunging it in 0.94 ml of chloroform-methanol (1:2 v/v). After 10 min, 310 µl of chloroform and 310µl of water were added and the tubes were shaken for 20 min. The separation of [3H]inositol phosphates was performed by ion-exchange chromatography on AG 1-X8 resin, 200–400 mesh (Bio-Rad, Hercules, CA, United States), using different elution solutions. The collected IP3-containing fraction was mixed with Safety-Solve cocktail (RPI, Mount Prospect, IL, United States) and the radioactivity was measured by scintillation counting.
pCREB Experiments
The experiments have been performed on primary cultures of rat cortical neurons. These cells express mGlu5Rs (Koga et al., 2010).
Primary Cultures of Rat Cortical Neuron Preparation
Primary cultures of cerebral cortical neurons were prepared from 1-day-old rats. Cortices free of meninges were dissociated in 0.025% (w/v) trypsin at 37◦
C followed by mechanical repeated gentle pipetting through wide- and narrow-bore fire-polished Pasteur pipettes in culture medium [Neurobasal medium (Gibco, Grand Island, NY, United States) supplemented with 0.1 mM glutamine (Sigma-Aldrich, Milan, Italy), 10 µg/ml gentamicin (Sigma-Aldrich, Milan, Italy) and 2% B-27 R
Supplement (50X), serum free (Gibco, Grand Island, NY, United States)]. Cells were counted and then plated on poly-L-lysine (5µg/ml)-coated
multiwells. Cytosine arabinoside (10µM; Sigma-Aldrich, Milan, Italy) was added within 24 h of plating to prevent glial cell proliferation. After 8 days ofin vitro incubation (days in vitro: DIV), cultures were used for experiments.
pCREB Measurement
pCREB measurement was performed with the pCREB (Ser133) Assay kit (PerkinElmer Italy, Milan). Briefly, cortical neurons were seeded in 96 well tissue culture plates at a density of 4,000 cells/well and incubated at 37◦
C overnight. Thereafter, the concentration-response curves of glutamate receptor agonists (i.e., glutamate, L-quisqualate, CHPG) were assessed in the
absence or in the presence of GET73. Briefly, the cells were incubated for 1 h with the glutamate receptor agonists, lysed with the freshly prepared lysis buffer. When required, GET73 was applied at different concentrations 15 min before the addition of glutamate receptor agonists. The lysates were transferred to a 96-well 1/2AreaPlateTM for the assay. The Acceptor Mix was
added for 1 h at room temperature and the Donor mix was added to wells under subdue light and incubate for 1 h at room temperature. At the end of this period, raw “AlphaScreen Signal counts” were measured by an Alpha Technology R
-compatible plate reader, using standard AlphaLISA settings (excitation 680 nm, emission 615 nm).
Data Analysis
EC50 values were calculated using non-linear regression [curve fit, log(agonist) vs. response, variable slope, four parameters].
Statistical analysis (F-test) has been performed by using GraphPad Prism 6.0 (GraphPad Software Inc., San Diego, CA, United States). Statistical differences between group means for EC50 values were also assessed by ANOVA followed by Tukey’s multiple comparisons test. Data are reported as mean ± SEM of three independent experiments. Ap-value< 0.05 was considered statistically significant.
RESULTS
Calcium Mobilization Experiments
Agonistic Effects
As expected, glutamate,L-quisqualate and CHPG concentration-dependently induced calcium transient in primary cultures of rat cortical astrocytes. The profiles of the concentration-response curves were in line with the known EC50values of the compounds (Figure 1A and Table 1;Acher, 2006). On the contrary, GET73 (0.1 nM–10µM) was ineffective (Figure 1B).
Effects of GET73 on Glutamate
Concentration-Response Curve in Primary Cultures of Rat Cortical Astrocytes
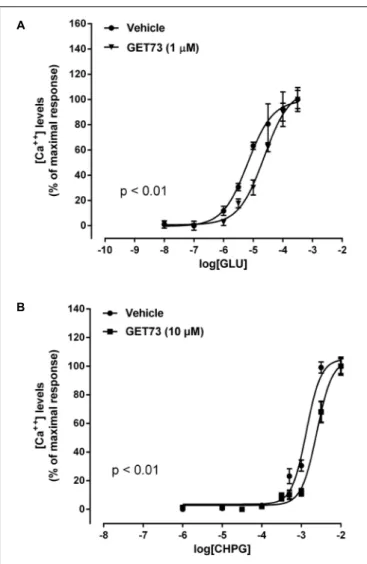
The concentration-response curves for glutamate were performed either in the absence or presence of GET73 (see
Figure 2A, GET73 1 µM, as an example); GET73 (10 nM–
10 µM) induced a significant rightward shift of glutamate concentration-response curve in primary cultures of rat cortical astrocytes (Supplementary Figure 1), thus increasing the glutamate EC50 value (Table 1) without a substantial change in the maximal response. The analysis of the apparent EC50values revealed a bell-shaped profile; in fact the maximum effect was observed at 10 nM, while the effects of higher concentrations (100 nM, 1 µM, 10 µM) were similar but lower than the
maximum one. At lower concentrations (0.1 and 1 nM), GET73 was ineffective.
Effects of GET73 on CHPG Concentration-Response Curve in Rat Cortical Astrocytes
The concentration-response curves for CHPG were performed either in the absence or presence of GET73 (see Figure 2B, GET73 10 µM, as an example). GET73, at all concentrations tested (0.1 nM–10 µM), induced a significant rightward shift of the CHPG concentration-response curve in primary cultures of rat cortical astrocytes (Supplementary Figure 2 and Table 1 for EC50 values), without a substantial change in the maximal response. The analysis of the apparent EC50values revealed a bell-shaped profile; in fact the maximum effect was observed at 1 and 10 nM, while at higher concentrations (100 nM, 1µM, 10 µM) the compound induced similar effects that were significantly higher than that observed at 0.1 nM concentration, but lower than the maximum one.
Effects of GET73 onL-quisqualate
Concentration-Response Curve in Rat Cortical Astrocytes
The concentration-response curves for L-quisqualate were performed either in the absence or presence of GET73. At all concentrations tested (0.1 nM–10 µM) GET73 failed to significantly modify the L-quisqualate concentration-response curve in primary cultures of rat cortical astrocytes (Supplementary Figure 3 and Table 1).
Phosphatidylinositol Turnover in Rat
Hippocampus Slices
Agonistic Effects
As expected, glutamate and L-quisqualate
concentration-dependently increased phosphatidylinositol turnover in rat
FIGURE 1 | (A) Glutamate receptor agonist concentration-response curves in primary cultures of rat cortical astrocytes. The effects of the treatments on intracellular calcium levels are expressed as % of maximal response over the basal values. The EC50values were:L-quisqualate (QA) = 3.1 ± 0.36 nM; glutamate
(GLU) = 6.5 ± 0.44µM; (RS)-2-Chloro-5-hydroxyphenylglycine (CHPG) = 1.3 ± 0.09 mM. Concentration-response curves were generate using non-linear regression [curve fit, log(agonist) vs. response, variable slope, four parameters]. (B) Effects of GET73 (0.1 nM–10µM) on intracellular calcium levels in primary cultures of rat cortical astrocytes. The effects of the treatment are expressed as % of glutamate maximal response over the basal values. Each point represents the mean ± SEM (n = 3).
TABLE 1 | EC50values obtained with glutamate, CHPG orL-quisqualate in the absence or in the presence of GET73 (0.1 nM–10µM) by evaluating intracellular calcium levels in primary cultures of rat cortical astrocytes.
Agonist GET73 (concentration) EC50
Glutamate 0 6.5 ± 0.44µM 0.1 nM 9.0 ± 0.51µM 1 nM 7.8 ± 0.36µM 10 nM 40 ± 2.8µM∗ ∗ ◦ ◦ 100 nM 21 ± 1.4µM∗ ∗ 1µM 24 ± 1.7µM∗ ∗ 10µM 16 ± 0.54µM∗ ∗ CHPG 0 1.3 ± 0.09 mM 0.1 nM 2.0 ± 0.13 mM∗ ◦ 1 nM 3.8 ± 0.28 mM∗ ∗ ◦ ◦§ 10 nM 3.6 ± 0.37 mM∗ ∗ ◦ ◦§ 100 nM 2.7 ± 0.22 mM∗ ∗ 1µM 2.8 ± 0.18 mM∗ ∗ 10µM 2.6 ± 0.24 mM∗ ∗ L-quisqualate 0 3.1 ± 0.36 nM 0.1 nM 2.9 ± 0.45 nM 1 nM 3.5 ± 0.69 nM 10 nM 3.3 ± 0.55 nM 100 nM 3.2 ± 0.62 nM 1µM 3.6 ± 0.54 nM 10µM 3.6 ± 0.63 nM
Results are expressed as mean ± SEM of 3 independent experiments. EC50values
were calculated using non-linear regression [curve fit, log(agonist) vs. response, variable slope, four parameters]. Statistical differences between group means for EC50 values were also assessed by ANOVA followed by Tukey’s multiple
comparisons test. Glutamate =∗p< 0.05,∗ ∗p< 0.01, significantly different from
the control (i.e., GET73 0 concentration), GET73 0.1 and 1 nM groups;◦
p< 0.05,
◦ ◦p< 0.01, significantly different from the GET73 100 nM, 1 µM, and 10 µM
groups; CHPG =∗
p< 0.05,∗ ∗
p< 0.01, significantly different from the control (i.e., GET73 0 concentration);◦p< 0.05,◦ ◦p< 0.01, significantly different from the
GET73 100 nM, 1µM, and 10 µM groups;§p< 0.05 significantly different from
the GET73 0.1 nM group.
hippocampal slices (Figure 3A). Under the present experimental conditions, the resulting EC50 values were higher than the known EC50 values of the compounds (Acher, 2006) as well as than those observed by evaluating the effects of the compounds on intracellular calcium (Figure 1A). On the contrary, CHPG (0.01–10 mM) significantly increased phosphatidylinositol turnover only at the higher concentration tested (127 ± 4% of basal levels;p< 0.05; Figure 3A). GET73, at all concentrations tested (0.1 nM–100 µM), failed to modify phosphatidylinositol turnover in rat hippocampal slices (Figure 3B).
Effects of GET73 on Glutamate
Concentration-Response Curve in Rat Hippocampus Slices
The concentration-response curves for glutamate were performed either in the absence or presence of GET73 (see Figure 4A, GET73 100 nM, as an example). At the concentrations of 100 nM–10µM GET73 induced a significant rightward shift of the glutamate concentration-response curve in rat hippocampus slices (Supplementary Figure 4) thus increasing the EC50 value (Table 2). The analysis of the
FIGURE 2 | Effects of GET73 on glutamate (GLU; A) and
(RS)-2-Chloro-5-hydroxyphenylglycine (CHPG;B) concentration-dependent increase in intracellular calcium levels in primary cultures of rat cortical astrocytes. The effects of the treatments on intracellular calcium levels are expressed as % of maximal response over the basal values. Each point represents the mean ± SEM (n = 3). Concentration-response curves were generate using non-linear regression [curve fit, log(agonist) vs. response, variable slope, four parameters].
apparent EC50 values revealed a bell-shaped profile; in fact the maximum effect was observed at 100 nM, while the effects of the lower 10 nM concentration and the higher 1 and 10 µM concentrations were similar, but lower than the maximum one. At lower concentrations (0.1 and 1 nM), GET73 was ineffective.
Effects of GET73 onL-quisqualate
Concentration-Response Curve in Rat Hippocampus Slices
The concentration-response curves for L-quisqualate were performed either in the absence or presence of GET73 (see
Figure 4B, GET73 100 nM, as an example). At the concentration
FIGURE 3 | (A) Concentration-dependent increases of phosphatidylinositol turnover (IP3) induced by glutamate receptor agonist in rat hippocampus slices.
The EC50values were:L-quisqualate (QA) = 40 ± 2.37µM; glutamate (GLU) = 0.68 ± 0.06 mM. Concentration-response curves were generate using non-linear
regression [curve fit, log(agonist) vs. response, variable slope, four parameters]. CHPG = (RS)-2-Chloro-5-hydroxyphenylglycine. (B) Effects of GET73
(0.1 nM–10µM) of phosphatidylinositol turnover (IP3) in rat hippocampus slices. Results are expressed as % of basal levels, always assessed in parallel. Each point
represents the mean ± SEM (n = 3).
shift of the L-quisqualate concentration-response curve in rat hippocampus slices (Supplementary Figure 5 and Table 2 for EC50 values), without substantially changing the maximal response. The analysis of the apparent EC50values revealed a bell-shaped profile; in fact the effect of the compound concentration-dependently increase in the concentration range of 10 nM–1µM, while at the higher concentration tested (10µM) the compound induced an increase in glutamate EC50value which was lower to that induced by GET73 1µM, and comparable to GET73 100 nM-provoked effect. Finally, at lower concentrations (0.1 and 1 nM), GET73 was ineffective.
Effects of GET73 on CHPG-Induced Alterations of IP3
Levels in Rat Hippocampus Slices
At the concentrations of 100 nM, 1 µM and 10 µM, GET73 induced a significant reduction of CHPG (10 mM)-induced increase in phosphatidylinositol turnover in rat hippocampus slices (Figure 5). At lower concentrations (0.1–10 nM), GET73 was ineffective.
CREB Phosphorylation Experiments
Agonistic Effects
Preliminary experiments indicated that in primary cultures of rat cortical astrocytes the glutamate-, L-quisqualate- or CHPG-induced pCREB levels were very low (data not shown). This is in line with previous published results (Mao and Wang, 2002, 2003). Thus, the experiments on pCREB levels were performed in cerebral cortex neurons.
As expected, glutamate, L-quisqualate and CHPG caused concentration-dependent increases in pCREB levels (Figure 6A). The profiles of the concentration-response curves were in line with the known EC50values of the compounds and comparable to those observed by evaluating the effects of the glutamate
receptor agonist on intracellular calcium levels (Figure 1A; Acher, 2006). On the contrary, GET73 (0.1 nM–10 µM) was ineffective (Figure 6B).
Effects of GET73 on Glutamate
Concentration-Response Curve in Primary Cultures of Rat Cortical Neurons
The concentration-response curves for glutamate were performed either in the absence or presence of GET73 (see
Figure 7A, GET73 1 µM, as an example). GET73 (10 nM–
10 µM) induced a significant rightward shift of the glutamate concentration-response curve in primary cultures of rat cortical neurons, thus increasing the EC50value (Supplementary Figure 6 and Table 3 for EC50 values) without substantially changing the maximal response. The analysis of the apparent EC50values revealed a bell-shaped profile; in fact the effect of the compound concentration-dependently increase in the concentration range of 10 nM–1 µM, while at the higher concentration tested (10 µM) the compound induced an increase in glutamate EC50 value which was lower to that induced by GET73 1µM, and comparable to GET73 100 nM- provoked effect. Finally, at lower concentrations (0.1 and 1 nM), the compound was ineffective.
Effects of GET73 on CHPG Concentration-Response Curve in Primary Cultures of Rat Cortical Neurons
The concentration-response curves for CHPG were performed either in the absence or presence of GET73 (see Figure 7B, GET73 10 µM, as an example). GET73 (100 nM–10 µM) induced a significant rightward shift of the CHPG concentration-response curve in primary cultures of rat cortical neurons (Supplementary Figure 7 and Table 3 for EC50 values), without substantially changing the maximal response. The analysis of
FIGURE 4 | Effects of GET73 (100 nM) on glutamate (GLU; A) and L-quisqualate (QA; B) concentration-dependent increase of
phosphatidylinositol turnover (IP3) in rat hippocampus slices. Results are
expressed as % of basal levels, always assessed in parallel. Each point represents the mean ± SEM (n = 3). Concentration-response curves were generate using non-linear regression [curve fit, log(agonist) vs. response, variable slope, four parameters].
the apparent EC50 values revealed a bell-shaped profile; in fact the maximum effect was observed at 100 nM, while at higher concentrations (1 and 10 µM) the effects of the compound were progressively lower than the maximum one. At lower concentrations (0.1–10 nM), the compound was ineffective.
Effects of GET73 onL-quisqualate
Concentration-Response Curve in Primary Cultures of Rat Cortical Neurons
The concentration-response curves for L-quisqualate were performed either in the absence or presence of GET73 (see
Figure 7C, GET73 10 µM, as an example). GET73 at the
concentrations of 1 and 10µM induced a significant rightward shift of the L-quisqualate concentration-response curve in primary cultures of rat cortical neurons (Supplementary Figure 8 and Table 3 for EC50 values), without substantially changing
TABLE 2 | EC50values obtained with glutamate orL-quisqualate in the absence or in the presence of GET73 (0.1 nM–10µM) by evaluating phosphatidylinositol turnover in rat hippocampus slices.
Agonist GET73 (concentration) EC50
Glutamate 0 0.68 ± 0.06 mM 0.1 nM 0.76 ± 0.07 mM 1 nM 0.90 ± 0.07 mM 10 nM 3.0 ± 0.24 mM∗∗ 100 nM 5.0 ± 0.29 mM∗∗◦◦ 1µM 2.3 ± 0.33 mM∗∗ 10µM 3.2 ± 0.42 mM∗∗ L-quisqualate 0 40 ± 2.37 µM 0.1 nM 33 ± 1.57 µM 1 nM 40 ± 1.44 µM 10 nM 110 ± 9.5 µM∗∗ 100 nM 200 ± 11.1 µM∗∗§ 1µM 320 ± 15.7 µM∗∗◦◦§ 10µM 200 ± 12.6 µM∗∗§
EC50 values were calculated using non-linear regression [curve fit, log(agonist)
vs. response, variable slope, four parameters]. Statistical differences between group means for EC50 values were also assessed by ANOVA followed by
Tukey’s multiple comparisons test. Glutamate =∗ ∗
p< 0.01, significantly different from the control (i.e., GET73 0 concentration), GET73 0.1 and 1 nM groups;
◦ ◦
p< 0.01, significantly different from the GET73 10 nM, 1 µM and 10 µM groups; L-quisqualate =∗ ∗
p< 0.01, significantly different from the control (i.e., GET73 0 concentration), GET73 0.1 and 1 nM groups;◦ ◦p< 0.01, significantly different from
the GET73 100 nM and 10µM groups;§p< 0.05 significantly different from the
GET73 10 nM group.
the maximal response. The analysis of the apparent EC50values revealed a bell-shaped profile; in fact the maximum effect was observed at 1µM, while at the higher concentration (10 µM) the effect of the compound was lower than the maximum one. At lower concentrations (0.1–100 nM), the compound was ineffective.
DISCUSSION
It has been formerly demonstrated that GET73 does not show affinity for a series of biological targets involved in drug addiction, including dopamine, serotonin, GABA, ionotropic glutamate receptors, along with dopamine and serotonin reuptake systems (Loche et al., 2012). Despite this negligible binding profile, the results of both in vitro (tissue slices) and in vivo microdialysis studies carried out in the rat hippocampus suggested that GET73 affects GABA and glutamate neurotransmission probably exerting a double negative/positive allosteric modulation at mGluR5. Specifically, low nanomolar GET73 concentrations seemed to exert a negative modulation at mGluR5, and a possible amplification of MPEP-induced effects. On the other hand, the effects of higher (i.e., µM) GET73 concentrations were counteracted by MPEP, suggesting that the compound might also exert a positive modulation at mGluR5 (Ferraro et al., 2011, 2013; Beggiato et al., 2013). Relevantly, the postulated ability of GET73 to negatively modulate mGluR5 may likewise explain, at least partially, its efficacy in reducing rat alcohol intake,
FIGURE 5 | Effects of GET73 (0.1 nM–10µM) on CHPG (10 mM)-induced increase of phosphatidylinositol turnover (IP3) in rat hippocampus slices.
Results are expressed as % of basal levels and each histogram represents the mean ± SEM of 3 experiments.∗p< 0.05;∗ ∗p< 0.01 significantly different
from vehicle group according to ANOVA followed by Tukey test for multiple comparisons.
as shown for several other compounds acting as NAM at mGluR5 (Olive, 2009; Duncan and Lawrence, 2012; Ferraro et al., 2013; Holmes et al., 2013; Mihov and Hasler, 2016; Goodwani et al., 2017). However, the above studies only indirectly suggested the existence of a possible interaction between GET73 and mGluR5. Thus, in the present study, functional evaluations have been performed to more directly
proving that GET73 can modulate mGluR5 activity. The measurement of different parameters and the use of different in vitro preparations (i.e., primary cultures of cerebral cortex astrocytes or neurons, along with hippocampal slices) is justified by the evidence that agonism by PAMs and inhibition of the maximal response to glutamate by certain NAMs differed depending on receptor expression levels and the assays of receptor function (Kenakin, 2009; Gregory et al., 2012; Gregory and Conn, 2015). In particular, increasing evidence suggests that allosteric ligands can exhibit biased modulation of the orthosteric agonist, thus displaying phenotypic differences in their pharmacology on different intracellular pathways (Khoury et al., 2014; Rook et al., 2015; Nickols et al., 2016; Kenakin, 2017). Thus, the present study has been designed to cope with these critical features of allosteric modulation at GPCRs (i.e., probe-, pathway-, and system-dependence), also in order to reduce the risk of false negatives that always exists when only a single functional assay is performed (Conn et al., 2009; Gregory et al., 2012; Gregory and Conn, 2015). Taking into account these issues, the possible ability of GET73 to shift the concentration-response curves of different agonists/probes (i.e., glutamate,L-quisqualate, CHPG) on different intracellular pathways associated with mGluR5 activation (i.e., Ca++
levels, IP turnover and pCREB levels; Wang et al., 2007) and in different in vitro preparations (including the hippocampus, the brain area extensively explored for the neuropharmacological characterization of GET73), has been evaluated. Remarkably, the measure of mGluR5 agonist concentration-response curve displacement allow to detect both negative and positive modulation, providing a valuable approach for the characterization of a compound, such as GET73, that might exert either a negative or a positive modulation, depending
FIGURE 6 | (A) Concentration-dependent increases in phosphorylated CREB (pCREB) levels induced by glutamate receptor agonist in primary cultures of rat cortical neurons. The effects of the treatments on pCREB levels are expressed as % of maximal response over the basal values. The EC50values were:
L-quisqualate (QA) = 8.8 ± 0.68 nM; glutamate (GLU) = 9.7 ± 0.78µM; (RS)-2-Chloro-5-hydroxyphenylglycine (CHPG) = 1.0 ± 0.09 mM. Concentration-response curves were generate using non-linear regression [curve fit, log(agonist) vs. response, variable slope, four parameters]. (B) Effects of GET73 (0.1 nM–10µM) on phosphorylated CREB (pCREB) levels in primary cultures of rat cortical neurons. The effects of the treatment are expressed as % of glutamate maximal response over the basal values. Each point represents the mean ± SEM (n = 3).
TABLE 3 | EC50values obtained with glutamate, CHPG orL-quisqualate in the absence or in the presence of GET73 (0.1 nM–10µM) by evaluating pCREB levels in cerebral cortex neurons.
Agonist GET73 (concentration) EC50
Glutamate 0 9.7 ± 0.78 µM 0.1 nM 10 ± 0.88 µM 1 nM 10 ± 0.64 µM 10 nM 25 ± 1.41 µM∗∗ 100 nM 35 ± 1.53 µM∗∗§ 1µM 45 ± 1.39 µM∗∗◦◦§ 10µM 31 ± 1.34 µM∗∗ CHPG 0 1.0 ± 0.09 mM 0.1 nM 1.0 ± 0.08 mM 1 nM 0.9 ± 0.04 mM 10 nM 1.4 ± 0.12 mM 100 nM 5.0 ± 0.29 mM∗∗◦◦§§ 1µM 3.6 ± 0.34 mM∗∗§ 10µM 2.6 ± 0.28 mM∗∗ L-quisqualate 0 8.8 ± 0.68 nM 0.1 nM 9.0 ± 0.91 nM 1 nM 7.4 ± 0.66 nM 10 nM 8.5 ± 0.52 nM 100 nM 11 ± 0.96 nM 1µM 22 ± 1.72 nM∗∗◦ 10µM 16 ± 0.44 nM∗∗
EC50values were calculated using non-linear regression [curve fit, log(agonist) vs.
response, variable slope, four parameters]. Statistical differences between group means for EC50values were also assessed by ANOVA followed by Tukey’s multiple
comparisons test. Glutamate =∗ ∗
p< 0.01, significantly different from the control (i.e., GET73 0 concentration), GET73 0.1 and 1 nM groups;◦ ◦p< 0.01, significantly
different from the GET73 100 nM and 10µM groups;§p< 0.05 significantly
different from the GET73 10 nM group; CHPG = ∗ ∗p < 0.01, significantly
different from the control (i.e., GET73 0 concentration), GET73 0.1, 1 nM and 10 nM groups;◦ ◦p< 0.01, significantly different from the GET73 1 µM group; §p< 0.05,§§p< 0.01 significantly different from the GET73 10 nM group;L
-quisqualate =∗ ∗p< 0.01, significantly different from the control (i.e., GET73 0
concentration), GET73 0.1, 1, 10, and 100 nM groups;◦
p< 0.05, significantly different from the GET73 10µM group.
on its concentration (Ferraro et al., 2011, 2013;Beggiato et al., 2013).
The present results suggest that GET73 induces a rightward shift of different glutamate receptor agonist concentration-response curves, possibly by acting as a NAM at mGluR5. Under some experimental conditions, the maximal effect of GET73 was observed in the nanomolar concentration range, thus suggesting a satisfactory potency of the compound in modulating mGluR5 signaling. However, the resulting potency of the compound, as well as its efficacy, differs among the different probe/assays. This is in line with the concept of GPCR-biased signaling, which has been also previously associated with mGluR5 allosteric modulation. For instance, the mGluR5 NAM M-5MPEP has been suggested to have differential negative cooperativity, partially inhibiting agonist-stimulated [3H]IP accumulation and completely blocking agonist-stimulated Ca++
oscillations (Bradley et al., 2011). Furthermore, the mGluR5 NAM VU0477573 only partially inhibited agonist-mediated intracellular Ca++
release and fully
FIGURE 7 | Effects of GET73 (1 or 10µM) on glutamate (GLU; A), (RS)-2-Chloro-5-hydroxyphenylglycine (CHPG;B) andL-quisqualate (QA; C) concentration-dependent increase in phosphorylated CREB (pCREB) levels in primary cultures of rat cortical neurons. The effects of the treatments are expressed as % of maximal response over the basal values. Each point represents the mean ± SEM (n = 3). Concentration-response curves were generate using non-linear regression [curve fit, log(agonist) vs. response, variable slope, four parameters].
inhibited ERK1/2 phosphorylation (Nickols et al., 2016). These GPCR ligand features could also explain the observation that GET73 was able to shift the L-quisqualate CRC on pCREB and phosphatidylinositol turnover, but not on intracellular Ca++ levels. Finally, the present data indicate that the effects of GET73 were lower at higher than at lower concentrations. Although other possibilities cannot be ruled out, this observation could be in line with previous data suggesting that at higher concentrations GET73 might also exert a positive modulation at mGluR5 (Ferraro et al., 2011, 2013; Beggiato et al., 2013), thus dampening the negative effects observed at lower concentrations.
Another relevant finding of the present study is that the negative modulatory action of GET73 on mGluR5 ligand affinity is surmountable with respect to the agonist (i.e., the agonist produces the control maximal response). Thus, it seems likely that the compound could act as a surmountable allosteric modulator [i.e., allosteric modulators presenting a limiting value to the maximal displacement (Kenakin, 2009)]. However, further experiments are needed to confirm this hypothesis. Finally, the evidence that in the functional studies performed with different assays, GET73 (0.1 nM–10 µM) by itself did not exert any effects, indicates that the compound does not act as an agonist of mGluR5 or other glutamate receptor subtypes.
Although the in vitro preparations used in this study (i.e., cultured astrocytes or neurons, hippocampal slices) also express other glutamate receptor subtypes, the involvement of mGluR5 in the observed effects could be hypothesized. In fact, (i) GET73 negatively modulates the concentration-response curves of CHPG, which is a selective mGluR5 agonist (Doherty et al., 1997); (ii) all the analyzed intracellular pathways are associated with mGluR5 activation; (iii) previous studies demonstrated that GET73 does not act by modulating NMDA receptor function (Ferraro et al., 2011) and does not display affinity for ionotropic glutamate receptors (Loche et al., 2012).
The mGluR5 NAMs have reached or are now in active preclinical and clinical studies to evaluate the efficacy for several disorders, including alcohol use disorders (Ferraro et al., 2013; Mihov and Hasler, 2016). Despite encouraging results, both clinical and preclinical studies suggest that mGluR5 NAMs may induce on-target adverse effects, including cognitive and memory impairments and psychotomimetic effects (Campbell et al., 2004; Porter et al., 2005; Rodriguez et al., 2010; Abou Farha et al., 2014), raising the question of whether complete blockade of mGluR5 may contribute to these deleterious effects, thereby limiting the therapeutic utility of mGlu5 NAMs. On the other hand, according with Nickols et al. (2016) and Yang et al. (2016), a dramatic shift in the orthosteric agonist concentration-response curve is not necessarily a positive feature. For example, mGluR5 PAMs characterized by high potency in shifting the glutamate concentration-response curve, induce convulsions and neurotoxicity (Yang et al., 2016), while compounds possessing a lower efficacy show a safer profile, without losing in vivo behavioral activity.
Analogous evidence indicates that full mGluR5 NAMs show a worse safety profile in respect to the partial NAMs (i.e., compounds that only partially block maximal mGlu5-mediated responses at concentrations that fully occupy the allosteric site on mGluR5; Nickols et al., 2016). Thus the properties displayed by GET73 in the present study, according with the recent literature, can be considered positive in terms of safety profile of the compound. In line with this view, no signs of neurotoxicity were observed in hippocampal neurons exposed to GET73 at concentrations ranging from 0.1 to 10 µM (Tomasini et al., 2016). More importantly, GET73 did not induce any CNS side effects in the two Phase I clinical trials completed so far in healthy volunteers (Haass-Koffler et al., 2017a; EudraCT registry number: 2011-002354-31), and in the ongoing Phase 1b/2a study in alcohol dependent subjects (Study 73CT203)2.
CONCLUSION
Although further experiments are needed to explore GET73 binding at the orthosteric and/or allosteric sites on mGluR5, these data support the view that the compound acts as an mGluR5 NAM with a promising profile of action. Therefore, the present observations lend additional support to the significance of further investigating the possible mechanism of action of GET73.
AUTHOR CONTRIBUTIONS
SB, AB, MT, and NP contributed to calcium mobilization, phosphatidylinositol, and pCREB experiments, including the acquisition, analysis, and interpretation of data. LF participated in the above studies and drafted and revised the paper. MPC, AL, and RC contributed to revision of the paper.
FUNDING
The work was supported by Laboratorio Farmaceutico CT Srl, Sanremo (IM), Italy.
ACKNOWLEDGMENTS
The authors thank Dr. F. Ferrari for the technical support in performing calcium mobilization experiments.
SUPPLEMENTARY MATERIAL
The Supplementary Material for this article can be found online at: https://www.frontiersin.org/articles/10.3389/fphar. 2018.00327/full#supplementary-material
REFERENCES
Abou Farha, K., Bruggeman, R., and Baljé-Volkers, C. (2014). Metabotropic glutamate receptor 5 negative modulation in phase I clinical trial: potential impact of circadian rhythm on the neuropsychiatric adverse reactions-do hallucinations matter?ISRN Psychiatry 2014:652750. doi: 10.1155/2014/652750 Acher, F. C. (2006).Metabotropic Glutamate Receptors – Molecular Pharmacology. Tocris Bioscience Scientific Review. Available at: https://www.tocris.com/ pharmacology/glutamate-metabotropic-receptors
Beggiato, S., O’Connor, W. T., Tomasini, M. C., Antonelli, T., Loche, A., Tanganelli, S., et al. (2013). GET73 increases rat extracellular hippocampal CA1 GABA levels through a possible involvement of local mGlu5 receptor.Synapse 67, 678–691. doi: 10.1002/syn.21672
Bradley, S. J., Langmead, C. J., Watson, J. M., and Challiss, R. A. (2011). Quantitative analysis reveals multiple mechanisms of allosteric modulation of the mGlu5 receptor in rat astroglia.Mol. Pharmacol. 79, 874–885. doi: 10.1124/ mol.110.068882
Campbell, U. C., Lalwani, K., Hernandez, L., Kinney, G. G., Conn, P. J., and Bristow, L. J. (2004). The mGluR5 antagonist 2-methyl-6-(phenylethynyl)-pyridine (MPEP) potentiates PCP-induced cognitive deficits in rats. Psychopharmacology (Berl.) 175, 310–318. doi: 10.1002/glia.20783
Conn, P. J., Christopoulos, A., and Lindsley, C. W. (2009). Allosteric
modulators of GPCRs: a novel approach for the treatment of
CNS disorders. Nat. Rev. Drug Discov. 8, 41–54. doi: 10.1038/
nrd2760
Doherty, A. J., Palmer, M. J., Henley, J. M., Collingridge, G. L., and Jane, D. E. (1997). (RS)-2-chloro-5-hydroxyphenylglycine (CHPG) activates mGlu5, but no mGlu1, receptors expressed in CHO cells and potentiates NMDA responses in the hippocampus.Neuropharmacology 36, 265–267. doi: 10.1038/nrd2760 Duncan, J. R., and Lawrence, A. J. (2012). The role of metabotropic glutamate
receptors in addiction: evidence from preclinical models.Pharmacol. Biochem. Behav. 100, 811–824. doi: 10.1016/j.pbb.2011.03.015
Edwards, S., Kenna, G. A., Swift, R. M., and Leggio, L. (2011). Current and promising pharmacotherapies, and novel research target areas in the treatment of alcohol dependence: a review.Curr. Pharm. Des. 17, 1323–1332. doi: 10.2174/ 138161211796150765
Ferraro, L., Beggiato, S., Tomasini, M. C., Antonelli, T., Loche, A., and Tanganelli, S. (2011). GET73 modulates rat hippocampal glutamate transmission: evidence for a functional interaction with mGluR5. Pharmacol. Rep. 63, 1359–1371. doi: 10.2174/138161211796150765
Ferraro, L., Loche, A., Beggiato, S., Tomasini, M. C., Antonelli, T., Colombo, G., et al. (2013). The new compound GET73, N-[(4-trifluoromethyl)benzyl]4-methoxybutyramide, Regulates hippocampal Aminoacidergic transmission possibly via an allosteric modulation of mGlu5 receptor. Behavioural evidence of its "anti-alcohol" and anxiolytic properties.Curr. Med. Chem. 20, 3339–3357. doi: 10.2174/09298673113209990167
Goh, E. T., and Morgan, M. Y. (2017). Review article: pharmacotherapy for alcohol dependence - the why, the what and the wherefore.Aliment Pharmacol. Ther. 45, 865–882. doi: 10.1111/apt.13965
Goodwani, S., Saternos, H., Alasmari, F., and Sari, Y. (2017). Metabotropic and ionotropic glutamate receptors as potential targets for the treatment of alcohol use disorder.Neurosci. Biobehav. Rev. 77, 14–31. doi: 10.1016/j.neubiorev.2017. 02.024
Gregory, K. J., and Conn, P. J. (2015). Molecular insights into metabotropic glutamate receptor allosteric modulation. Mol. Pharmacol. 88, 188–202. doi: 10.1124/mol.114.097220
Gregory, K. J., Noetzel, M. J., Rook, J. M., Vinson, P. N., Stauffer, S. R., Rodriguez, A. L., et al. (2012). Investigating metabotropic glutamate receptor 5 allosteric modulator cooperativity, affinity, and agonism: enriching structure-function studies and structure-activity relationships. Mol. Pharmacol. 82, 860–875. doi: 10.1124/mol.112.080531
Haass-Koffler, C. L., Goodyear, K., Long, V. M., Tran, H. H., Loche, A., Cacciaglia, R., et al. (2017a). A phase I randomized clinical trial testing the safety, tolerability and preliminary pharmacokinetics of the mGluR5 negative allosteric modulator GET 73 following single and repeated doses in healthy volunteers.Eur. J. Pharm. Sci. 109, 78–85. doi: 10.1016/j.ejps.2017.07.031 Haass-Koffler, C. L., Goodyear, K., Long, V. M., Tran, H. H., Loche, A.,
Cacciaglia, R., et al. (2017b). Dataset for Phase I randomized clinical trial
for safety and tolerability of GET 73 in single and repeated ascending doses including preliminary pharmacokinetic parameters.Data Brief. 15, 407–413. doi: 10.1016/j.dib.2017.09.018
Holmes, A., Spanagel, R., and Krystal, J. H. (2013). Glutamatergic targets for new alcohol medications.Psychopharmacology (Berl.) 229, 539-554. doi: 10.1016/j. dib.2017.09.018
Kenakin, T. (2009). “Allosteric drug antagonism,” inA Pharmacology Primer-Theory, Application and Methods, 3rd Edn, ed. T. Kenakin (Amsterdam: Elsevier), 129–147. doi: 10.1007/s00213-013-3226-2
Kenakin, T. (2017). Signaling bias in drug discovery.Expert Opin. Drug Discov. 12, 321–333. doi: 10.1080/17460441.2017.1297417
Khoury, E., Clément, S., and Laporte, S. A. (2014). Allosteric and biased g protein-coupled receptor signaling regulation: potentials for new therapeutics.Front. Endocrinol. (Lausanne) 5:e68. doi: 10.3389/fendo.2014.00068
Koga, K., Iwahori, Y., Ozaki, S., and Ohta, H. (2010). Regulation of spontaneous Ca(2+) spikes by metabotropic glutamate receptors in primary cultures of rat cortical neurons.J. Neurosci. Res. 88, 2252–2262. doi: 10.1002/jnr.22382 Leggio, L., Cardone, S., Ferrulli, A., Kenna, G. A., Diana, M., Swift, R. M.,
et al. (2010). Turning the clock ahead: potential preclinical and clinical neuropharmacological targets for alcohol dependence.Curr. Pharm. Des. 16, 2159–2181. doi: 10.2174/138161210791516369
Loche, A., Simonetti, F., Lobina, C., Carai, M. A., Colombo, G., Castelli, M. P., et al. (2012). Anti-alcohol and anxiolytic properties of a new chemical entity, GET73. Front. Psychiatry 3:8. doi: 10.3389/fpsyt.2012.00008
Mao, L., and Wang, J. Q. (2002). Glutamate cascade to cAMP response element-binding protein phosphorylation in cultured striatal neurons through calcium-coupled group I metabotropic glutamate receptors. Mol. Pharmacol. 62, 473–484. doi: 10.1124/mol.62.3.473
Mao, L., and Wang, J. Q. (2003). Phosphorylation of cAMP response element-binding protein in cultured striatal neurons by metabotropic glutamate receptor subtype 5.J. Neurochem. 84, 233–243. doi: 10.1046/j.1471-4159.2003.01256.x Mason, B. J. (2017). Emerging pharmacotherapies for alcohol use disorder.
Neuropharmacology 122, 244–253. doi: 10.1016/j.neuropharm.2017.04.032 Mihov, Y., and Hasler, G. (2016). Negative allosteric modulators of metabotropic
glutamate receptors subtype 5 in addiction: a therapeutic window. Int. J. Neuropsychopharmacol. 19:pyw002. doi: 10.1093/ijnp/pyw002
Morari, M., Menegale, M., Caló, G., Ferraro, L., Tomasini, C., Bianchi, C., et al. (1994). Excitatory amino acids (EAAs) stimulate phosphatidylinositol turnover in adult rat striatal slices: interaction between NMDA and EAA metabotropic receptors.Neurochem. Int. 24, 191–200. doi: 10.1016/0197-0186(94)90106-6 Nickols, H. H., Yuh, J. P., Gregory, K. J., Morrison, R. D., Bates, B. S., Stauffer, S. R.,
et al. (2016). VU0477573: partial negative allosteric modulator of the subtype 5 metabotropic glutamate receptor with In Vivo efficacy.J. Pharmacol. Exp. Ther. 356, 123–136. doi: 10.1124/jpet.115.226597
Olive, M. F. (2009). Metabotropic glutamate receptor ligands as potential therapeutics for addiction. Curr. Drug Abuse Rev. 2, 83–98. doi: 10.2174/ 1874473710902010083
Porter, R. H., Jaeschke, G., Spooren, W., Ballard, T. M., Büttelmann, B., Kolczewski, S., et al. (2005). Fenobam: a clinically validated nonbenzodiazepine anxiolytic is a potent, selective, and noncompetitive mGlu5 receptor antagonist with inverse agonist activity. J. Pharmacol. Exp. Ther. 315, 711–721. doi: 10.1124/jpet.105.089839
Purgert, C. A., Izumi, Y., Jong, Y. J., Kumar, V., Zorumski, C. F., and O’Malley, K. L. (2014). Intracellular mGluR5 can mediate synaptic plasticity in the hippocampus.J. Neurosci. 34, 4589–4598. doi: 10.1523/JNEUROSCI.3451-13. 2014
Rodriguez, A. L., Grier, M. D., Jones, C. K., Herman, E. J., Kane, A. S., Smith, R. L., et al. (2010). Discovery of novel allosteric modulators of metabotropic glutamate receptor subtype 5 reveals chemical and functional diversity and in vivo activity in rat behavioral models of anxiolytic and antipsychotic activity. Mol. Pharmacol. 78, 1105–1123. doi: 10.1124/mol.110.067207
Rook, J. M., Xiang, Z., Lv, X., Ghoshal, A., Dickerson, J. W., Bridges, T. M., et al. (2015). Biased mGlu5-positive allosteric modulators provide in vivo efficacy without potentiating mGlu5 modulation of NMDAR currents.Neuron 86, 1029–1040. doi: 10.1016/j.neuron.2015.03.063
Soyka, M., and Lieb, M. (2015). Recent developments in pharmacotherapy of alcoholism. Pharmacopsychiatry 48, 123–135. doi: 10.1055/s-0035-1547237
Soyka, M., and Müller, C. A. (2017). Pharmacotherapy of alcoholism - an update on approved and off-label medications.Expert Opin. Pharmacother. 18, 1187–1199. doi: 10.1080/14656566.2017.1349098
Spanagel, R. (2009). Alcoholism: a systems approach from molecular physiology to addictive behavior.Physiol. Rev. 89, 649–705. doi: 10.1152/physrev.00013. 2008
Swift, R. M., and Aston, E. R. (2015). Pharmacotherapy for alcohol use disorder: current and emerging therapies.Harv. Rev. Psychiatry 23, 122–133. doi: 10.1097/HRP.0000000000000079
Tatarczynska, E., Klodzinska, A., Chojnacka-Wojcik, E., Palucha, A., Gasparini, F., Kuhn, R., et al. (2001). Potential anxiolytic and antidepressant-like effects of MPEP, a potent, selective and systematically active mGlu5 receptor antagonist. Br. J. Pharmacol. 132, 1423–1430. doi: 10.1038/sj.bjp.070 3923
Tomasini, M. C., Borelli, A. C., Beggiato, S., Ferraro, L., Cassano, T., Tanganelli, S., et al. (2015). Differential effects of palmitoylethanolamide against amyloid-β induced toxicity in cortical neuronal and astrocytic primary cultures from wild-type and 3xTg-AD mice.J. Alzheimers Dis. 46, 407–421. doi: 10.3233/JAD-143039
Tomasini, M. C., Borelli, A. C., Beggiato, S., Tanganelli, S., Loche, A., Cacciaglia, R., et al. (2016). GET73 prevents ethanol-induced neurotoxicity in primary cultures of rat hippocampal neurons.Alcohol Alcohol. 51, 128–135. doi: 10.1093/alcalc/agv094
Wang, J. Q., Fibuch, E. E., and Mao, L. (2007). Regulation of mitogen-activated protein kinases by glutamate receptors.J. Neurochem. 100, 1–11. doi: 10.1111/j. 1471-4159.2006.04208.x
World Health Organization [WHO] (2014).Global Status Report on Alcohol and Health. Available at: http://apps.who.int/iris/bitstream/10665/112736/1/ 9789240692763_eng.pdf
Yang, F., Snyder, L. B., Balakrishnan, A., Brown, J. M., Sivarao, D. V., Easton, A., et al. (2016). Discovery and preclinical evaluation of BMS-955829, a potent positive allosteric modulator of mGluR5.ACS Med. Chem. Lett. 7, 289–293. doi: 10.1021/acsmedchemlett.5b00450
Zhang, Y., Rodriguez, A. L., and Conn, P. J. (2005). Allosteric potentiators of metabotropic glutamate receptor subtype 5 have differential effects on different signaling pathways in cortical astrocytes.J. Pharmacol. Exp. Ther. 315, 1212– 1219. doi: 10.1124/jpet.105.090308
Conflict of Interest Statement: AL and RC are employees of Laboratorio Farmaceutico CT Srl, Sanremo, Italy.
The other authors declare that the research was conducted in the absence of any commercial or financial relationships that could be construed as a potential conflict of interest.
Copyright © 2018 Beggiato, Borelli, Tomasini, Castelli, Pintori, Cacciaglia, Loche and Ferraro. This is an open-access article distributed under the terms of the Creative Commons Attribution License (CC BY). The use, distribution or reproduction in other forums is permitted, provided the original author(s) and the copyright owner are credited and that the original publication in this journal is cited, in accordance with accepted academic practice. No use, distribution or reproduction is permitted which does not comply with these terms.