Multimedia presentation, cognitive processes, learning:
an experimental research in university teaching
Presentazione multimediale, processi cognitivi,
apprendimento: una ricerca sperimentale
nella didattica universitaria
ABSTRACT
This research project comes from the need to reflect upon formative practices and their models, focusing on the consequences, not always explicit, that they have towards behaviours and learning. The specific aim of this research was to analyse the main epistemological paradigms that guide university professors in their use of cognitive artifacts, paying particular attention to the web conferencing. In order to significantly im-pact learning processes, each cognitive artifact must be designed and used following precise theoretical paradigms binding its use.
Based on existing guidelines regarding multimedia learning from international studies, the didactic func-tionality of multimedia presentation within the ambito of university teaching was verified. Once a hypoth-esis was identified, experimental research was carried out with intentional manipulation of independent variables; the result was measured through a dependent variable (learnings). A control group and two ex-perimental groups participated in the study. A methodology and the related tools to be used were pre-pared. Finally, after having identified the sample, an operative plan was elaborated including times and places, methods of analysis.
Therefore, whilst applying a quantitative methodology, the qualitative elements have not been neglected. The analysis undertaken in this study considered not only the relationships between data and information but also the significant connections within the studied phenomenon. It is a system consistent with a hermeneutic epistemological approach, which refers to an interpretative pedagogy. The research results confirmed the hypothesis: learning outcomes increase when the valorisation of the didactic content as pre-sented by the university teacher through web conferencing, is in accordance with the principles relating to multimedia learning.
Questo progetto di ricerca nasce dall’esigenza di riflettere sulle pratiche formative e sui loro modelli, infine sulle conseguenze, non sempre esplicite, che le une e gli altri hanno nei confronti degli apprendimenti. Nello specifico l’obiettivo è quello di analizzare i principali paradigmi epistemologici che guidano il do-cente universitario nell’uso di artefatti cognitivi, con particolare attenzione alla presentazione multimedia-le in un ambiente di web conference. L’idea di partenza è che ogni artefatto cognitivo se deve avere un im-patto significativo sui processi di apprendimento deve essere progettato e utilizzato sulla base di precisi paradigmi teorici che ne vincolano l’utilizzo.
Sulla base di linee guida sugli apprendimenti multimediali tratte da studi internazionali è stata verificata la funzionalità didattica della presentazione multimediale all’interno di un insegnamento universitario. Indi-viduata un’ipotesi è stata messa in atto una ricerca sperimentale con manipolazione intenzionale di varia-bili indipendenti, il cui risultato è stato misurato attraverso una variabile dipendente (gli apprendimenti); allo studio hanno partecipato un gruppo di controllo e due gruppi sperimentali; sono state predisposte una metodologia e i relativi strumenti da impiegare. Infine, dopo aver individuato il campione è stato ela-borato un piano operativo comprensivo di tempi e luoghi, modalità di analisi.
La metodologia impiegata ha un impianto di tipo quantitativo, ma non trascura nemmeno gli elementi qua-litativi, in quanto indaga sulle relazioni fra dati e informazioni così come sui nessi significativi all’interno del fenomeno studiato. Si tratta di un impianto coerente con un approccio epistemologico ermeneutico, che fa riferimento ad una pedagogia interpretativa. I risultati della ricerca hanno confermato l’ipotesi: la valoriz-zazione del contenuto didattico presentato dal docente universitario tramite la web conference in accordo con i principi di apprendimento multimediale aumenta i risultati dell’apprendimento.
KEYWORDS
Giovanni Ganino
Università di Ferrara [email protected] Fo rm a z io n e & I n se g n a m e n to X V I – 3 – 2 0 1 8 IS S N 1 9 7 3 -4 7 7 8 p ri n t – 2 2 7 9 -7 5 0 5 o n l in e d o i: 1 0 7 3 4 6 /-fe i-X V I-0 3 -1 8 _ 1 9 © P e n sa M u lt iM e d iaG
io
v
a
n
n
i
G
a
n
in
o
IntroductionThe field of reference is one of teaching with media, the essential idea being that if used according to the right methodologies, technology can contribute to the process of teaching and learning. This premise places the present work within a problematic framework, far from a technocentric vision, but at the same time close to those theories that consider cognitive artifacts, skilfully used from a ped-agogical point of view, useful for teaching (Margiotta, 2005). Resources that, when linked to specific learning objectives, may be able to contribute to the learning process, to have a significant impact on the student’s ability to compre-hend, to solve problems, to construct complex theories, to activate processes of critical reflection, conceptualization and verbalization.
In order for this to occur, multimedia presentations must be prepared accord-ing to procedures based on research activities and precise methodological indi-cations. This is also valid for web conferencing, which is charcterised by synchro-nous communication and determines communication processes marked by “rich information” (Daft & Lengel, 1984); thereby reducing the risks of misunderstand-ings present in asynchronous communication. Thanks to its potential for interac-tivity, use of different modal channels, the variety of languages available and above all the presence of social indicators, web conferencing is second only to face-to-face communication. Furthermore, its ease of use allows the creation of non-invasive educational environments within which the presence of technolo-gies tend to disappear: to overcome resistance to technological innovation in working environments (Rogers, 2003; Bauer, 1995) it is necessary to create a high-ly technological didactic set capable of being experienced naturalhigh-ly rather than a foreign instrument to be feared (technophobia).The illusion of not feeling any technological mediation in the communicative process (Lombard & Ditton, 1997) and the experimentation of a geography in which the physical environment can be decontextualized and the body of the subjects to de-physicalize (Cattaneo, 2009), seems to favor the use of web conferencing. The use of this mechanism, its naturalization and disappearance of technology, on the one hand, and appli-cation of the principles of participatory and relational culture (social and collab-orative dimension), on the other, is in our opinion the best method to enable dis-tance students to enter the classroom. Due to these characteristics, web confer-encing environments are widely used for streaming university lectures.
1. Multimedia learning and cognitive processes: theoretical foundations
The use of multimedia presentations in the educational field must be guided by principles relating to multimedia learning which favor cognitive processes. Our field of reference was research into cognitive psychology and Instructional De-sign which has attributed two meanings to the concept of multimedia (Mayer, 2001):
1. multimedia as a presentation format that adopts multiple sensory channels. Under this concept, interest is directed to multimodal perceptive aspects which must be highlighted in order to render the simultaneous presentation of more effective information; and
2. multimedia as a dynamic cognitive process that leads to “assembly” information of different types of information into a functional mental representation to the learning processes”.
Reference was made to theories which can assist in understanding how mul-timedia learning works: the work of Allan Paivio (1971; 1990) on dual-coding the-ory, related to the different coding of information, verbal and non-verbal, by the human cognitive system; cognitive load theory (Sweller, 1988; 2010) which ex-plores the load imposed on working memory by the information presented, and focuses on the analysis of cognitive resources used during learning and how they can be directed toward objectives specific didactics (Chandler & Sweller, 1991); the generative theory of multimedia learning (Mayer, 2001; 2009), a disci-pline aimed at the construction of mental representations based on the combi-nation of words (narrated or spoken) and images (illustrations, photos, anima-tions, films); and the work of Clark and Lyons (2011) on the communicative and psychological functions of different types of images.
The integration of these theoretical references can provide useful indications to instructional designers and teachers who intend to use audiovisual and mul-timedia resources; and to researchers interested in deepening this line of re-search.
The basic idea is that a student’s learning through multimedia presentations is not dependent upon the mere presentation of the necessary information, but upon the presentation of the necessary information, delivered according to the functioning mechanisms of the students’ mental and cognitive processes. Exper-imental research shows a better level of learning is achieved when the material is presented in a variety of formats than when the presentation is solely graphic or verbal. There are however, less optimistic and simplistic comments on the ef-fects, sometimes negative, of multimedia.
The theories investigated produced an important contribution to both the positive and negative aspects of the use of images in learning processes.
2.The pre-experimental phase
2.1. The purpose and objectives of the research
As mentioned, our analysis focused on the modality of multimedia presentation within a web conference environment in order to understand:
1. the didactic attitude of the teacher. We have already noted that in order for any cognitive artifact to have a significant impact on learning processes, it must be designed and used on the basis of precise theoretical paradigms. These paradigms determine their correct usage; and
2. a second objective of the research is to go beyond the limits of the laboratory and to offer operative indications to both university teachers and Instructional designers, in order to make media teaching communication more effective, in terms of significant learning (Ausubel, 1968).
The final aim is to contribute to the improvement of learning processes in teaching situations which involve multimedia.
2.2. The research questions
In the didactics with the web conference, the fundamental aspects from a teach-ing communication standpoint are two, beside the teacher’s speech:
M
u
lt
im
e
d
ia
p
re
se
n
ta
ti
o
n
,
c
o
g
n
it
iv
e
p
ro
c
e
ss
e
s,
l
e
a
rn
in
g
G
io
v
a
n
n
i
G
a
n
in
o
1. The use of visuals to support/integrate verbal communication (multimedia presentation). Does the use of visual elements allow deeper learning? Which visuals are more effective? How can we evaluate the appropriateness of the visual materials? Is it possible to design the correct useage of images? How can visuals be best adapted for students? How can visual materials be used to increase a student’s motivation?
2. The teacher/student relational activity. The relational aspect, as previously stated, assumes great importance for education mediated by technologies. When web conferencing tools are used to stream the classroom lesson, the synchronous and interactive communication dynamics, if well exploited, allow students at home to “obtain the keys to enter the classroom” and fully experience the teaching process.
The main question that the research seeks to answer is the following:
Does the university professor involved in the “FaD model” experience, effectively use the web conference (audiovisual cognitive artifacts) in a media teaching system? More precisely, does the teacher appropriately utilise the educational communication guidelines of the multimedia learning principles relevant to the use of web conferencing: visuals and relational activity?
2.3. The hypothesis
As noted above, the use of visuals to support/integrate the teacher’s speech and a constant relational and feedback activity (chat), are the two most important as-pects of educational communication with web conferencing. Our hypothesis is as follows:
The valorization of the didactic content presented by the professor of higher education using web conferencing in according with multimedia learning principles, regarding visuals and visuals combined with chat activities, increases the learning outcomes in the FaD model experimentation.
2.4. Independent variables
We identified two independent variables.
Independent variable 1 relates to the visuals inside the web conference tool. We used the same contents of the lesson (the teacher’s speech) and intervened by modifying the visuals. The visuals were modified in compliance with the guidelines identified in the theoretical component. This is the general principle that has guided our work: learning by students through multimedia presenta-tions does not depend on the presentation of the necessary information alone, but on the presentation of the necessary information in a manner which comple-ments the functioning mechanisms of the students’ mental and cognitive processes.
Independent variable 2 relates to the visuals combined with interactional ac-tivities (chat). The researcher assisted the teachers with the use of 25 minute ses-sion to integrate the modified visuals (through compliance with the guidelines identified in the theoretical component). The experimental groups were then subjected in different ways to the two independent variables.
2.5. Dependent variable
The dependent variable is evidenced by the learning outcomes. More precisely, in the measurement of some learning elements captured by verification tests: the level of knowledge which was measured using a multiple choice question test; the level of learning skills, which was measured using an open-ended question test.
Our goal was to verify the activation of metacognitive behaviors, the results of which, can be fully evaluated over the medium and long term.
3. Phases and research methodology
Once a research hypothesis was formulated and the main variables of the model
were identified, lessons organized in accordance the FaD model1 were
subse-quently identified. Prof. A. G. (Literature teaching for children, first semester of the academic year 2017-2018) participated. Finally, a sample was identified and an operational plan was elaborated, including time and place, analysis method and the relative tools to be used.
3.1. The sample of subjects
Students enrolled in the Children’s literature course, by Prof. A.G., were involved in the experimentation (first semester of the academic year 2017-2018). A total of 127 students were divided into 4 groups on the basis of a voluntary sampling of convenience (thus through a non-probabilistic methodology).
Group 1. 72 students who physically attended the lecture in the classroom. –
These students were excluded from the study. We did not want to undertake a comparison between teaching when physically present in the classroom and at a distance.
Group 2 (control group). 18 students attended online (via web conference) –
following the Lesson in Conventional Mode, whereby the teacher adopted their normal teaching method (without the intervention of the researcher). Group 3 (experimental group). This experimental group consisted of 18 –
students with the same characteristics as the control group attended via web conference and the Modified Lesson from the Researcher was utilised. Group 4 (experimental group). This second experimental group consisted of –
19 students with the same characteristics of the control group, followed via web conference and the Modified Lesson from the Researcher was utilised (as for group 3). Further, this group participated in 25 minutes of relational activity (via chat).
On the basis that 72 students in Group 1 were excluded from the study (be-cause they pysically attended lessons in the classroom), the sample subjects of the study were reduced to 55 from 127.
1 The context of the study is a conventional university teaching setting, supported by the use of te
chnology, at the University of Ferrara. The classroom lesson is live streamed (through a web con ferencing system) enabling students who are not physically present to attend a virtual classroom
(on any device with an internet connection).
M
u
lt
im
e
d
ia
p
re
se
n
ta
ti
o
n
,
c
o
g
n
it
iv
e
p
ro
c
e
ss
e
s,
l
e
a
rn
in
g
3.2. The content sample
The experimental phase impacts only part of the teaching. The module used for experimental research, lasting 2 hours (the total teaching lasts 30 hours), is called Literature for children and new digital technologies.
3.3. Measurement of learning outcomes (dependent variable)
The tool used to measure the learning outcome was a written questionnaire: Multiple choice question tests (test_0 and test_01) to mesaure the level of –
knowledge;
Open-ended question tests (test_02) to mesaure the level of competence. –
The control group and the experimental groups carried out the tests at different times: the control group immediately after atending the conventional lessons, the experimental groups after attending the lessons modified by the researcher. To avoid minimise interference factors that could nullify the reliability of the research, two different tests were prepared: one for the control group and one for the two experimental groups. The tests were prepared keeping the same didactic objectives, only the formal structure was changed. In this way the passage of information from the control group to the experimental groups was avoided.
The results of groups 3 and 4 (experimental) were compared with those of control group (group 2). To obtain a more objective analysis, the results were compared with the students’ pre-existing knowledge, measured with a multiple choice questionnaire (test_0).
3.4. Preparation of questionnaires
The construction of the questionnaire and their correction grids was carried out by Prof. A.G. The work carried out by the researcher concerned the analysis and inter-section of data through a statistical program (“R” Project for Statistical Computing). Set out below are the various phases of work, including the preparation, the method of execution and evaluation of the questionnaires:
1. definition of the research objective and evaluation related to the choice of the sample;
2. clear and precise definition of the teaching objectives to be tested; 3. questionnaires’ typology;
4. item’s content;
5. decisions on the verbalization of the items: terminology to be used, that is to say the use of simple and clear language, with terms known to the students; avoiding negative sentences or double negation; it was important to verify the student’s ability to respond rather than their ability to understand the question; 6. actions for the organization of the items in the test: number of questions,
sequence of questions according to the levels of difficulty; 7. form and scale of measurement of responses (assessment grids);
8. execution tests modality: this involved thoroughly explaining the structure of the tests to the students (to avoid the possibility of copying), the time permitted for each test, etc.
9. pre-test and subsequent revision.
G
io
v
a
n
n
i
G
a
n
in
o
3.5. Data analysis methods
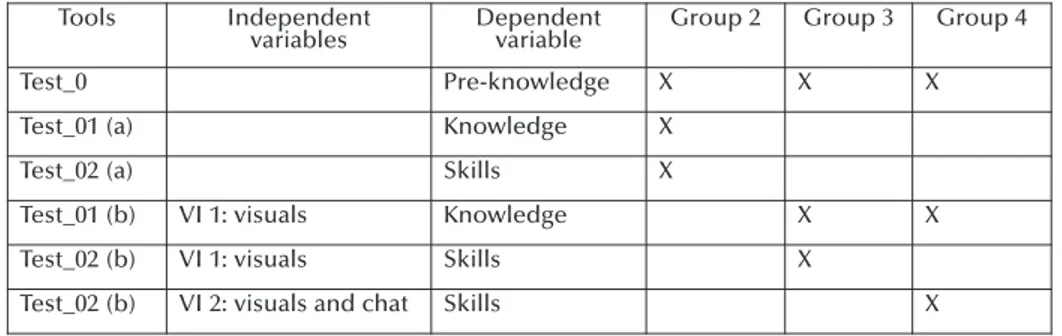
Table no.1 summarises the general framework including tools, independent and dependent variables, and the relationships between variables and groups. 1. test_01, comparing the results of the two experimental groups (both exposed
to independent variable 1) with those of the control group, indicates whether independent variable 1 has worked;
2. test_02, comparing the results of the experimental group 4 (exposed to independent variable 2) with the control group, indicates whether the simultaneous use of visuals and chat has worked;
3. test_02, comparing the results of the control group with those of experimental group 3 (still exposed only to independent variable 1) indicates whether independent variable 1 continued to work. It is an indicator of validity: utlising the same sample but different contents;
4. by comparing the difference between test_01 and test_02, of the experimental group 4 and of control group 2, we were able to measure whether independent variable 2 had a greater impact than independent variable 1. If the results were higher for experimental group 4 in test_02, compared to the control group’s results for test_01, then independent variable 2 produced more effective results. This is an indicator of how chat plays an important role;
5. the comparison between the differences in outcomes of the two experimental groups (test_0/test_01; test_0/test_02; test_01 / test_02) also provides other information on the significance and impact of the two independent variables.
Table 1. General pictures
4. The experimental stage
Phase 1 - Entry exam (Test_0) to test pre-existing knowledge
On the day of the first lesson (26 September 2017), after very precisely explaining the objectives of her course, Professor G. asked all students present in the class-room to answer an entry exam (test_0). The aim was to test the pre-existing knowledge possessed by the students on a part of the course topics, related to the module on Children’s literature and new digital technologies.
Phase 2 - Sampling participants in the trial on a voluntary basis
During the first lesson, the teacher asked the students present (127) to decide whether to attend lessons in person in the classroom or in the virtual classroom (with web conference): 72 students opted for classroom attendance (group 1), 55 opted for virtual classroom attendance. These 55 students were then randomly
Tools Independent
variables Dependent variable Group 2 Group 3 Group 4
Test_0 Pre-knowledge X X X
Test_01 (a) Knowledge X
Test_02 (a) Skills X
Test_01 (b) VI 1: visuals Knowledge X X
Test_02 (b) VI 1: visuals Skills X
Test_02 (b) VI 2: visuals and chat Skills X
M
u
lt
im
e
d
ia
p
re
se
n
ta
ti
o
n
,
c
o
g
n
it
iv
e
p
ro
c
e
ss
e
s,
l
e
a
rn
in
g
divided into three groups, two groups of 18 (group 2, group 3) and one of 19 (group 4). As noted above, group 1 was excluded from the study because they physically attended lessons in the classroom. The study population was thereby reduced from 127 to 55; from which a further 6 students did not complete the course; accordingly the sample population of the study was 49 subjects. Group 2 was defined as a control group; groups 3 and 4 experimental groups. Phase 3 – Group 2 (control group) attends the virtual classroom lesson (lessons 1 and 2)
Group 2 attends the lessons of the Children’s literature and new digital technolo-gies module in the virtual classroom, via web conference. On 17 October 2017, 16 students were present in the virtual classroom (lesson 1); On 19 October 2017, 16 students (lesson 2). Students were not otherwise permitted access to regis-tered. The lesson was prepared by the teacher autonomously together with the power point slides.
Phase 4 - Assessment tests (group 2) Assessment tests group 2:
1. on 18 October 2017 the first assessment test (Test_01) was carried out, at 18.30. It was a multiple choice question test;
2. on 20 October 2017 the second assessment test (Test_02) was carried out, at 18.30. It was an open-ended question test.
Phase 5 - Analysis by the researcher of the visuals utilised in lesson
The researcher analyzed the recording of the lesson to verify the communica-tion-teaching functionality and use of the visuals. The reference parameters, on the basis of which the verification was carried out, were the guidelines identified through the study of the theories of multimedia learning in relation to cognitive processes.
Despite the teacher’s good communication skills, their colloquial and persua-sive style, the relationship between the word and images were misaligned Many of the visuals did not appear to be in line with the guidelines identified in the theoretical part which were being verbally communicated by the teacher. Here are the most obvious:
1. use of words (teacher’s speech) and images were not arranged in a complementary logic;
2. use of images with a decorative function;
3. use of very long texts and absence of the principles of adaptation (division into paragraphs, highlighting key words or concepts, use of targeted lists presented in synchronous mode, etc.);
4. redundancy effects;
5. lack of graphics to explain relationships and organize information;
6. noise (visual and sound disturbances) due to lack of slides and some technical problems.
Phase 6 – Modification of visuals by researcher (Independent variable 1)
The researcher modified the visuals on the basis of the guidelines identified to favor multimedia learning. The modified power point replaced the original one through a post production operation.
G
io
v
a
n
n
i
G
a
n
in
o
Phase 7 – Attendance by group 3 and 4 at the lesson modified in the virtual class-room (web conference).
Group 3 attended the lessons in the virtual classroom as follows:
1. the verbal component was identical to the lesson attended by group 2; 2. the multimedia presentation was modified on the basis of multimedia learning
principles.
The mode of lesson delivery was similar to “live streaming”. The lessons were attended on 24 and 26 October 2017, there were 17 and 16 students respectively. Group 4 follows the lesson in the virtual classroom (a virtual classroom differ-ent from that of group 3).
The lesson on 24 October 2017 was identical to that followed by group 3. The lesson on 26 October 2017 was identical to that followed by group 3, plus it in-cluded 25 minutes of virtual chat during which the teacher answered the stu-dents’ questions.
Phase 8 - Assessment tests: Test_01 and Test_02 (group 3 and group 4)
On 25 October 2017, the first assessment test was given (Test_01), at 18.30. The test related to lesson 1;
on 27 October 2017, the second assessment test was given (Test_02), at 18.30. The test related to lesson 2.
5. The post-experimental stage (data analysis)
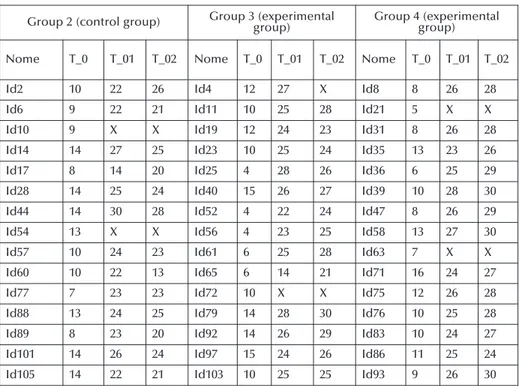
Table 2 highlights the general picture.
Group 2 (control group) Group 3 (experimentalgroup) Group 4 (experimentalgroup)
Nome T_0 T_01 T_02 Nome T_0 T_01 T_02 Nome T_0 T_01 T_02
Id2 10 22 26 Id4 12 27 X Id8 8 26 28
Id6 9 22 21 Id11 10 25 28 Id21 5 X X
Id10 9 X X Id19 12 24 23 Id31 8 26 28
Id14 14 27 25 Id23 10 25 24 Id35 13 23 26
Id17 8 14 20 Id25 4 28 26 Id36 6 25 29
Id28 14 25 24 Id40 15 26 27 Id39 10 28 30
Id44 14 30 28 Id52 4 22 24 Id47 8 26 29
Id54 13 X X Id56 4 23 25 Id58 13 27 30
Id57 10 24 23 Id61 6 25 28 Id63 7 X X
Id60 10 22 13 Id65 6 14 21 Id71 16 24 27
Id77 7 23 23 Id72 10 X X Id75 12 26 28
Id88 13 24 25 Id79 14 28 30 Id76 10 25 28
Id89 8 23 20 Id92 14 26 29 Id83 10 24 27
Id101 14 26 24 Id97 15 24 26 Id86 11 25 24
Id105 14 22 21 Id103 10 25 25 Id93 9 26 30
M
u
lt
im
e
d
ia
p
re
se
n
ta
ti
o
n
,
c
o
g
n
it
iv
e
p
ro
c
e
ss
e
s,
l
e
a
rn
in
g
Table 2. Results of the three groups in the 3 tests
The outcome of the test_0 highlights the normal distribution of the sample, the average result of the pre-existing knowledge test is: 11.3 for group 2; 9.75 for group 3; 11 for group 4.
If we observe the average scores of the two tests (t_01 and t_02) we see how the two experimental groups obtained a higher score, respectively 24.4 (experi-mental group 3) and 26.7 (experi(experi-mental group 4), compared to control group 2 (23); the comparison between the control group 2 and the experimental group 3 consistently shows a small difference (equal to 1.4); the comparison between the control group 2 and experimental group 4 shows a significant difference of 3.7 points; the comparison between the two experimental groups is in favor of group 4: 2.3 points more than group 3. This data immediately indicates that the independent variables have had positive effects. However this analysis is too general, research variables require more in-depth analysis.
Test_01 and Independent variable 1
In test_01 the control group 2 reported an average score of 23.3; the experimental group 3 a slightly higher average score (23.8); the experimental group 4 is the one that reported the highest average score (25.5). The final results are rather homo-geneous, especially between the control group 2 (23.3) and the experimental group 3 (23.8). Experimental group 4 (25.5) appears to have had a better response to the independent variable 1 (Graph 1).
Graph 1 - Test_01_ Score and score classes
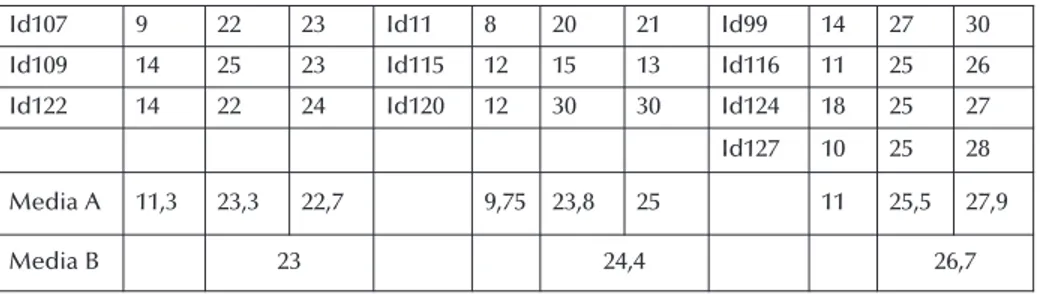
Id107 9 22 23 Id11 8 20 21 Id99 14 27 30
Id109 14 25 23 Id115 12 15 13 Id116 11 25 26
Id122 14 22 24 Id120 12 30 30 Id124 18 25 27
Id127 10 25 28 Media A 11,3 23,3 22,7 9,75 23,8 25 11 25,5 27,9 Media B 23 24,4 26,7
G
io
v
a
n
n
i
G
a
n
in
o
For a more objective evaluation we considered the difference in increment between the input test that measured the pre-existing knowledge (test_0) and the test_01. The results are as follows: in group 2 the increase was 12; in group 3 the increase was 14; in group 4 the increase was 14.4.
Result one. With independent variable 1, we observe that the use of visuals according to the identified international guidelines, has had a positive impact on dipendent variable (learning outcomes). It appears that the two experimental groups seem responded well to the manipulation of the independent variable 1, obtaining higher learning outcomes than the control group (Graph 2).
Graph 2 - Test_01_ Score classes
Test_02 and Independent variables 1 (visuals) and 2 (visuals and chat)
In test_02, the average score of the control group was 22.7; the average score of the experimental group 3 was 25; the average score of experimental group 4 was 27,9. The two experimental groups still obtained a higher score than the control group (Graph 3).
Experimental group 3, exposed to independent variable 1, obtained better learning results than control group 2 (2.3 points more). This result improved by 1.8 points the performance of experimental group 3 on the control group com-pared to the first test_01 (the difference was 0.5). The result is even better if we take into account the difference in increase between the two groups, comparing the results of test_0 (on the pre-existing knowledge) and test_02 (the experimen-tal group 3 increases almost 4 points more than the control group).
Graph 3 - Test_02_ Score and score classes
M
u
lt
im
e
d
ia
p
re
se
n
ta
ti
o
n
,
c
o
g
n
it
iv
e
p
ro
c
e
ss
e
s,
l
e
a
rn
in
g
Experimental group 4 (subjected to independent variable 2) obtained better learning results than the control group: 5.2 points more; increasing to 5.7 if we consider the difference in increment between test_0 and the test_02.
Moreover in test_02, experimental group 4 achieved 3 points more than ex-perimental group 3. This also indicates that independent variable 2 had a positive impact, higher than the independent variable 1.
Result two. In test_02 experimental group 3 improves its learning outcomes compared to the control group. Therefore the single use of independent variable 1 continues to have a positive impact on the dependent variable.
Experimental group 4 achieved the best results, both compared with control group and experimental group 3. Accordingly, independent variable 2 has had a positive impact on the dependent variable, higher than independent variable 1: both experimental groups have improved compared to the control group, but experimental group 4, also exposed to the chat, improved the most.
Independent variable 1 and Independent variable 2 compared: differences in increase of two experimental groups (test_0/test_01, test_0/test_02, test_01/test_02) To further highlight the effectiveness of the chat functionality, we can verify the differences in increase between the two experimental groups. Table no.3 shows the comparison of the learning outcomes of the two experimental groups.
Table 3. Differences in increase between the two experimental groups (with indication of variables involved)
The difference in increase between test_0 and test_01 shows a small increase of 0.5 points in favor of the experimental group 4. The difference in the increase between test_0 and test_02 shows an increament of 01.65 in favor of experimental group 4. The difference in increase between test_01 and test_02 is equal to 1.25, always in favor of experimental group 4.
These results support our hypothesis. When the experimental groups were exposed to both independent variable 1, they grew in the same way, with a slight difference in score. When the experimental groups were exposed differently to variables 1 and 2: the increment in scores for experimental group 4 was higher. This indicates that independent variable 2 resulted in a greater increase than in-dependent variable 1.
Improved learning outcomes were achieved, most likely due to the utilisation of the chat functionality, although this should be verified in a more scientific way (with an independent variable focused only on this aspect). It is also possible to assume from our data how the relational aspect between teacher and student (central to the concept of physically attending classes), assumes greater impor-tance in the training mediated by technologies. In the case of web conferencing, the dynamics of synchronous and interactive communication, if well exploited,
Increment
Group 3 IncrementGroup 4 Differences
t_0/t_01 14 (VI 1) 14,5 (VI 1) + 0,5 gruppo 4
t_0/t_02 15,25 (VI 1) 16,9 (VI 2) + 1,65 gruppo 4
t_01/t_02 1,25 (VI 1) 2,5 (VI 2) + 1,25 gruppo 4
G
io
v
a
n
n
i
G
a
n
in
o
enables students at home to obtain the keys to the classroom for a fully integrat-ed teaching experience. In practice, continuous interaction and feintegrat-ed-back activ-ity (via chat) is, as indicated by pedagogical research, indispensable for the suc-cess of teaching prosuc-cesses (the teacher can intervene based on the students’ re-sponse) and learning processes (students can improve their performances if they are aware of their didactic criticalities) (Domenici, 2016).
Conclusions
The learning outcomes of experimental groups confirmed the hypothesis: the valorization of the didactic content presented by the professor of higher educa-tion using web conferencing in accordance with multimedia learning principles regarding visuals and visuals combined with chat activities, increased the learn-ing outcomes in the FAD model experimentation. In conclusion, this leads us to draw the following brief observations.
The use of the web conferencing can not be considered a “communication fashion” accessory, but must be carefully prepared and planned in order to be used effectively rather than to contribute to cognitive overload and create learn-ing difficulties. In order to have a significant impact on learnlearn-ing processes, each cognitive artifact must be designed and used following precise theoretical para-digms binding its use.
More generally, multimedia integrated education must be considered part of an epistemologically complex environment; one that is characterized by a dy-namic and potentially problematic relationship between teaching and learning and where digital technology can play a determinative factor of change and added value.
References
Ausubel, D.P. (1988). Educazione e processi cognitivi. Milano: Franco Angeli (ed. or. 1968). Bauer, M. (1995). Resistance to New Technology. Cambridge: Cambridge University Press. Cattaneo, A. (2009). Verso una didattica della videoconferenza. In A. Cattaneo, G. Comi (a
cura di), Didattica della videoconferenza. Un manuale operativo. Roma: Carocci. Chandler, P. & Sweller, J. (1991). Evidence for Cognitive Load Theory. Cognition and
Instruc-tion 8(4) 351-362.
Clark, R. & Lyons, C. (2011). Graphics for Learning: Proven Guidelines for Planning,
Design-ing, and Evaluating Visuals in Training Materials. (II ed.) San Francisco: Pfeiffer.
Daft, R.L. & Lengel, R.H. (1984). Information richness: A new approach to managerial behav-iour and organizational design. In Staw, B. & Cummings, L.L. (a cura di). Research in
Or-ganizational Behavior. Greenwich: JAI Press, vol. 6.
Domenici, G. (a cura di) (2016). La formazione on-line a Roma Tre. L’esperienza del corso di
laurea in scienze dell’educazione. Roma: Armando.
Lombard M. & Ditton, T. (1997). At the Heart of it All: The concept of Presence. Journal of
Computer-Mediated Communication. 3 (2), retrieved April 29 2010, from
htt://www.as-cusc.org/jcmc/vol3/issue2/lombard.html.
Margiotta U. (2005). Pianificazione strategica dell’universita virtuale. In Margiotta U. & Bal-boni, P. Progettare l’universita virtuale. Comunicazione, tecnologia, progettazione,
mo-delli ed esperienze. Torino: UTET.
Mayer, R.E. (2001). Multimedia Learning. Cambridge: Cambridge University Press.
Mayer, R.E. (2009). Multimedia Learning. Second Edition. New York: Cambridge University
Press.
M
u
lt
im
e
d
ia
p
re
se
n
ta
ti
o
n
,
c
o
g
n
it
iv
e
p
ro
c
e
ss
e
s,
l
e
a
rn
in
g
Paivio, A. (1971). Imagery and Verbal Processes. New York: Holt.
Paivio, A. (1990). Mental representations: a dual coding approach. New York: Oxford Uni-versity Press.
Rogers, E. M. (2003). Diffusion of Innovations. New York: Free Press.
Sweller, J. (1988). Cognitive load during problem solving: Effects on learning. Cognitive
Sci-ence, vol. 12, pp. 257-285.
Sweller, J. (2010). Cognitive load theory: recent theoretical advances. In Plass, J.L., Moreno, R. & Brunken, R. (eds.), Cognitive Load Theory. New York: Cambridge University Press, (pp. 29-47).