Dario D’Orazio Dottore di ricerca in acustica applicata, è referente per le attività di acustica architettonica del gruppo di Acustica Applicata dell’Università di Bologna. Membro UNI per la qualità acustica in spazi confinati, è attualmente docente del corso di Illuminotecnica e Acustica della Facoltà di Architettura di Cesena.
Giulia Fratoni Ingegnere edile e architetto, si occupa di modellazione numerica nell’ambito dell’acustica degli spazi interni e dell’illuminotecnica.
Massimo Garai Professore Ordinario di Fisica Tecnica Ambientale e Acustica Applicata nell’Università di Bologna, di cui coordina il gruppo di ricerca in acustica applicata, è presidente della commissione “acustica e vibrazioni” dell’ente normativo Italiano UNI e coordinatore del gruppo normativo europeo CEN/TC256/SC1/WG40.
Progettazione acustica di una sala polivalente all’interno di un’ex chiesa
Acoustic design of a multipurpose hall inside a former church
The present work is about an acoustic design for a former church converted into a multi-purpose auditorium. The current status of the hall has been classified by means of an acoustic measurements campaign complying with technical standards requirements. A numerical model, which has been calibrated through the measured values, led to the development of the acoustic design that includes sustainable and not-invasive interventions. In contrast with the practical habits, which would use a large amount of sound absorbing materials, an array of suspended reflecting panels over the musicians positions has been introduced. Exploiting the reflecting and scattering properties of those objects, sound clarity and speech definition improve. All the treatments are validated using numerical simulation softwares in order to estimate the efficiency of the whole improvement proposal.
Keywords: Acoustic design; Acoustic improvement; Church renovation; Energy distribution; Ray tracing Il presente lavoro riguarda la riqualificazione acustica di un’ex
chiesa convertita ad auditorium polivalente. Lo stato attuale della sala è stato qualificato attraverso misure conformi agli standard tecnici per la qualità acustica delle sale. Un modello numerico, tarato sulla base dei valori misurati, ha permesso di sviluppare un progetto di correzione acustica che prevede interventi sostenibili dal punto di vista economico e non invasivi dal punto di vista architettonico. Contrariamente alla prassi tecnica, che in questi casi prevedrebbe ampio uso di materiali fonoassorbenti, è stato introdotto come elemento principale del controllo del campo sonoro un sistema di pannelli riflettenti sospesi. Sfruttando le proprietà di riflessione e di scattering di tali elementi si riesce ad ottenere un aumento della chiarezza del suono e dell’intelligibilità del parlato. Gli interventi sono stati convalidati tramite l’utilizzo di software di simulazione numerica e l’analisi della distribuzione spaziale delle grandezze energetiche.
Parole chiave: Progettazione acustica; Miglioramento acustico; Restauro di chiese; Distribuzione dell’energia; Ray tracing
571
I. Introduction
The acoustics in churches is the result of several factors and certainly it represents a complex phenomenon largely analyzed in literature. According to some studies, “the history of western civilization can be told through the acoustics of its worship spaces”1. The prevalence of speech (words, sermons, preaches) or music (choirs, instruments) within a liturgy has led to distinct priorities. As a consequence, worship buildings have precise shapes and materials to optimize the desired goal. Even ancient Christian churches generally present a geometrical complexity that makes it difficult to delineate exactly a single scheme, there are some characteristcs they share, such as large volumes, reflecting coatings, articulated space distributions, domes, vaults, high ceilings, aisles, chapels and flat rear wall. All these recurrent aspects contribute to create phehomena as long reverberation times, coupled volume effects, echoes, sound focusing defects, weak early reflections and insufficient sound clarity (the clarity being the ratio between the “useful” energy of early reflections and the “harmful” energy of late reverberation)2.
The combination of multiple volumes, for instance, is one of the more complex aspect to investigate inside a church. In that regard, Knudsen demonstrated that inside churches sound propagation is strongly affected by coupled volume effect3. His measures allowed
to see how in case of coupling phenomena decay curves have two marked slopes. Multi-rate decays have been examined also by Cirillo and Martellotta, that surveyed several churches in order to better understand this complex issue4. He discovered that using a
multy-decay model for predicting energy-based parameters is a useful tool to adapt Barron’s revised theory to churches, even if measures conditions are not explicitily connected with a multi-volume situation. About churches acoustics, a further complex issue concerns the measurements procedure, especially the choice of sources and receivers placement. The complexity of this kind of buildings can lead different researchers to choose dissimilar source–receiver arrangements, that lead to incomparable results. In addition, substantial changes in the behavior of the space can be recorded depending on where the sound source is placed. Various researchers, especially in Spain5
and Italy6, have performed acoustic surveys
to solve these doubts and to propose some guide lines789. The goal of all these studies is to
compare results of measurements campaigns carried out by different teams with various method. Only a proper comparison among results allows to improve the knowledge of sound propagation inside this kind of buildings. The study case of the present work is a former church in Budrio, near Bologna, that was converted into an auditorium around 40 years
ago and now it is used as concert hall, museum area, cinema, conference and meeting room. Nevertheless, its versatility causes a series of matters, since every activity has its own needs and consequently requires appropriate conditions. In particular, people’s complaints and musicians’ opinions raised the issue about a bad acoustics and an insufficient speech intelligibility. Thereby these defects led to the idea of a necessary improvement intervention.
II. Acoustics of worship spaces
According to the classical theory, in a room the sound field is a combination of a direct component and a reverberant one. In this way, when we want to quantify the total sound level in a point we can deal with the strength parameter G, that is the difference between the sound pressure level at a certain distance r and the reference chosen:
where:
- G(r) is the sound strength, according to ISO 338210;
- L(r) is the sound pressure level at a distance r;
- L10 is the reference sound pressure level at 10 meters, in dB;
- d = 100/ r2 is the direct sound energy
572 - r is the source-receiver distance, in meters;
- T is the reverberation time, in seconds; - V is the volume of the room, in m3.
Barron and Lee observed that the total reflected sound level is affected by source-receiver distance and is not constant as the classical principles assume. In particular, it decreases moving towards the farthest rows of the audience. The new model assumes that the total sound is composed of a direct sound component and a linearly decaying reflected component which starts when the direct sound arrives11.
The fact that the early energy weakens moving away from the source determines the main gap between the results pointed out by Barron and those values estimated using the traditional method. In Barron and Lee’s revised theory main parameters the attention is focused on are the total sound pressure level G (Eqn. 2) and the early-to-late sound index C80 in order to easily ideal with early and late component trends:
shapes in worship building elements raises the scattering effect, removing some energy from the specular reflections. What has been called modified theory is a model suggested by Cirillo and Martellotta to better fit the results gained12:
III. Acoustics treatments
In spaces like concert halls it’s more important to guide sound where it is most needed, rather than to eliminate energy from the space, as absorbers do13. Reflecting surfaces play a key
role for a correct sound distribution and for this reason, reflectors behavior is analyzed in detail hereafter.
Reflectors are some devices specifically designed for enforcing the early sound, which plays a fundamental role in affecting sound perception, as has already been explained. It has been proved that a system of more components separated from each other by gaps is more effective in enhancing the way we perceive sound rather than an entire continuous surface. Infact, with no open area above the zone the sound comes from, “strong directional reflections may cause the specularity effect of comb filtering and image shifting, because the specular reflections contain the same frequency content as the direct sound and are displaced in time”14. An
array solution allows to avoid these undesired effects thanks to the gaps among the panels. Since the amount of open area and thus the relative density of panels, are properties able to optimize reflectors performance, we have to investigate about their precise characteristics. In order to understand the precise behaviour of an array of reflectors, the simplified theory by Rindel is explained below. Given five rows of rectangular flat reflectors, placed at the - tR (r)=ρr, expressed in seconds, is the time
delay in which the early reflected energy linearly decreases according to this theoretical model and it depends on both the source-receiver distance r and the church typology factor ρ;
- γ=(1-α)(1-s)/∆t with α and s as the mean absorption and scattering coefficients, ∆t is the time gap between the direct sound and the first reflection. t
The architecture of a church is more complex and leads to different sound paths, especially if we talk about early reflections. Infact, the presence of elements such as chapels, aisles, apses and columns, contributes to weaken the early energy. Furthermore, the complexity of
573 same height from the floor in a x-y plane,
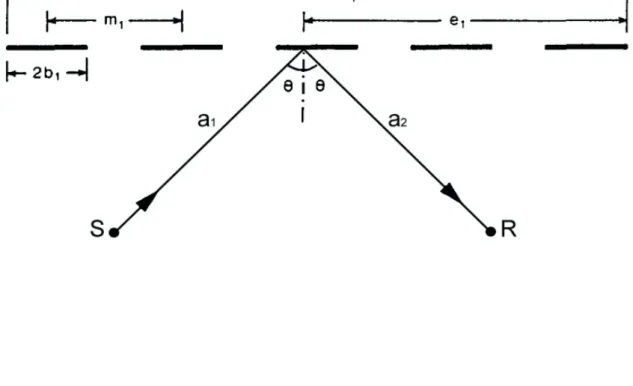
the purpose is to investigate how diffraction phenomena reduce reflected energy at the different frequencies. A sound wave is emitted from a source S and it arrives to a receiver R after being reflected on the overhead canopy (Fig 1).
Frequency response is divided in two fields, determined by fg:
Fig. 1 Specular reflection from an array of reflectors with five rows of panels (see text for details)
where:
- c is the sound velocity in the, assumed as 343 m/s air at 20°C;
- S is the surface area, in m2;
- a*=(2a1a2)/(a1+a1) is the characteristic
distance in meters, a sort of average
between source-panel and panel-receiver paths (Fig.1);
- θ is the angle of incidence (Fig. 1).
Above fg, it’s very important the contribution of the single reflector because at high frequencies there are strong local variations whether the sound ray geometrically hits the surface or not. Below fg, instead, the role played by the single component becomes less relevant because at low frequencies what it’s important is just the relative density of the
574 whole array system.
The attenuation due to diffraction has the following expression:
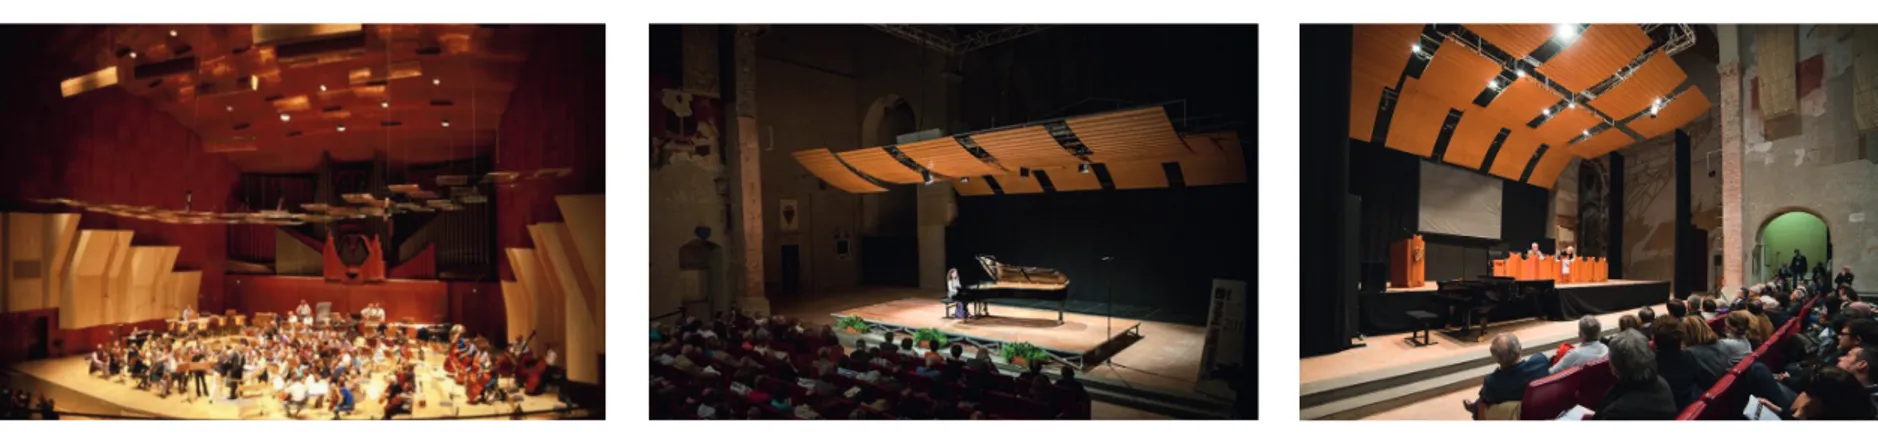
Since its inauguration, this auditorium has been always criticized by musicians. Their complaints were about difficulty to hear each other sufficiently, namely a bad level of ensemble. The successful design for the hall was made in accordance with the best results from Rindel experiments. The improvement included the introduction of an array of 61 small suspended reflectors. The new reflectors are wide 1,4 m and their upper limiting frequency is approximately 1200 Hz. The reflectors are bowed about 80 mm in the longitudinal direction in order to let the reflections from each row overlap those from the next row. (Fig.2)
Another significant example of acoustic renovation of a space by the aid of panels arrays is an Italian case. San Domenico basilica has become one of the most significant monuments in Foligno since it was converted into an auditorium in 70’s16. It is a clear
example of a former church that, thanks to an appropriate intervention design, has become an important multipurpose hall, still mantaining its architectural peculiarity visible. Measurements results showed a too much long reverberation time, insufficient clarity and inappropriate STI but also low IACC values and a good spatial impression. The intervention include two main devices: a system of reflecting panels and a removable absorbing curtain that respectively vertically and horizontally divide the volume. The high number of seats permits to not insert
further absorbing surfaces; the occupied hall has a good reverberation time only because of the audience presence. The array of reflectors in San Domenico is one of the most successful case of this kind of device. Their height and tilt may regulated in order to meet the needs of every possible activity in the hall (Fig. 2).
IV. Acoustics design of the case study
Results found out through measurements campaign shows reverberation values too much high, looking both at the parameters linked with sound perception (EDT) and at the objective index (T30). It is recommended to obtain a reverberation time at least smaller than the actual one, which is 2,4 s averaged over all the frequencies octave bands. Evaluating the current T30 trend, the aim is to “shift” it downward by around 0,7 - 0,8 s in order to bring it at least closer to the desired values. Similarly, about EDT, it is suggested to get a value decreased 0,7 - 0,8 s compared with current situation. In addition to reduce late reflections by means of decreasing reverberation time, it’s possible to improve clarity for music (C80) and definition for speech (C50) strengthening early reflections. Actually, fortifying the first energy is one of the most important tasks in this work. A consequence to C80 and C50 enhancement should be the the decreasing of TS and the increasing of STI, since this last index is helped by the improvement of speech intelligibility. The three source positions which have been where:
- K is a quantity less than 1 that reduces the energy reflected from an ideal infinite surface, which is taken as reference point (similarly to the case of a single panel);
- K1 and K2 respectively correspond to x direction and y direction sections of reflectors system. In view of the difference between high and low frequencies, Rindel proposed this approximation:
Here μ is the relative density, defined as μ=Spanels/Stot , where Spanels is the area of all the reflectors and Stot is the total area covered by the array. This model has been convalidated by Rindel by means of some experimental measurements15. His goal was to discover the
link between setted parameters and changings of array effect. Hence, he investigated about the link between some variables, such as relative density μ and panel size S, and the whole device performance.
An example of acoustic correction complying with the principles conceived by Rindel is the Danish Radio concert hall in Copenhagen (Fig.2).
575
Fig. 2 Acoustic interventions in Danish Radio concert hall by Rindel (left) and in San Domenico in Foligno by Cocchi (right and centre)
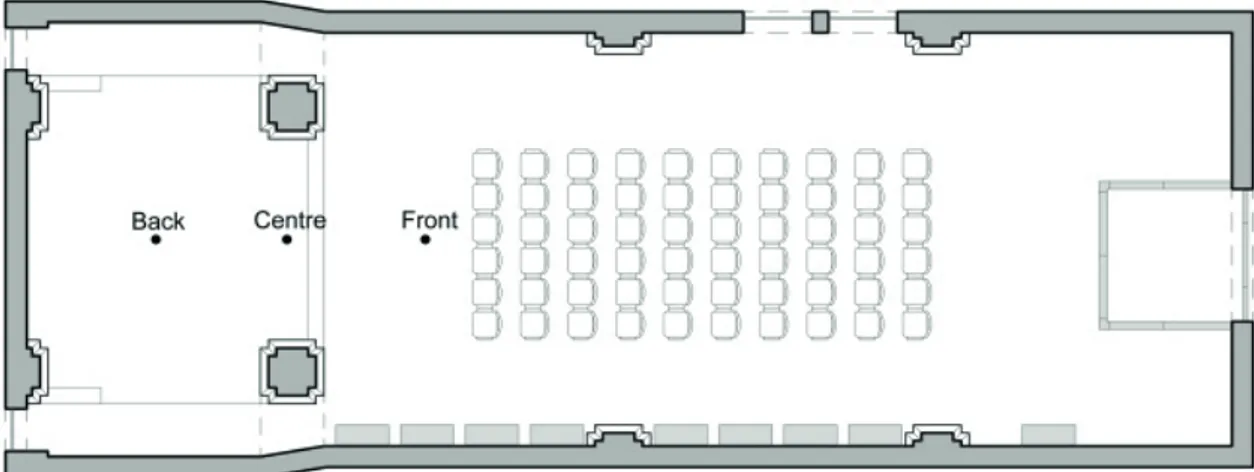
576 selected to evaluate in the whole work,
correspond to three typologies of sources. In particular, Front and Back source positions represent instruments, for instance, some strings (strings) and a piano (Érard, in this case). Whereas Centre source position represents a speaker.
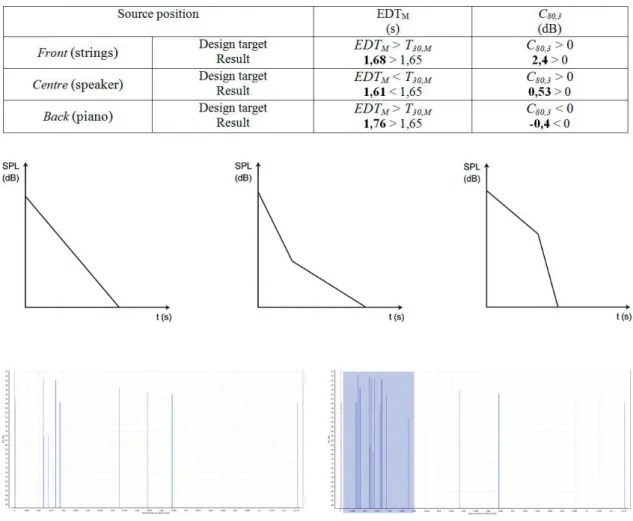
Thus, the first two positions need the proper acoustic condition that are required for music, while the third position needs the right acoustics for a good speech definition. Talking about perceived reverberation, EDT should be high for the instruments and low for speech. Terms “high” and “low” mean higher or lower than the corresponding T30 value. About clarity, instead, C80 should be high for the speech intelligibility but for instruments, it depends also on the nature of the sound. Hence, a piano needs a low clarity, a violin need a high clarity where “high” and “low” respectively mean above and below 0 dB. (Fig.3)
Design target of room criteria EDTM and C80,3 depending on source typologies and positions, are provided hereafter:
Reverberation times is decreased by means
Fig. 3 Source positions layout of the introduction of sound absorbing
materials, furthermore at the same time clarity is improved installing an array of suspended
577 reflecting panels. The introduction of new
furniture leads to decrease late reflections and thus, the reverberation time. A curtain that covers the two service doors near the audience and a carpet all over the floor, except on the platform, play the role of middle-high frequencies absorbing surfaces. The installation, under the last four rows, of a light wooden platform allow to obtain, thanks to wood properties, a low frequencies absorber. At the same time they improve perceived sound in the farthest seats by raising them into a better position. In practice, in the software Odeon Room Acoustics17 further materials have been
introduced and assigned to the new elements; scattering and absorption coefficients are provided in table 1.
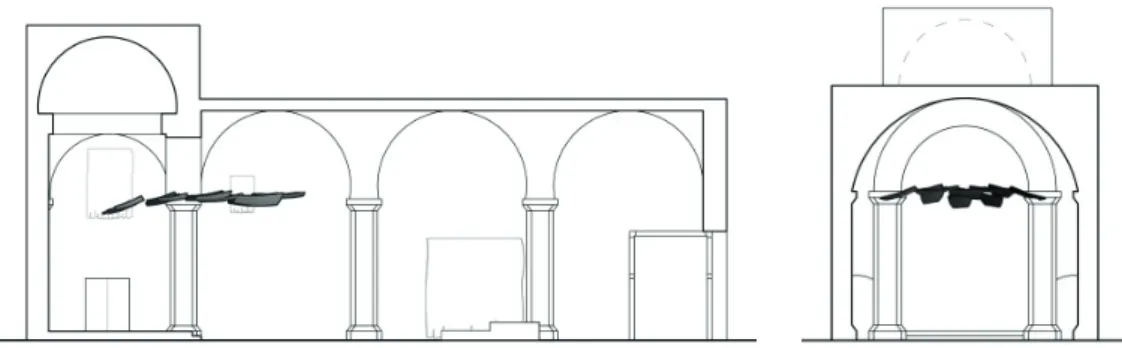
About the panels array, its main purpose is shorten first reflections paths in order to increase early-to-late indicators, in particular, in the farthest rows of listeners. Moreover, reflectors are able to play other important roles, such as vibrating at their own resonance frequencies (absorbing a few of sound energy at these octave bands), breaking the unwanted focussing effect due to vaults and interrupting normal modes paths (changing the wave theory boundaries conditions). Putting more elements together in a panels array, the attention should be focused on the relative density μ=Spanels/Stot , the number of panels N and their size S. (Tab. 1) The position chosen for the installation is the
space comprising half of the dome area and half of the first vault in the nave, namely the space above the three main sources Front, Centre and Back. The height of the whole reflectors system, beside the need for a correct path length of reflected rays, should respect some limits, such as avoiding the beam path from the projector to the screen and remaining under the level of the steel bars. For panels material, the choice fell on a plastic because it’s light, cheap and enough deformable. Distinct configurations of the array design are investigated to found out the best set up. In view of Comparisons conducted among their behaviors, two main considerations can be drawn:
- given a panel size S, the best setting is that one with the highest relative density μ; - given a density μ, the best size panel S is
the smallest.
The layout consisting of 20 panels (μ = 50%
and S < 2 m2) has been selected as the best
of all Configurations investigated. Taking into account only this setting, corrections about surfaces tilt and shape have been determined by using 3D Reflector Coverage (Fig. 4) tool in Odeon software in order to further increase clarity. (Fig. 4)
The first expedient is to rotate the lateral reflectors along the longitudinal direction. As a rule of thumb, in view of the central position of seats throughout the nave, the more a surface is lateral within the array organization the more it should be tilted, in order to direct sound precisely towards the listeners. Another important action is bending all the reflectors because curved surfaces better diffuse sound throughout the area concerned. While flat elements generate a clear reflection beam, bowed panels allow to spread the sound, even if the strength of reflected amount of energy Tab. 1 Scattering (s) and absorption (α) coefficients of new elements introduced into the auditorium. Values have been chosen evaluating comparable materials or by experience
578 slightly decreases. The goal is to weaken the
undesired effects due to strong discrete early reflections, such as the lack of evenness of the first energy received and focusing issue. After that, always trying to uniformly diffuse energy, in each row some pairs of panels are moved a little backward breaking the regularity of the single row. In the same way, the remaining couples of reflectors are lowered, still respecting the constraints mentioned before. Screenshots from the work space of CAD file reported in figure 5 display the final layout of the array.
In order to quantify the improvement gained through design choices, results, which are predicted by numerical simulations with the aid of Odeon software, are compared with the same acoustic quantities assessed in analysis phase. Basically, after the enhancement, the quality of the acoustics has become ideal for music listening and good for speech intelligibility.
V. Discussion
Simulated post-operam results are in line with Rindel’s theory about arrays of reflectors. The fact that a small panel gives better effects rather than a bigger one is confirmed by calculations of fg values for the panel size selected. Choosing quite small panels, an upper limit that exceeds 2000 Hz is obtained. This means that only above this threshold
there are the typical problems connected Fig. 4 3D Reflector Coverage tool in Odeon. Effect of reflectors array with sound source in Centre position (speaker)
579
580 with high frequencies. In other words, a
restricted range of reliable octave bands (only 4000 Hz) is affected by the dependence on the single panel contribution. For almost all the octave bands we are intersted in, the frequency response is quite even and there is not difference whether the sound ray hits the single reflector or not. At the same time, it’s possible to adfirm that choosing a density value as μ= 50%, the energy reflected is only 6 dB weaker than an ideal reflection. Thus, reflectors behave in an efficient way. About the requirements for each kind of sound source, tasks fixed before the design development, have been achieved. Outcomes for Front, Centre and Back positions are reported in table 4. The relation between EDTM and T30 for the three typologies of sources correspond to the different behaviours in multi-decay curves (Tab. 2 , Fig. 6).
Moreover, in order to understand how sound pressure level is distributed as a function of time after the design actions, Odeon Room Acoustics offers the facility that allows to visualize reflectograms. Diagrams of reflectograms before and after the intervention display an higher density in the first time gap (Fig. 7). This demonstrates that the early reflections increase after the renovation. The receiver point has been selected in the centre of the audience area. The higher density of early reflections after the intervention is
Tab. 2 Achievement of targets for each kind of sound sources. Comparisons between the ideal range of EDTM and C80,3 and simulated
parameters after the intervention
Fig. 6 Target curves for Front (strings), Centre (speaker) and Back (piano) source positions
Fig. 7 Reflectograms for Back source (piano) position before and after treatments
581 highlighted in rectangulars.
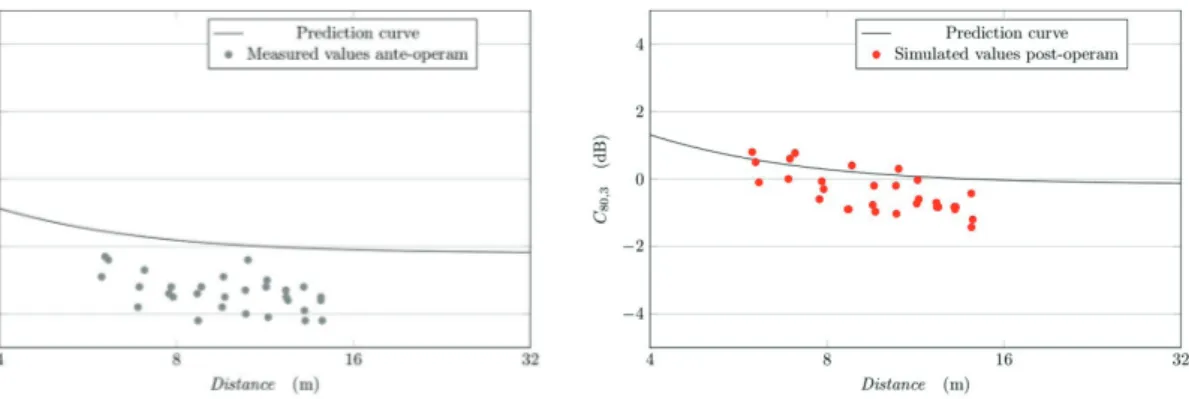
Last consideration about the new sound energy distribution obtained through the interventions is on the changes of clarity in the space. While in the analysis it was clear that the behavior of C80 index was more similar to that one of a church rather than that one of a concert hall, now trends reveal a crucial aspect. Before treatments Centre and especially Back positions were not in line with prediction curves conceived by Barron’s studies and only Front source recorded results fitting with them. The reason that explains this phenomenon is the coupled effect due to the dome of the former church. Testing the simulated results after the correction design, trends for each of sources position fit with Barron’s theory curve, as can be seen in figure 8. This means that the introduction of new devices, in particular the array of reflectors, weakens the undesired effect due to the dome presence.
Figure 8 displays the different behavior of
Back source, which is the most affected
by the coupled volume, before and after the intervention. Conclusively, after the improvements, the acoustic quality of the auditorium is not that one of a church but it shows the attributes that are typical of a concert hall.
Fig. 8 C80,3 trends changes before and after treatments for Back source
582
VI. Conclusions
The present work is the answer to an actual matter, the inadequacy of the auditorium in Budrio. This hall, which still has the original architectural aspect of a church, is exploited as a branch of Ocarina Museum, as a concert space, a meeting room, a cinema and a conference place. Nevertheless, musicians, common people and technicians perceive some defects concerning an insufficient sound clarity, difficulties in comprehending speech and the lack of a proper illumination. Results gained by a measurements campaign according with technical standards confirmed what dimensional, structural and material characteristics already may suggest: a too long reverberation time and a poor clarity, which are recurring traits inside churches, turned out to be the most significant reasons behind complaints on a bad acoustics. Comparisons between acoustic measured values and theoretical models concerning concert halls (Barron and Lee’s revised theory, 1988) and churches (Cirillo and Martellotta’s revised theory, 2005) have been conducted. The auditorium in study still has a global acoustic condition that is typical of a church and thus it’s not suitable for the functions it is used for. The acoustic aim has been to optimize objective parameters - especially those ones concerning the perceived reverberation, the sound clarity and the speech definition - for each kind of sound sources considered:
the piano placed under the dome, violins in the nave and speakers in a halfway position. Every step of design development has been determined in detail and controlled with the aid of acoustic simulation with ray tracing hybrid method (Odeon Room Acoustics). The acoustic intervention includes sound absorbing materials to decrease reverberation and an array of suspended reflecting panels to enhance clarity. Acoustic simulated results display the achievement of distinct intended purposes for every type of source and, at the same time, show how the treatments change the global behavior of sound distribution: from a typical inadequacy related to church features to an acoustic quality worthy of a concert hall.
Acknowledgements
The authors wish to thank the mayor of Budrio Giulio Pierini, Manuel Giannini, Giovanni Chessa, Luca Ricci and the Cocchi Foundation for their precious comments and their kind collaboration.
Notes:
1. D. Lubman and B. Kiser, “The history of western civilization told through the acoustics of its worship spaces”, Proceedings of International Conference on Acoustics, ICA, Rome, 2001 2. M. Kleiner, D. L. Klepper, and R. R. Torres, Worship space acoustics. J. Ross Publishing, 2010
3. V. O. Knudsen and C. Harris, Acoustical Designing in Architecture. Acoustical Society of America, 1950
4. F. Martellotta, “A multi-rate decay model to predict energy-based acoustic parameters in churches,” The Journal of the Acoustical Society of America, vol. 125, no. 3, pp. 1281–1284,
2009
5. L. Álvarez-Morales, T. Zamarreño, S. Girón, and M. Galindo, “A methodology for the study of the acoustic environment of catholic cathedrals: Application to the cathedral of malaga,” Building and Environment, vol. 72, pp. 102–115, 2014 6. F. Martellotta, E. Cirillo, A. Carbonari, and P. Ricciardi, “Guidelines for acoustical measurements in churches,” Applied Acoustics, vol. 70, no. 2, pp. 378–388, 2009
7. Magrini, Anna, and Paola Ricciardi. “Churches as auditoria:
analysis of acoustical parameters for a better understanding of sound quality.” Building Acoustics 10.2 (2003): 135-157
8. Berardi, Umberto. “Simulation of acoustical parameters
in rectangular churches.” Journal of Building Performance
Simulation 7.1 (2014): 1-16
9. De Sant’Ana, D.Q. and Zannin, T.P.H., “Acoustic evaluation of a contemporary church based on in situ measurements of reverberation time definition and computer-predicted speech transmission index.” Building and Environment, 46 (2011): 511–517
10. UNI EN ISO 3382 Acoustics – Measurement of Room Acoustic Parameters. Part 1: Performance Spaces, International Organization for Standardization, Geneva, 2009
11. M. Barron and L.-J. Lee, “Energy relations in concert auditoriums,” The Journal of the Acoustical Society of America, vol. 84, no. 2, pp. 618–628, 1988
12. E. Cirillo and F. Martellotta, “Sound propagation and energy relations in churches,” The Journal of the Acoustical Society of America, vol. 118, no. 1, pp. 232–248, 2005
13. T. J. Cox and P. D’Antonio, Acoustic absorbers and diffusers: theory, design and application. Crc Press, 2009
14. P. D’Antonio and T. Cox, “Technical bulletin on the design of overhead canopies for music and speech using the waveform system,” 2004
15. J. H. Rindel, “Design of new ceiling reflectors for improved ensemble in a concert hall,” Applied Acoustics, vol. 34, no. 1, pp. 7–17, 1991
16. G. Chiuini, Teatri storici in Umbria: l’architettura. Electa, 2002
17. Odeon 12 Combined Edition. ODEON Room Acoustics Software, 2012