https://doi.org/10.1007/s00429-019-01893-x
ORIGINAL ARTICLE
Mapping the structural connectivity between the periaqueductal gray
and the cerebellum in humans
Alberto Cacciola1 · Salvatore Bertino1 · Gianpaolo Antonio Basile1 · Debora Di Mauro1 · Alessandro Calamuneri2 · Gaetana Chillemi2 · Antonio Duca2 · Daniele Bruschetta1 · Paolo Flace3 · Angelo Favaloro1,3 ·
Rocco Salvatore Calabrò2 · Giuseppe Anastasi1 · Demetrio Milardi1,2
Received: 7 January 2019 / Accepted: 21 May 2019 / Published online: 5 June 2019 © The Author(s) 2019
Abstract
The periaqueductal gray is a mesencephalic structure involved in modulation of responses to stressful stimuli. Structural connections between the periaqueductal gray and the cerebellum have been described in animals and in a few diffusion tensor imaging studies. Nevertheless, these periaqueductal gray–cerebellum connectivity patterns have yet to be fully investigated in humans. The objective of this study was to qualitatively and quantitatively characterize such pathways using high-resolu-tion, multi-shell data of 100 healthy subjects from the open-access Human Connectome Project repository combined with constrained spherical deconvolution probabilistic tractography. Our analysis revealed robust connectivity density profiles between the periaqueductal gray and cerebellar nuclei, especially with the fastigial nucleus, followed by the interposed and dentate nuclei. High-connectivity densities have been observed between vermal (Vermis IX, Vermis VIIIa, Vermis VIIIb, Vermis VI, Vermis X) and hemispheric cerebellar regions (Lobule IX). Our in vivo study provides for the first time insights on the organization of periaqueductal gray–cerebellar pathways thus opening new perspectives on cognitive, visceral and motor responses to threatening stimuli in humans.
Keywords Connectome · CSD · Diffusion MRI · White matter · Tractography
Introduction
The periaqueductal gray (PAG) is an important neuronal station situated in the mesencephalon, surrounding the Syl-vian aqueduct. According to the present knowledge, it prob-ably works as a main control station for innate and acquired responses to stressful stimuli such as fear, anxiety and pain, by coordinating and integrating appropriate vegetative and behavioral responses (Carrive 1993; Fanselow et al. 1991; Tovote et al. 2016; Walker and Carrive 2003). The current opinion is that PAG is a downstream regulatory station involved in a circuit including the prefrontal cortex (PFC),
amygdala and hippocampus, exerting a descending control on the spinal cord (Bandler et al. 2000; Sokolowski and Cor-bin 2012; Tovote et al. 2015; Furlong et al. 2016). Although some of the aspects of this complex response to stressors are relatively well known (McMullan and Lumb 2006), the way PAG coordinates some complex motor responses, such as freezing behavior (Roelofs et al. 2010; Roelofs 2017), is still subject of debate.
Anatomical connectivity between PAG with the cerebel-lum has been subject of interest in the past decades and has been investigated by means of tract-tracing techniques (Chan-Palay 1977; Dietrichs 1983).
Animal studies demonstrated that PAG and cerebel-lum are connected both directly and indirectly (Watson et al. 2016). Connections joining the cerebellar cortex and nuclei with PAG were first described in monkeys (Chan-Palay 1977). A few years later, a direct connection between PAG and some cerebellar sub-regions was dem-onstrated using fiber tracers in cats (Dietrichs 1983) and, more recently, in rabbits, between PAG and flocculus folio P (Nisimaru et al. 2013). In addition, neurophysiological
* Alberto Cacciola
1 Department of Biomedical, Dental Sciences
and Morphological and Functional Images, University of Messina, Messina, Italy
2 IRCCS Centro Neurolesi “Bonino Pulejo”, Messina, Italy 3 School of Medicine, University of Bari ‘Aldo Moro’, Bari,
findings of a strong coupling between PAG and cerebel-lar functions have also been provided in rats (Koutsikou et al. 2014).
According to these evidences, PAG may modulate cer-ebellar activity via three distinct, either direct or indirect, ways: (1) by controlling sensory afferent spino-cerebellar projections; (2) by modulating the output response of cer-ebellar nuclei; (3) by regulating spinal reflex circuits (Cer-minara et al. 2009; Koutsikou et al. 2014, 2015, 2017).
In humans, the development of novel magnetic resonance imaging (MRI) sequences and signal modeling techniques has provided important contributions to the study of the functional neuroanatomy of PAG (Menant et al. 2016). In this regard, functional MRI (fMRI) studies demonstrated high statistical dependencies between PAG and cerebellum both in healthy (Kong et al. 2010; Coulombe et al. 2016; Faull and Pattinson 2017) and pathological conditions (Case et al. 2017).
On the other hand, diffusion-weighted imaging (DWI) and tractography represent powerful tools to trace struc-tural connections non-invasively and in vivo (Cacciola et al. 2016, 2017a, c, d, 2018, 2019; Milardi et al. 2016a, b,
2017; Arrigo et al. 2018; Calamuneri et al. 2018), by esti-mating diffusion properties of magnetically labeled water molecules along myelinated axons (Basser et al. 1994; Henderson 2012). Several tractography studies explored the structural connectivity of PAG in humans (Sillery et al.
2005; Hadjipavlou et al. 2006; Owen et al. 2007, 2008; Ezra et al. 2015), though only a few characterized either direct or indirect pathways between the PAG and cerebel-lum (Sillery et al. 2005; Hadjipavlou et al. 2006; Owen et al. 2008).
In particular, Sillery and colleagues (2005) found direct connections between PAG and cerebellum using probabilis-tic tractography with 1.5 T MRI on seven healthy subjects. Similar connections were described by Owen and coworkers (2008) in two out of four patients with deep brain stimula-tion (DBS) electrodes implanted in PAG for treating chronic pain.
However, to the best of our knowledge, none of these studies precisely characterized the topographical distribu-tions of connecdistribu-tions between the PAG and the cerebellar subregions. Therefore, aim of the present study was the sys-tematic investigation and characterization of the structural connections between PAG and both the cerebellar cortex and nuclei. We employed multi-shell, high-angular resolution diffusion MRI (HARDI) data of 100 healthy subjects from the WU-Minn Human Connectome Project (HCP) reposi-tory combined with constrained spherical deconvolution (CSD) signal modeling. Herein, we provide comprehensive qualitative and quantitative descriptions of the connectivity patterns between the PAG and cerebellum.
Materials and methods
Subjects and data acquisition
High-quality structural and diffusion MRI data from the HCP repository have been employed. We obtained data for 100 healthy subjects (males = 46, females = 54 age range 22–36 years). Data were acquired by the Washington Uni-versity, University of Minnesota, and Oxford University (WU-Minn) HCP Consortium (Van Essen et al. 2013). All the HCP subjects were scanned using a Siemens 3T Skyra scanner previously modified with a Siemens SC72 gradi-ent coil and stronger gradigradi-ent power supply with maxi-mum gradient amplitude (Gmax) of 100 mT/m (initially 70 mT/m and 84 mT/m in the pilot phase), with the aim of improving diffusion imaging (Van Essen et al. 2013). The structural scans included T1-weighted acquisitions with the following parameters: TE = 2.14 ms, TR = 2400 ms, voxel size = 0.7 mm. (Uǧurbil et al. 2013). Diffusion-weighted images were acquired using a single-shot 2D spin-echo multiband echo planar imaging (EPI) sequence and equally distributed over three shells (b-values of 1000 s/mm2, 2000 s/mm2, and 3000 s/mm2), with isotropic
spatial resolution of 1.25 mm (Sotiropoulos et al. 2013). Data employed in this study were downloaded in the minimally pre-processed form consisting of: normaliza-tion of b0 image intensity across runs, registration of b0 images to T1w acquisition and other corrections, such as those for EPI susceptibility, eddy-current-induced distor-tions, gradient nonlinearities and subject motion (Glasser et al. 2013).
MRI post‑processing
Both structural and diffusion images were post-processed to perform tractography. Briefly, structural images under-went brain extraction (Smith 2002) and cortical and sub-cortical segmentation (Patenaude et al. 2011; Zhang et al.
2001) using BET, FAST and FIRST tools in FSL (Smith et al. 2004). The obtained masks were visually inspected and, if needed, modified by a trained neuroanatomist. A five-tissue segmented image was then obtained and used to run multi-shell multi-tissue CSD (MSMT-CSD), an improvement of CSD signal modelling technique, in which fiber orientation distribution function (fODF) is estimated directly from deconvolution of diffusion-weighted signal with a reference single-fiber response function (Tournier et al. 2007, 2008). The MSMT-CSD modelling tech-nique represents a variant designed to support multi-shell data and to overcome classical CSD limitations when it comes to estimate fODF in the presence of tissue-type
heterogeneity (Jeurissen et al. 2014). Estimation of fODF and tractography were performed using the MRtrix soft-ware (http://www.mrtri x.org) (Tournier et al. 2012). Region of interest (ROI) segmentation
To obtain useful ROIs for tractography (see paragraph below), both automated and semi-automated segmentation methods were used. The steps followed to obtain ROIs are listed in the following pipeline.
1. The ROIs were warped from MNI space to subject native space for each of our 100 subjects as follows: FSL’s FLIRT tool was applied to obtain a liner registration, and then a nonlinear registration (FSL’s FNIRT tool) was obtained from the affine registration of the previous step. The non-linear transformation was used to warp ROIs from MNI space to subject space.
2. The ROI of the PAG was obtained from the Keuken and Forstmann’s 7T atlas that provides ROIs obtained from high-resolution MP2RAGE and FLASH scans warped in MNI space (Keuken and Forstmann 2015) available at
https ://www.nitrc .org/proje cts/atag/. Once the ROI was resliced in the MNI space, a probability threshold of 50% was set employing the FSL’s command fslmaths. 3. Cerebellar ROIs were obtained using SUIT Atlas (http://
www.diedr ichse nlab.org/imagi ng/suit.html), a free prob-abilistic atlas of the human cerebellum in a dedicated space (SUIT space) designed to improve the alignment of infratentorial structures in respect to conventional MNI space (Diedrichsen et al. 2009, 2011; Diedrichsen
2006). We ran the segmentation pipeline for each subject using SUIT toolbox on SPM12 (Ashburner and Friston
2011) and obtained a large cerebellar ROI including cer-ebellar cortex and nuclei, from which we extracted all the cerebellar lobular and nuclear ROIs (Fig. 1). 4. The cerebellum was parcellated in 34 regions of interest
(six nuclei and 28 cerebellar cortex sub-regions
includ-ing lobules and vermis) usinclud-ing SUIT (Diedrichsen et al.
2009). The whole PAG was considered as a median structure whilst the cerebellar cortex parcellation pro-vided 12 subregions for each cerebellar hemisphere (Crus I, Crus II, Lobules I–IV, Lobule V, Lobule VI, Lobule VIIb, Lobule VIIIa, Lobule VIIIb, Lobule IX, Lobule X, dentate nucleus, interposed nucleus, fastigial nucleus), whereas the vermis was further subdivided in eight lobules (Vermis Crus I, Vermis Crus II, Vermis VI, Vermis VIIb, Vermis VIIIa, Vermis VIIIb, Vermis IX, Vermis X) (Fig. 1).
5. The cerebral grey matter (GM) previously obtained from FAST was also used as exclusion mask to filter out tracts that were not directed to cerebellar or brainstem grey matter, thus avoiding erroneous assignments (Verstynen et al. 2011, see below). The obtained grey matter mask was manually edited and then resliced into each subject’s native space using FLIRT tool on FSL.
6. Finally, since the high spatial proximity between PAG and the quadrigeminal plate (inferior and superior col-liculi) could generate spurious tracts, e.g. from tectocer-ebellar pathways, we manually defined the quadrigemi-nal plate as region of avoidance (ROA). This ROA was outlined by a trained neuroanatomist on the MNI152 template and then warped it in subject’s native space using FLIRT tool on FSL.
All the aforementioned ROIs and ROAs were visually inspected and, if needed, manually modified for each subject by one of the authors.
Tractography
Tractography was performed in the native space of each subject using the following pipeline: first, we reconstructed 1 million tracts using the PAG ROI as seed region, the large cerebellar ROI as inclusion mask (MRtrix’s -include option), the brain GM and quadrigeminal plate ROIs as
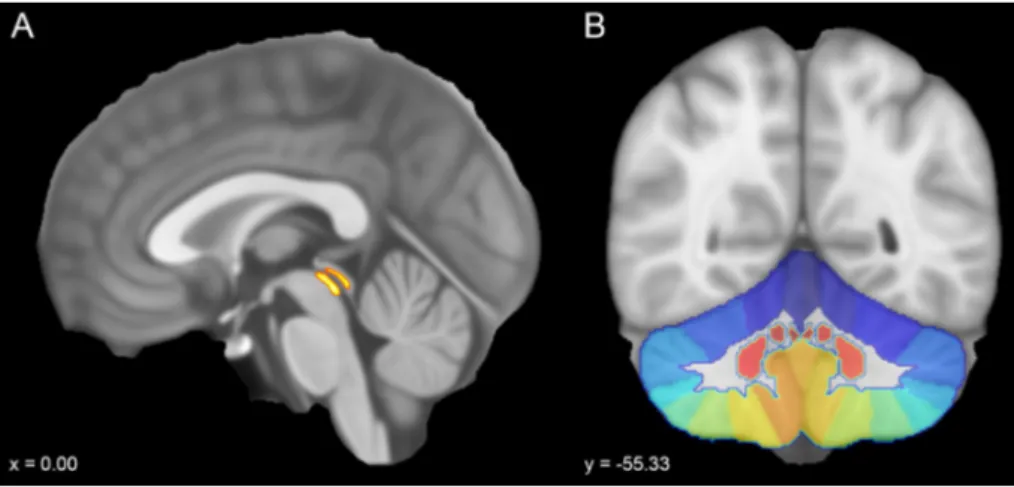
Fig. 1 Sagittal and coronal sec-tions of the MNI152 template (voxel size 0.5 mm). a ROI of the periaqueductal grey taken from the probabilistic atlas of the basal ganglia by Keuken and collegues was overlaid on the mid-sagittal plane. b Coronal view showing a colored scale of the vermal and hemispheric subregions provided by SUIT atlas
exclusion masks (-exclude option) and IFod2 as fiber-tracking algorithm (Tournier et al. 2012).
In our study, spherical harmonic degree was fixed equal to six to obtain robustness to noise. During tractography, tracking was stopped in one of the following conditions: step size = 0.2 mm, maximum angle = 10°, minimal fODF amplitude = 0.15. This is a more conservative choice with respect to usual standards, since we preferred to underes-timate fiber bundles to have more consistent reconstruc-tions (Cacciola et al. 2017b; Descoteaux et al. 2009; Rizzo et al. 2018; Tournier et al. 2011). Once obtained 1 mil-lion streamlines between PAG and cerebellar ROI, tracts were “filtered out” using each single cerebellar lobular and nuclear ROI as inclusion mask and all the others as exclusion masks, and thus extracting single connections of interest between each cerebellar target region and PAG. It is worthy to note that we extensively used appropri-ate regions of avoidance (-exclude option) for an accurappropri-ate extraction of streamlines of interest, and to avoid errone-ous tract assignation (Verstynen et al. 2011).
Connectivity analysis
Connectivity measures were obtained using in-house scripts built with MATLAB software package (http:// www.mathw orks.com), release 2015b. At first, the num-ber of streamlines (NOS) connecting PAG to cerebellar regions was assessed. We defined connectivity density (δ) of each pathway of interest as the contribution of each target region, respectively, to the total NOS. With some limitations (Smith et al. 2013), such numbers are used as markers of connectivity density, both in healthy and patho-logical conditions (Behrens and Sporns 2012; Bijttebier et al. 2015; Guo et al. 2016; Zhang et al. 2017).
Since connectivity between seed region and regions of interest (ROI) is subjected to volume biases (Cheng et al. 2012), we extracted seed and target ROI vol-umes to scale the NOS by the mean volume of the two ROI involving each pathway thus computing a normal-ized connectivity density not affected from the volume bias (δNORM). Hence, removing ROI volume contributions,
we could estimate connectivity density profiles that are less sensitive to individual volumetric differences.
To summarize the distribution of the connectivity den-sity for each reconstructed pathway, we computed the mean normalized density (δNORM) and standard deviation
(SD) from individual subject profiles.
Furthermore, for each connectivity density measure and for each pathway reconstructed, we assessed the inter-subject variability by means of coefficient of vari-ation (COV), which was defined as the ratio of the SD to the δNORM estimated.
Finally, a lateralization index (LI) (Parker et al. 2005) was calculated for assessing lateralization in the investigated pathways as follows:
Positive values of LI indicate left lateralization (LI > 0.1), whereas negative values indicate right lateraliza-tion (LI < 0.1). For each pathway, to assess statistically sig-nificant lateralization, permutation tests based on a t-statis-tic were performed using the connectivity profiles of each hemisphere gathered from each subject. 50.000 permutations were used to estimate the distribution of the null hypoth-esis, alpha level was set to 0.05, and the “tmax” method was adopted to correct the p values of each variable for mul-tiple comparisons (Blair and Karkiski 1993).
Results
To better summarize our results, we grouped cerebellar sub-regions following the structural and functional anatomical subdivision of the cerebellum described by Stoodley and Schamamann (2016). Lobules, vermal regions and deep cer-ebellar nuclei have been attributed to four compartments: (1) anterior cerebellum (Lobules I–IV, V), (2) posterior cerebel-lum (Lobules and Vermis VI, Crus I, Crus II, VIIb, VIIIa, VIIIb, IX), (3) flocculonodular lobe (Lobule and Vermis X), and (4) deep cerebellar nuclei (dentate nucleus, interposed nucleus and fastigial nucleus).
A first analysis focused on the morphological charac-terization of the fiber tracts connecting the PAG with the cerebellar structures. The streamlines arising from the PAG ran through the superior cerebellar peduncle and follow the arbor vitae of the cerebellum reaching nuclei, vermal regions and lobules. Connectivity patterns joining the PAG, respec-tively, with the deep cerebellar nuclei (Fig. 2), the entire vermis (Fig. 3) and lobules (Fig. 4) have been successfully reconstructed in all subjects.
A second analysis was finalized to assess quantitative structural connectivity by calculating the δNORM from
con-nectivity data as described in the Concon-nectivity analysis sec-tion. Consistent δNORM was found between PAG and all the
cerebellar subregions across hemispheres, vermis and deep nuclei here considered. However, to provide more robust results, a probabilistic threshold (δNORM > 1%) has been applied to normalized tractograms to remove false-positive results (Rubinov and Sporns 2010). However, choosing a proper cut-off value remains quite empirical and still con-stitutes matter of debate (van Wijk et al. 2010).
Thus, only connections exceeding the probabilistic threshold δNORM > 1% of the whole PAG–cerebellum tracts
LI = Left − Right Left + Right.
Fig. 2 Average track density maps showing connections between cerebellar nuclei and periaqueductal grey mapped in directionally encoded color space (DEC) and superimposed to the MNI152 tem-plate. a Axial slices showing the course of tracts joining fastigial nucleus (red) and periaqueductal grey (cyan). The tracts leave the fastigial nucleus, pass through the superior cerebellar peduncle and reach the periaqueductal grey in the mesencephalon, sparing the superior colliculi. b Axial slices showing the course of tracts between
interposed nucleus (pink) and periaqueductal grey (cyan). Tracts reach the mesencephalic periaqueductal grey via the superior cerebel-lar peduncle sparing the superior colliculi. c Axial slices represent-ing the course of connections between dentate nucleus (yellow) and periaqueductal grey (cyan). The tracts leave the dentate nucleus, run through superior cerebellar peduncles and reach the periaqueductal grey avoiding superior colliculi
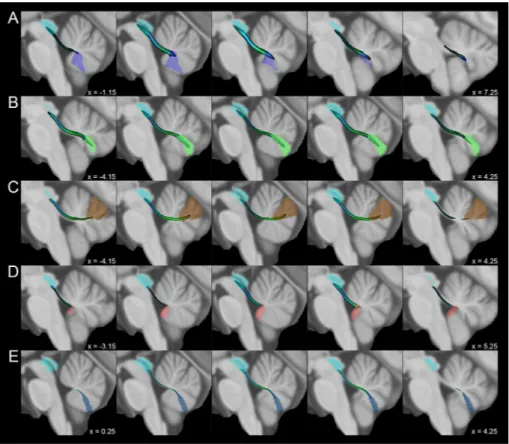
Fig. 3 Average track density maps showing tracts connecting cerebellar vermal regions and periaqueductal grey mapped in directionally encoded color space (DEC) and superimposed to the MNI152 template. a Course of tracts connecting the Vermal lobule IX (violet) and the periaqueductal grey (cyan). b Connections between Vermal lobule VIIIa (green) and periaqueductal grey (cyan). c Tracts between Vermal lobule VI (brown) and periaqueductal grey (cyan). d Course of tracts joining Vermal lobule X (pink) to periaqueductal grey (cyan). e Connections between Vermal lobule VIIIb (blue) and periaq-ueductal grey (cyan)
were considered as true positives and will be object of discussion.
Robust connectivity patterns have been demonstrated between the PAG and cerebellar nuclei: the fastigial nucleus resulted to be the most connected (right: 17.2 ± 8.4%; left: 10.5 ± 5.4%), followed by the interposed nucleus (right: 10.7 ± 6.1%; left: 4.3 ± 3.6%) and the dentate nucleus (right: 4.5 ± 3.3%; left: 1.8 ± 1.6%) (Fig. 2, Table 1).
The structures of the posterior compartment which showed consistent connectivity patterns with the PAG were the Vermis IX (12.4 ± 6.0%), Vermis VIIIa (9.9 ± 5.4%), Lobule IX (right: 9.2 ± 4.1%; left: 5.8% ± 3.0%), Vermis VI (5.1% ± 3.5%) and Vermis VIIIb (1.7 ± 1.2%), while Lobule VI, VIIIa, VIIIb, vermal and lobular Crus I, Crus II and VIIb showed an average δNORM < 1%. Connections between the PAG and flocculonodular lobe were also present with robust connections with the Vermis X (4.5 ± 3.1%) and weaker con-nectivity with Lobule X (< 1%) (Figs. 3 and 4).
The normalized connectivity density profiles are sum-marized in Table 1.
We also investigated the consistency of density percent-ages estimated from our subjects by looking at the COV. The most consistent results were obtained for the connections between the PAG and the right Lobule IX (COV = 0.44), the Vermis IX (COV = 0.48) and the right fastigial nucleus (COV = 0.49), whereas the highest variability between subjects was observed for the right dentate nucleus (COV = 0.72), the left interposed nucleus (COV = 0.84) and the left dentate nucleus (COV = 0.89).
It is worthy to note that highest COVs (one or above) often correspond to lowest values of mean δNORM, mostly under the fixed threshold of 1%. This indicates that less connected regions are, at the same time, the most variable among subjects suggesting that the application of the afore-mentioned threshold could help to distinguish reliable from unreliable connections (Roberts et al. 2017).
A third analysis was carried out to assess the connec-tivity between PAG and each cerebellar compartment. The δNORM percentage revealed a prominent connectivity to nuclear region (49.10 ± 12.78%), followed by posterior
(45.35 ± 10.24%), the flocculonodular (5.16 ± 3.23%) and anterior lobes (0.38 ± 0.30%).
Finally, the lateralization analysis, performed to assess differences between the connectivity profiles of PAG with the left and right cerebellar lobules and nuclei, revealed no significant side-to-side variations (p > 0.05).
Discussion
Our study aimed at providing new insights on the structural connectivity between the PAG and cerebellum performing MSMT-CSD tractography on high-resolution data from the WU-Minn HCP database. We observed that the PAG is highly connected with both the cerebellar cortex and deep cerebellar nuclei. To better summarize and discuss our find-ings, we will follow the structural and functional anatomical classification of the cerebellum proposed by Stoodley and Schmahmann (2009, 2010, 2016) (Fig. 5). The connectivity density profiles between PAG and cerebellar structures will be discussed following the structural classification, consid-ering the existing literature regarding PAG–cerebellar con-nectivity (Table 2). The possible functional significance of the reconstructed connectivity patterns will be discussed in the last paragraph of the discussion.
Deep cerebellar nuclei
Our connectivity analysis showed the highest strength for the connectivity patterns linking the PAG and the three deep cerebellar nuclei. While similar connections were reported in animals (Chan-Palay 1977; Koutsikou et al.
2015; Moers-Hornikx et al. 2011), to the best of our knowledge, our study represents the first evidence of the possible existence of the human analogues of these path-ways in humans. The most connected nucleus to the PAG was the Fastigial nucleus, followed by the interposed and dentate nuclei (Fig. 2, Table 1). In rats, DBS of the dor-solateral column of PAG induces panic attacks and deac-tivates the deep cerebellar nuclei (Moers-Hornikx et al.
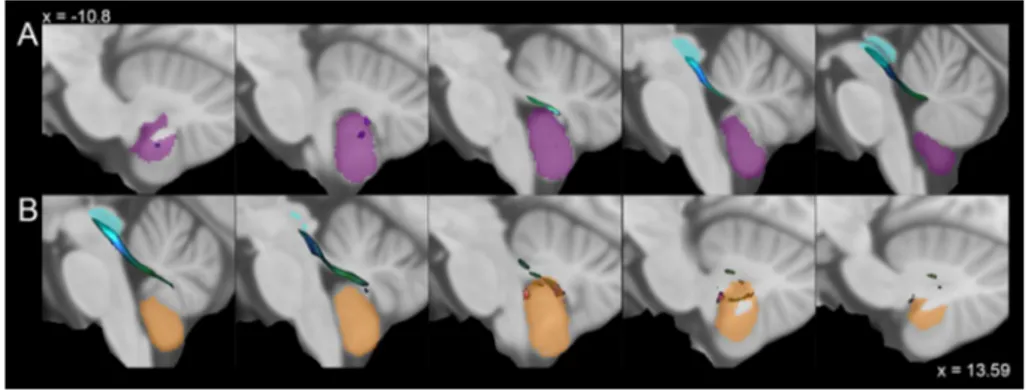
Fig. 4 Average track density maps showing tracts connecting cerebellar hemispheric regions to periaqueductal grey mapped in directionally encoded color space (DEC) and superim-posed to the MNI152 template. Sagittal views depicting tracts connecting a the left hemi-spheric Lobule IX (purple) and b the right hemispheric Lobule IX (orange) with the periaque-ductal grey (cyan)
2011), whereas stimulation of the ventrolateral column of PAG induces Fos expression in fastigial (medial) nucleus (Koutsikou et al. 2015). It is worth to note that the major-ity of tracts between PAG and cerebellum reached the fas-tigial nucleus that, in addition to its well-known motor and oculomotor functions, is also involved in regulating complex vegetative responses such as cardiovascular tone, micturition, defecation, gastro-intestinal peristalsis and
respiratory rate (Zhang et al. 2017) and is connected with limbic regions (Blatt et al. 2013). Moreover, the interposed nucleus, which retrieved high connectivity density values, also appears to play a role in fear conditioning (Sacchetti et al. 2002).
Posterior cerebellum
Lower connectivity density profiles were observed between the PAG and the posterior lobe of the cerebellum. Inter-estingly, the highest values of connectivity for the regions belonging to posterior lobe were obtained for the uvula (Ver-mal lobule IX) and ver(Ver-mal pyramis (Ver(Ver-mal lobule VIIIa and VIIIb). The uvula is a well-known component of the vestibular cerebellum and receives afferents from vestibular receptors (Barmack 2003), exerting a well-recognized role in ocular movements (Voogd et al. 2012) and in postural adjustments via the regulation of the vestibulospinal system (McCall et al. 2017). On the other hand, the vermal pyramis is a component of the motor cerebellum: Vermal lobule VIII and the hemispheric Lobules VIII and IX are somatotopi-cally organized constituting the posterior homunculus of the human cerebellum (Snider and Eldred 1951; Grodd et al.
2001). In rats, the electrical stimulation of the ventrolateral column of PAG leads to the activation of the vermal pyramis, eliciting fear-related freezing behavior, likely by influencing spinal descending neurons (Koutsikou et al. 2014). Finally, high-connectivity values were also found for Vermal lobule VI, a posterior vermis region that is part of the oculomotor vermis (Kheradmand and Zee 2011), but that also plays a role in the regulation of autonomic functions (Strata 2015) and in conditioned fear acquisition and retention (Sacchetti et al. 2004, 2007, 2009).
Flocculonodular lobe
Finally, our probabilistic tractography study revealed con-nectivity patterns between the PAG and the flocculonodular lobe. Interestingly, the flocculonodular lobe reported the lowest connectivity values compared to the other lobes. It is worth to note that connections between PAG and flocculus folio P have been previously described as part of an hypo-thalamo-PAG-cerebellar pathway in rabbits (Nisimaru et al.
2013). As it is well known, together with uvula (Vermal lobule IX), lingula (Vermal lobules I–II) and the fastigial nucleus, the flocculonodular lobe is a key structure in the so-called paleocerebellum or vestibulocerebellum, involved in the regulation of ocular movements and posture by inte-grating vestibular afferences (Barmack 2003; McCall et al.
2017; Stoodley and Schmahmann 2016; Voogd et al. 2012; Zhang et al. 2017).
Table 1 Connectivity density (%) between the PAG and cerebellar structures
Connections exceeding the probabilistic threshold δNORM > 1% of the whole PAG–cerebellum tracts are reported in bold
SD standard deviation, COV coefficient of variation, PAG
periaque-ductal gray
Normalized connectivity density
Structure Mean SD COV
Right fastigial nucleus 17.24 8.41 0.49
Vermis IX 12.43 6.02 0.48
Right interposed nucleus 10.75 6.09 0.57
Left fastigial nucleus 10.47 5.44 0.52
Vermis VIIIa 9.90 5.38 0.54
Right Lobule IX 9.20 4.07 0.44
Left Lobule IX 5.81 2.97 0.51
Vermis VI 5.07 3.52 0.69
Right dentate nucleus 4.56 3.27 0.72
Vermis X 4.52 3.14 0.69
Left interposed nucleus 4.29 3.58 0.84
Left dentate nucleus 1.81 1.60 0.89
Vermis VIIIb 1.72 1.18 0.69
Right Crus II 0.51 0.58 1.12
Right Lobule X 0.43 0.70 1.62
Left Lobule X 0.21 0.30 1.39
Left Crus II 0.18 0.20 1.10
Right Lobules I–IV 0.15 0.10 0.66
Right Lobule VIIIa 0.13 0.14 1.07
Left Lobule V 0.09 0.20 2.25
Right Lobule V 0.08 0.20 2.54
Right Lobule VIIb 0.07 0.09 1.31
Right Lobule VIIIb 0.07 0.13 1.89
Left Lobule VIIIb 0.07 0.08 1.20
Left Lobules I–IV 0.06 0.05 0.75
Left Lobule VIIIa 0.05 0.06 1.03
Right Crus I 0.04 0.06 1.63
Left Lobule VIIb 0.04 0.04 1.04
Vermis VIIb 0.02 0.03 1.44 Right Lobule VI 0.01 0.03 2.55 Left Crus I 0.01 0.02 1.25 Vermis Crus II 0.01 0.02 2.27 Left Lobule VI 0.01 0.01 1.96 Vermis Crus I 0.00 0.00 0.00
Anatomo‑functional considerations
Reactions to external threatening stimuli, such as fear and anxiety, require a complex regulation that involves the inte-gration of cognitive, vegetative and motor responses. The PAG represents the main neural hub involved in top-down
control of these responses to stressful or painful external stimuli.
One of such possible responses is the so-called freezing behavior, largely described in animals: the animal acquires a crouched posture (Blanchard and Blanchard 1969), increases its muscular tone, remains still and reduces vegetative
Fig. 5 Multiple axial sections showing cerebellum lobules grouped as functional compart-ments: sensorimotor (red), cog-nitive/affective (blue), vestibular (yellow). Deep cerebellar nuclei have been labeled as follows: dentate in purple, interposed in cyan and fastigial in green
Table 2 Evidences for the cerebellar-periaqueductal gray connectivity in animals and humans according to the existing literature
Authors (years) Species Method Findings
Chan-Palay (1977) Monkeys Fiber tracing Indirect PAG-olivo-cerebellar connections; direct fibers from dentate nucleus
Dietrichs (1983) Cats Fiber tracing Direct connections from PAG to lobulus simplex, Crus I, Crus II, paramedian lobule and posterior lobule vermis Teune et al. (2000) Rats Fiber tracing Direct connections fibers from all cerebellar nuclei to PAG Sillery et al. (2005) Humans Diffusion tensor imaging Direct PAG–cerebellar connections
Owen et al. (2008) Humans Diffusion tensor imaging Direct PAG–cerebellar connections based on pre-operative DTI for chronic pain
Cerminara et al. (2009) Rats Electrophysiology Connections with paramedian lobule and copula pyramidis Kong et al. (2010) Humans Resting-state functional MRI High functional PAG–cerebellum connectivity (unspecified
regions)
Moers-Hornikx et al. (2011) Rats Immunohistochemistry Deactivation of deep cerebellar nuclei after PAG stimula-tion
Nisimaru et al. (2013) Rabbits Electrophysiology, immunohistochemistry Hypothalamo-PAG-cerebellar neurons ending in flocculus folio P
Watson et al. (2013) Rats Electrophysiology Indirect PAG-olivo-cerebellar connections Koutsikou et al. (2014) Rats Electrophysiology Connections with Vermis VIII and pyramis Koutsikou et al. (2015) Rats Electrophysiology, immunohistochemistry Connections with medial cerebellar nucleus Coulombe et al. (2016) Humans Resting-state functional MRI High PAG–cerebellum functional connectivity
Case et al. (2017) Humans Resting-state functional MRI Higher functional PAG–cerebellum connectivity in sickle-cell disease patients vs controls
parameters such as heart rate (Carrive 2000; Fanselow
1980, 1994; Kozlowska et al. 2015). As previously outlined, this response depends on PAG activation and is related to PAG–cerebellum interactions (Koutsikou et al. 2014). More recently, a similar response was described in humans (Hage-naars et al. 2014a, b; Roelofs 2017). In particular, reduced body sway and heart rate was observed in human individuals after the presentation of visual threatening stimuli such as emotionally significant pictures or films (Roelofs et al. 2010; Hagenaars et al. 2014a). However, the neuroanatomical sub-strates of this kind of response are still not clearly character-ized in humans. Converging evidences from in vivo neuro-imaging studies suggest that freezing behavior depends on prefrontal–amygdala–PAG functional connectivity (Mobbs et al. 2010; Hermans et al. 2013), but information is still lacking about the interface between the PAG and the motor system, that appear to be necessary to elicit such a complex and immediate postural response. Recently, PAG functional connectivity was evaluated during breathlessness, which is a multidimensional biopsychological condition that is associ-ated with a strong affective component and feeling of fear and anxiety that could, in turn, lead to defensive responses such as freezing (Lansing et al. 2009; Herigstad et al. 2011; Hayen et al. 2013). A resting-state fMRI study found strong functional connectivity between the cerebellum and the ventrolateral column of PAG, in line with the present study and with previous animal findings. Interestingly, the same study performed task-related functional connectivity using psychophysiological interaction analysis in both breathless-ness and breathlessbreathless-ness anticipation conditions, revealing that the strength of functional connectivity between the cer-ebellum and PAG is negatively correlated with the perceived intensity of breathlessness (Faull and Pattinson 2017). These data, thus, suggest an important role for the cerebellar–PAG interplay in coping responses to threatening stimuli, demon-strating how its “breakdown” could lead to a worse response to dangerous situations.
In this view, and in line with previous findings in animals, our results could be seen as a possible anatomical substrate for similar responses in humans. Indeed, we showed that the PAG is highly connected with the deep cerebellar nuclei, and especially with the fastigial and interposed nuclei, which play important roles in both motor and nonmotor vegetative functions such as autonomical regulation (Zhang et al. 2017) and fear conditioning (Sacchetti et al. 2002).
Moreover, robust connectivity density profiles were reported with motion- and posture-related cerebellar regions: the aforementioned deep cerebellar nuclei, vestibulocerebel-lar regions such as uvula and nodulus (Vermis IX–X), and vermal pyramis (VIIIa and VIIIb). Therefore, our results further reinforce the current idea of the involvement of pos-terior cerebellar vermis in fear conditioning, acquisition and retention (Sacchetti et al. 2002, 2004, 2007, 2009).
The structural connectivity patterns between the PAG and the aforementioned cerebellar regions could thus be hypothesized as part of a widespread network involved in processing fearful or noxious stimuli. However, these results should be interpreted with care, due to intrinsic limitations of the technique. Nevertheless, as a working hypothesis and trigger for further functional and structural investigations, we may suggest that such connections could represent the direct pathways through which the PAG and the cerebel-lum can cooperate for orchestrating complex responses to threatening stimuli.
Limitations
This study is prone to limitations due to some intrinsic weak-nesses of the technique which have been recently summa-rized in a recent review (Maier-Hein et al. 2017). Tractogra-phy deals with the axial symmetry of diffusion signal which prevents to distinguish afferent from efferent connections. At the same time, this technique is not able to the detect synapses, thus neglecting the recognition of monosynaptic pathways from polysynaptic ones. Consequently, inferences on the layer of the cerebellar cortex to which reconstructed fibers arrive are not allowed (Chung et al. 2011; Parker et al.
2013).
The diameter of axons is too tiny for MRI voxels; indeed, even at the highest definition, a single voxel contains thou-sands of axons, making the diffusion signal overestimated in respect to the scale of interest (Jbabdi and Johansen-Berg
2011).
Moreover, results reported in tractography studies are strongly influenced by different ways of modelling diffu-sion signal and depend on reconstruction parameters. An additional issue is represented by different fiber geometry (crossing, kinking, bending) resulting in very similar intra-voxel diffusion signal profiles, being instead different each other (Donahue et al. 2016b). Therefore, we employed a CSD-based signal modelling, together with restrictive recon-struction parameters, to overcome potential reconrecon-struction biases that may be related to other modelling techniques (Dauguet et al. 2007; Descoteaux et al. 2009). Moreover, PAG–cerebellum connections not only have been described in animals via tract tracing techniques, but they have been reported by studies conducted on humans by diffusion trac-tography and fMRI.
The quantitative estimates of structural tractographic-based connectivity are still an open issue. As previously stated, an MRI voxel covers a multitude of axons; thus, the NOS is the most frequent measure employed to assess the strength of connections. However, although the NOS does not correspond to number of axons neglecting an anatomic-wise quantitative analysis (Jbabdi and Johansen-Berg 2011;
Jones et al. 2013), a positive correlation between diffusion path probabilities and results of tract tracing studies has been recently demonstrated, thus validating the use of tractogra-phy-derived quantitative measures (Donahue et al. 2016a).
As it is well known, probabilistic tractography could lead to “false-positive” results and could thus overestimate quan-titative connectivity measures (Jbabdi and Johansen-Berg
2011). Many authors in the field introduce a threshold, in the attempt to limit the effect of spurious tracking in prob-abilistic tractography (Rubinov and Sporns 2010; Drake-smith et al. 2015; Roberts et al. 2017). Therefore, tracts that do not contribute with a minimum percentage to the total tractogram are excluded. However, the choice of a proper threshold remains rather empirical and still constitutes sub-ject of debate (van Wijk et al. 2010; Qi et al. 2015). Here, we employed a connectivity threshold > 1% to define tracts which consistently contributed to the total PAG–cerebellar streamlines. However, despite quite conservative and in line with previous studies, the threshold here employed remains arbitrary and should be acknowledged as an intrinsic limita-tion of the overall approach.
This is particularly important if we consider that several reconstructed tracts with δNORM < 1% showed a COV > 1,
demonstrating a high variance in the connectivity density of these pathways among subjects.
Recently, Roberts et al. proposed the use of COV as an alternative connectivity measure for distinguishing less reliable from more reliable connections. This new approach would not underestimate long-range connections that usu-ally show lower connectivity strength. In the present study, where only short range connection are taken into account, connectivity patterns with δNORM < 1% show the highest COVs suggesting that they may less likely have anatomical plausibility (Roberts et al. 2017).
Finally, despite employing high-definition T1-weighted scans at 0.75 × 0.75 × 0.75 mm resolution, we were not able to reach the necessary definition to distinguish the four lon-gitudinal columns of the PAG and thus to characterize the columnar PAG connectivity.
Acknowledgements Data were provided by the Human Connectome Project, WU-Minn Consortium (Principal Investigators: David Van Essen and Kamil Ugurbil; 1U54MH091657) funded by the 16 NIH Institutes and Centers that support the NIH Blueprint for Neuroscience Research; and by the McDonnell Center for Systems Neuroscience at Washington University.
Compliance with ethical standards
Conflict of interest The authors declare no conflict of interest. Research involving human participants Data were provided by the Human Connectome Project, WU-Minn Consortium (Principal Investi-gators: David Van Essen and Kamil Ugurbil; 1U54MH091657) funded by the 16 NIH Institutes and Centers that support the NIH Blueprint
for Neuroscience Research; and by the McDonnell Center for Systems Neuroscience at Washington University.
Informed consent All participants signed informed consent document at the day of scan as part of the Human Connectome Project, WU-Minn Consortium (Principal Investigators: David Van Essen and Kamil Ugurbil; 1U54MH091657) funded by the 16 NIH Institutes and Centers that support the NIH Blueprint for Neuroscience Research; and by the McDonnell Center for Systems Neuroscience at Washington University. Open Access This article is distributed under the terms of the Crea-tive Commons Attribution 4.0 International License (http://creat iveco mmons .org/licen ses/by/4.0/), which permits unrestricted use, distribu-tion, and reproduction in any medium, provided you give appropriate credit to the original author(s) and the source, provide a link to the Creative Commons license, and indicate if changes were made.
References
Arrigo A, Calamuneri A, Milardi D et al (2018) Claustral structural connectivity and cognitive impairment in drug naïve Parkinson’s disease. Brain Imaging Behav. https ://doi.org/10.1007/s1168 2-018-9907-z
Ashburner J, Friston KJ (2011) Diffeomorphic registration using geo-desic shooting and Gauss-Newton optimisation. Neuroimage 55:954–967. https ://doi.org/10.1016/j.neuro image .2010.12.049
Bandler R, Keay KA, Floyd N, Price J (2000) Central circuits mediat-ing patterned autonomic activity durmediat-ing active vs. passive emo-tional coping. Brain Res Bull 53:95–104
Barmack NH (2003) Central vestibular system: vestibular nuclei and posterior cerebellum. Brain Res Bull 60:511–541
Basser PJ, Mattiello J, LeBihan D (1994) MR diffusion tensor spec-troscopy and imaging. Biophys J 66:259–267. https ://doi. org/10.1016/S0006 -3495(94)80775 -1
Behrens TEJ, Sporns O (2012) Human connectomics. Curr Opin Neu-robiol 22:144–153
Bijttebier S, Caeyenberghs K, van den Ameele H et al (2015) The vulnerability to suicidal behavior is associated with reduced connectivity strength. Front Hum Neurosci 9:632. https ://doi. org/10.3389/fnhum .2015.00632
Blair CR, Karkiski W (1993) An alternative method for significance testing of waveform difference potentials. Psychophysiology 30:518–524. https ://doi.org/10.1111/j.1469-8986.1993.tb020 75.x
Blanchard RJ, Blanchard DC (1969) Crouching as an index of fear. J Comp Physiol Psychol 67:370–375. https ://doi.org/10.1037/ h0026 779
Blatt GJ, Oblak AL, Schmahmann JD (2013) Cerebellar connections with limbic circuits: anatomy and functional implications. In: Manto M, Gruol DL, Schmahmann J, Koibuchi N, Rossipp F (eds) Handbook of the cerebellum and cerebellar disorders, 1st edn. Springer, Netherlands, pp 479–496
Cacciola A, Milardi D, Anastasi GP et al (2016) A direct cortico-nigral pathway as revealed by constrained spherical deconvolution trac-tography in humans. Front Hum Neurosci 10:374. https ://doi. org/10.3389/fnhum .2016.00374
Cacciola A, Calabrò RS, Costa A et al (2017a) Enlarged virchow-robin spaces in a young man: a constrained spherical deconvolution tractography study. Acta Biomed 88:337–351
Cacciola A, Calamuneri A, Milardi D et al (2017b) A connectomic analysis of the human basal ganglia network. Front Neuroanat 11:85. https ://doi.org/10.3389/fnana .2017.00085
Cacciola A, Milardi D, Calamuneri A et al (2017c) Constrained spheri-cal deconvolution tractography reveals cerebello-mammillary connections in humans. Cerebellum 16:483–495. https ://doi. org/10.1007/s1231 1-016-0830-9
Cacciola A, Milardi D, Livrea P et al (2017d) The known and missing links between the cerebellum, basal ganglia, and cerebral cortex. Cerebellum. https ://doi.org/10.1007/s1231 1-017-0850-0
Cacciola A, Milardi D, Anastasi G, Quartarone A (2018) Cortico-pallidal connectivity: lessons from patients with dystonia. Ann Neurol 84:158. https ://doi.org/10.1002/ana.25255
Cacciola A, Milardi D, Bertino S et al (2019) Structural connectiv-ity‐based topography of the human globus pallidus: Implica-tions for therapeutic targeting in movement disorders. Mov Disord. https ://doi.org/10.1002/mds.27712
Calamuneri A, Arrigo A, Mormina E et al (2018) White matter tis-sue quantification at low b-values within constrained spheri-cal deconvolution framework. Front Neurol 9:716. https ://doi. org/10.3389/fneur .2018.00716
Carrive P (1993) The periaqueductal gray and defensive behaviour:functional representation and neuronal organisation. Behav Brain Res 58:27–47
Carrive P (2000) Conditioned fear to environmental context: car-diovascular and behavioral components in the rat. Brain Res 858:440–445. https ://doi.org/10.1016/S0006 -8993(00)02029 -1
Case M, Zhang H, Mundahl J et al (2017) Characterization of func-tional brain activity and connectivity using EEG and fMRI in patients with sickle cell disease. NeuroImage Clin 14:1–17.
https ://doi.org/10.1016/j.nicl.2016.12.024
Cerminara NL, Koutsikou S, Lumb BM, Apps R (2009) The peri-aqueductal grey modulates sensory input to the cerebellum: a role in coping behaviour? Eur J Neurosci 29:2197–2206. https ://doi.org/10.1111/j.1460-9568.2009.06760 .x
Chan-Palay V (1977) Cerebellar dentate nucleus: organization, cytol-ogy and transmitters. Springer, Heidelberg
Cheng H, Wang Y, Sheng J et al (2012) Characteristics and vari-ability of structural networks derived from diffusion tensor imaging. Neuroimage 61:1153–1164. https ://doi.org/10.1016/j. neuro image .2012.03.036
Chung HW, Chou MC, Chen CY (2011) Principles and limitations of computational algorithms in clinical diffusion tensor MR tractography. Am. J. Neuroradiol. 32:3–13
Coulombe MA, Erpelding N, Kucyi A, Davis KD (2016) Intrin-sic functional connectivity of periaqueductal gray subregions in humans. Hum Brain Mapp 37:1514–1530. https ://doi. org/10.1002/hbm.23117
Dauguet J, Peled S, Berezovskii V et al (2007) Comparison of fiber tracts derived from in vivo DTI tractography with 3D histo-logical neural tract tracer reconstruction on a macaque brain. Neuroimage 37:530–538. https ://doi.org/10.1016/j.neuro image .2007.04.067
Descoteaux M, Deriche R, Knösche TR, Anwander A (2009) Deter-ministic and probabilistic tractography based on complex fibre orientation distributions. IEEE Trans Med Imaging 28:269– 286. https ://doi.org/10.1109/TMI.2008.20044 24
Diedrichsen J (2006) A spatially unbiased atlas template of the human cerebellum. Neuroimage 33:127–138. https ://doi. org/10.1016/j.neuro image .2006.05.056
Diedrichsen J, Balsters JH, Flavell J et al (2009) A probabilistic MR atlas of the human cerebellum. Neuroimage 46:39–46. https :// doi.org/10.1016/j.neuro image .2009.01.045
Diedrichsen J, Maderwald S, Küper M et al (2011) Imaging the deep cerebellar nuclei: a probabilistic atlas and normalization proce-dure. Neuroimage 54(3):1786–1794. https ://doi.org/10.1016/j. neuro image .2010.10.035
Dietrichs E (1983) Cerebellar cortical afferents from the periaque-ductal grey in the cat. Neurosci Lett 41(1–2):21–26
Donahue CJ, Sotiropoulos SN, Jbabdi S et al (2016a) Using diffu-sion tractography to predict cortical connection strength and distance: a quantitative comparison with tracers in the monkey. J 2Neurosci 36:6758–6770. https ://doi.org/10.1523/JNEUR OSCI.0493-16.2016
Donahue CJ, Sotiropoulos SN, Jbabdi S et al (2016b) Using diffu-sion tractography to predict cortical connection strength and distance: a quantitative comparison with tracers in the mon-key. J Neurosci 36:6758–6770. https ://doi.org/10.1523/JNEUR OSCI.0493-16.2016
Drakesmith M, Caeyenberghs K, Dutt A et al (2015) Overcoming the effects of false positives and threshold bias in graph theoretical analyses of neuroimaging data. Neuroimage 118:313–333. https ://doi.org/10.1016/j.neuro image .2015.05.011
Ezra M, Faull OK, Jbabdi S, Pattinson KTS (2015) Connectivity-based segmentation of the periaqueductal gray matter in human with brainstem optimized diffusion MRI. Hum Brain Mapp 36:3459– 3471. https ://doi.org/10.1002/hbm.22855
Fanselow MS (1980) Conditional and unconditional components of post-shock freezing. Pavlov J Biol Sci Off J Pavlov 15:177–182.
https ://doi.org/10.1007/BF030 01163
Fanselow MS (1994) Neural organization of the defensive behavior system responsible for fear. Psychon Bull Rev 1:429–438. https ://doi.org/10.3758/BF032 10947
Fanselow MS, Kim JJ, Young SL et al (1991) Differential effects of selective opioid peptide antagonists on the acquisition of Pav-lovian fear conditioning. Peptides 12:1033–1037. https ://doi. org/10.1016/0196-9781(91)90056 -U
Faull OK, Pattinson KTS (2017) The cortical connectivity of the peri-aqueductal gray and the conditioned response to the threat of breathlessness. Elife 6:e21749. https ://doi.org/10.7554/elife .21749
Furlong TM, Richardson R, McNally GP (2016) Habituation and extinction of fear recruit overlapping forebrain structures. Neurobiol Learn Mem 128:7–16. https ://doi.org/10.1016/j. nlm.2015.11.013
Glasser MF, Sotiropoulos SN, Wilson JA et al (2013) The minimal preprocessing pipelines for the Human Connectome Project. Neuroimage 80:105–124. https ://doi.org/10.1016/j.neuro image .2013.04.127
Grodd W, Hulsmann E, Lotze M et al (2001) Sensorimotor mapping of the human cerebellum: fMRI evidence of somatotopic organiza-tion. Hum Brain Mapp 13:55–73
Guo X, Duan X, Long Z et al (2016) Decreased amygdala functional connectivity in adolescents with autism: a resting-state fMRI study. Psychiatry Res Neuroimaging 257:47–56. https ://doi. org/10.1016/j.pscyc hresn s.2016.10.005
Hadjipavlou G, Dunckley P, Behrens TE, Tracey I (2006) Determining anatomical connectivities between cortical and brainstem pain processing regions in humans: a diffusion tensor imaging study in healthy controls. Pain 123:169–178. https ://doi.org/10.1016/j. pain.2006.02.027
Hagenaars MA, Oitzl M, Roelofs K (2014a) Updating freeze: aligning animal and human research. Neurosci Biobehav Rev 47:165–176 Hagenaars MA, Roelofs K, Stins JF (2014b) Human freezing in
response to affective films. Anxiety Stress Coping 27:27–37.
https ://doi.org/10.1080/10615 806.2013.80942 0
Hayen A, Herigstad M, Pattinson KTS (2013) Understanding dyspnea as a complex individual experience. Maturitas 76:45–50 Henderson JM (2012) “Connectomic surgery”: diffusion tensor
imag-ing (DTI) tractography as a targetimag-ing modality for surgical modu-lation of neural networks. Front Integr Neurosci 6:15. https ://doi. org/10.3389/fnint .2012.00015
Herigstad M, Hayen A, Wiech K, Pattinson KTS (2011) Dyspnoea and the brain. Respir Med 105:809–817. https ://doi.org/10.1016/j. rmed.2010.12.022
Hermans EJ, Henckens MJAG, Roelofs K, Fernández G (2013) Fear bradycardia and activation of the human periaqueductal grey. Neuroimage 66:278–287. https ://doi.org/10.1016/j.neuro image .2012.10.063
Jbabdi S, Johansen-Berg H (2011) Tractography: where do we go from here? Brain Connect 1:169–183. https ://doi.org/10.1089/brain .2011.0033
Jeurissen B, Tournier JD, Dhollander T et al (2014) Multi-tissue con-strained spherical deconvolution for improved analysis of multi-shell diffusion MRI data. Neuroimage. 103:411–426. https ://doi. org/10.1016/j.neuro image .2014.07.061
Jones DK, Knösche TR, Turner R (2013) White matter integrity, fiber count, and other fallacies: the do’s and don’ts of diffusion MRI. Neuroimage 73:239–254
Keuken MC, Forstmann BU (2015) A probabilistic atlas of the basal ganglia using 7 T MRI. Data Br 4:577–582. https ://doi. org/10.1016/j.dib.2015.07.028
Kheradmand A, Zee DS (2011) Cerebellum and ocular motor control. Front Neurol SEP 2:53. https ://doi.org/10.3389/fneur .2011.00053
Kong J, Tu P, Zyloney C, Su T (2010) Intrinsic functional connectivity of the periaqueductal gray, a resting fMRI study. Behav Brain Res 211:215–219. https ://doi.org/10.1016/j.bbr.2010.03.042. Intri nsic
Koutsikou S, Crook JJ, Earl EV et al (2014) Neural substrates under-lying fear-evoked freezing: the periaqueductal grey-cerebellar link. J Physiol 592:2197–2213. https ://doi.org/10.1113/jphys iol.2013.26871 4
Koutsikou S, Watson TC, Crook JJ et al (2015) The periaqueductal gray orchestrates sensory and motor circuits at multiple levels of the neuraxis. J Neurosci 35:14132–14147. https ://doi.org/10.1523/ JNEUR OSCI.0261-15.2015
Koutsikou S, Apps R, Lumb BM (2017) Top down control of spinal sensorimotor circuits essential for survival. J Physiol 595:4151– 4158. https ://doi.org/10.1113/JP273 360
Kozlowska K, Walker P, McLean L, Carrive P (2015) Fear and the defense cascade. Harv Rev Psychiatry 23:263–287. https ://doi. org/10.1097/HRP.00000 00000 00006 5
Lansing RW, Gracely RH, Banzett RB (2009) The multiple dimensions of dyspnea: review and hypotheses. Respir Physiol Neurobiol 167:53–60
Maier-Hein KH, Neher PF, Houde JC et al (2017) The challenge of mapping the human connectome based on diffusion tractogra-phy. Nat Commun 8(1):1349. https ://doi.org/10.1038/s4146 7-017-01285 -x
McCall AA, Miller DM, Yates BJ (2017) Descending influences on vestibulospinal and vestibulosympathetic reflexes. Front Neurol 8:112
McMullan S, Lumb BM (2006) Spinal dorsal horn neuronal responses to myelinated versus unmyelinated heat nociceptors and their modulation by activation of the periaqueductal grey in the rat. J Physiol 576:547–556. https ://doi.org/10.1113/jphys iol.2006.11775 4
Menant O, Andersson F, Zelena D, Chaillou E (2016) The benefits of magnetic resonance imaging methods to extend the knowledge of the anatomical organisation of the periaqueductal gray in mam-mals. J Chem Neuroanat 77:110–120
Milardi D, Arrigo A, Anastasi G et al (2016a) Extensive direct sub-cortical cerebellum-basal ganglia connections in human brain as revealed by constrained spherical deconvolution tractog-raphy. Front Neuroanat 10:29. https ://doi.org/10.3389/fnana .2016.00029
Milardi D, Cacciola A, Cutroneo G et al (2016b) Red nucleus connec-tivity as revealed by constrained spherical deconvolution tractog-raphy. Neurosci Lett 626:68–73. https ://doi.org/10.1016/j.neule t.2016.05.009
Milardi D, Cacciola A, Calamuneri A et al (2017) The olfactory system revealed: Non-invasive mapping by using constrained spherical deconvolution tractography in healthy humans. Front Neuroanat 11:32. https ://doi.org/10.3389/fnana .2017.00032
Mobbs D, Yu R, Rowe JB et al (2010) Neural activity associated with monitoring the oscillating threat value of a tarantula. Proc Natl Acad Sci 107:20582–20586. https ://doi.org/10.1073/pnas.10090 76107
Moers-Hornikx VMP, Vles JSH, Lim LW et al (2011) Periaqueductal grey stimulation induced panic-like behaviour is accompa-nied by deactivation of the deep cerebellar nuclei. Cerebellum 10:61–69. https ://doi.org/10.1007/s1231 1-010-0228-z
Nisimaru N, Mittal C, Shirai Y et al (2013) Orexin-neuromodulated cerebellar circuit controls redistribution of arterial blood flows for defense behavior in rabbits. Proc Natl Acad Sci U S A 110:14124–14131. https ://doi.org/10.1073/pnas.13128 04110
Owen SLF, Heath J, Kringelbach ML et al (2007) Preoperative DTI and probabilistic tractography in an amputee with deep brain stimulation for lower limb stump pain. Br J Neurosurg 21:485– 490. https ://doi.org/10.1080/02688 69070 15583 58
Owen SLF, Heath J, Kringelbach M et al (2008) Pre-operative DTI and probabilisitic tractography in four patients with deep brain stimulation for chronic pain. J Clin Neurosci 15:801–805. https ://doi.org/10.1016/j.jocn.2007.06.010
Parker GJM, Alexander DC (2005) Probabilistic anatomical connec-tivity derived from the microscopic persistent angular struc-ture of cerebral tissue. Philos Trans R Soc Lond B Biol Sci 360:893–902. https ://doi.org/10.1098/rstb.2005.163
Parker GD, Marshall D, Rosin PL et al (2013) A pitfall in the reconstruction of fibre ODFs using spherical deconvolution of diffusion MRI data. Neuroimage 65:433–448. https ://doi. org/10.1016/j.neuro image .2012.10.022
Patenaude B, Smith SM, Kennedy DN, Jenkinson M (2011) A Bayes-ian model of shape and appearance for subcortical brain seg-mentation. Neuroimage 56:907–922. https ://doi.org/10.1016/j. neuro image .2011.02.046
Qi S, Meesters S, Nicolay K et al (2015) The influence of construc-tion methodology on structural brain network measures: a review. J Neurosci Methods 253:170–182
Rizzo G, Milardi D, Bertino S et al (2018) The limbic and sen-sorimotor pathways of the human amygdala: a structural connectivity study. Neuroscience 385:166–180. https ://doi. org/10.1016/j.neuro scien ce.2018.05.051
Roberts JA, Perry A, Roberts G et al (2017) Consistency-based thresholding of the human connectome. Neuroimage 145:118– 129. https ://doi.org/10.1016/j.neuro image .2016.09.053
Roelofs K (2017) Freeze for action: neurobiological mechanisms in animal and human freezing. Philos Trans R Soc B Biol Sci 372:20160206. https ://doi.org/10.1098/rstb.2016.0206
Roelofs K, Hagenaars MA, Stins J (2010) Facing freeze. Psychol Sci 21:1575–1581. https ://doi.org/10.1177/09567 97610 38474 6
Rubinov M, Sporns O (2010) Complex network measures of brain connectivity: uses and interpretations. Neuroimage 52:1059– 1069. https ://doi.org/10.1016/j.neuro image .2009.10.003
Sacchetti B, Baldi E, Lorenzini CA, Bucherelli C (2002) Cerebellar role in fear-conditioning consolidation. Proc Natl Acad Sci 99:8406–8411. https ://doi.org/10.1073/pnas.11266 0399
Sacchetti B, Scelfo B, Tempia F, Strata P (2004) Long-term syn-aptic changes induced in the cerebellar cortex by fear condi-tioning. Neuron 42:973–982. https ://doi.org/10.1016/j.neuro n.2004.05.012
Sacchetti B, Sacco T, Strata P (2007) Reversible inactivation of amygdala and cerebellum but not perirhinal cortex impairs reactivated fear memories. Eur J Neurosci 25:2875–2884. https ://doi.org/10.1111/j.1460-9568.2007.05508 .x
Sacchetti B, Scelfo B, Strata P (2009) Cerebellum and emotional behavior. Neuroscience 162:756–762
Sillery E, Bittar RG, Robson MD et al (2005) Connectivity of the human periventricular–periaqueductal gray region. J Neurosurg 103:1030–1034. https ://doi.org/10.3171/jns.2005.103.6.1030
Smith SM (2002) Fast robust automated brain extraction. Hum Brain Mapp 17:143–155. https ://doi.org/10.1002/hbm.10062
Smith SM, Jenkinson M, Woolrich MW et al (2004) Advances in functional and structural MR image analysis and imple-mentation as FSL. Neuroimage 23:S208–S219. https ://doi. org/10.1016/j.neuro image .2004.07.051
Smith RE, Tournier JD, Calamante F, Connelly A (2013) SIFT: spheri-cal-deconvolution informed filtering of tractograms. Neuroimage 67:298–312. https ://doi.org/10.1016/j.neuro image .2012.11.049
Snider R, Eldred E (1951) Electro-anatomical studies on cerebro-cer-ebellar connections in the cat. J Comp Neurol 95:1–16. https :// doi.org/10.1002/cne.90095 0102
Sokolowski K, Corbin JG (2012) Wired for behaviors: from develop-ment to function of innate limbic system circuitry. Front Mol Neurosci 5:55. https ://doi.org/10.3389/fnmol .2012.00055
Sotiropoulos SN, Jbabdi S, Xu J et al (2013) Advances in diffusion MRI acquisition and processing in the Human Connectome Project. Neuroimage 80:125–143. https ://doi.org/10.1016/j.neuro image .2013.05.057
Stoodley CJ, Schmahmann JD (2009) Functional topography in the human cerebellum: a meta-analysis of neuroimaging studies. Neuroimage 44:489–501. https ://doi.org/10.1016/j.neuro image .2008.08.039
Stoodley CJ, Schmahmann JD (2010) Evidence for topographic organization in the cerebellum of motor control versus cogni-tive and affeccogni-tive processing. Cortex 46:831–844. https ://doi. org/10.1016/j.corte x.2009.11.008
Stoodley CJ, Schmahmann JD (2016) Functional topography of the human cerebellum. In: essentials of cerebellum and cerebellar disorders: a primer for graduate students, pp 373–381
Strata P (2015) The emotional cerebellum. Cerebellum 14:570–577 Teune TM, van der Burg J, van der Moer J et al (2000) Topography
of cerebellar nuclear projections to the brain stem in the rat. Prog Brain Res. 124:141–172. https ://doi.org/10.1016/s0079 -6123(00)24014 -4
Tournier JD, Calamante F, Connelly A (2007) Robust determina-tion of the fibre orientadetermina-tion distribudetermina-tion in diffusion MRI: non-negativity constrained super-resolved spherical deconvolution. Neuroimage 35:1459–1472. https ://doi.org/10.1016/j.neuro image .2007.02.016
Tournier JD, Yeh CH, Calamante F et al (2008) Resolving crossing fibres using constrained spherical deconvolution: validation using diffusion-weighted imaging phantom data. Neuroimage 42:617–625. https ://doi.org/10.1016/j.neuro image .2008.05.002
Tournier J-D, Calamante F, Connelly A (2011) Effect of step size on probabilistic streamlines: implications for the interpretation of connectivity analyses. In: proceedings of the international society for magnetic resonance in medicine, p 2019
Tournier JD, Calamante F, Connelly A (2012) MRtrix: Diffusion trac-tography in crossing fiber regions. Int J Imaging Syst Technol 22(1):53–66. https ://doi.org/10.1002/ima.22005
Tovote P, Fadok JP, Lüthi A (2015) Neuronal circuits for fear and anxiety. Nat Rev Neurosci 16:317–331. https ://doi.org/10.1038/ nrn39 45
Tovote P, Esposito MS, Botta P et al (2016) Midbrain circuits for defen-sive behaviour. Nature 534(7606):206. https ://doi.org/10.1038/ natur e1799 6
Uǧurbil K, Xu J, Auerbach EJ et al (2013) Pushing spatial and temporal resolution for functional and diffusion MRI in the human connec-tome project. Neuroimage 80:80–104. https ://doi.org/10.1016/j. neuro image .2013.05.012
Van Essen DC, Smith SM, Barch DM et al (2013) The WU-Minn human connectome project: an overview. Neuroimage 80:62–79.
https ://doi.org/10.1016/j.neuro image .2013.05.041
van Wijk BCM, Stam CJ, Daffertshofer A (2010) Comparing brain networks of different size and connectivity density using graph theory. PLoS One 5(10):e13701. https ://doi.org/10.1371/journ al.pone.00137 01
Verstynen T, Jarbo K, Pathak S, Schneider W (2011) In vivo map-ping of microstructural somatotopies in the human corticospinal pathways. J Neurophysiol 105:336–346. https ://doi.org/10.1152/ jn.00698 .2010
Voogd J, Schraa-Tam CKL, Van Der Geest JN, De Zeeuw CI (2012) Visuomotor cerebellum in human and nonhuman primates. In: Cerebellum, pp 392–410
Walker P, Carrive P (2003) Role of ventrolateral periaqueductal gray neurons in the behavioral and cardiovascular responses to con-textual conditioned fear and poststress recovery. Neuroscience 116:897–912. https ://doi.org/10.1016/S0306 -4522(02)00744 -3
Watson TC, Cerminara NL, Lumb BM, Apps R (2016) Neural cor-relates of fear in the periaqueductal gray. J Neurosci 36:12707– 12719. https ://doi.org/10.1523/JNEUR OSCI.1100-16.2016
Zhang Y, Brady M, Smith S (2001) Segmentation of brain MR images through a hidden Markov random field model and the expecta-tion-maximization algorithm. IEEE Trans Med Imaging 20:45– 57. https ://doi.org/10.1109/42.90642 4
Zhang L-L, Wang J-Q, Qi R-R et al (2016a) Motion sickness: current knowledge and recent advance. CNS Neurosci Ther 22:15–24.
https ://doi.org/10.1111/cns.12468
Zhang X-Y, Wang J-J, Zhu J-N (2016b) Cerebellar fastigial nucleus: from anatomic construction to physiological functions. Cerebel-lum Ataxias 3:9. https ://doi.org/10.1186/s4067 3-016-0047-1
Zhang Y, Larcher KM-H, Misic B, Dagher A (2017) Anatomical and functional organization of the human substantia Nigra and its connections. Elife 6:e26653. https ://doi.org/10.7554/eLife .26653 Publisher’s Note Springer Nature remains neutral with regard to jurisdictional claims in published maps and institutional affiliations.