Downloaded from https://journals.lww.com/jaids by BhDMf5ePHKav1zEoum1tQfN4a+kJLhEZgbsIHo4XMi0hCywCX1AWnYQp/IlQrHD3tIQ5gQCIeyzx5bGQSVVpx6tkN9jOGiBknY8ZLDb9x08= on 10/22/2018 Downloadedfrom https://journals.lww.com/jaidsby BhDMf5ePHKav1zEoum1tQfN4a+kJLhEZgbsIHo4XMi0hCywCX1AWnYQp/IlQrHD3tIQ5gQCIeyzx5bGQSVVpx6tkN9jOGiBknY8ZLDb9x08=on 10/22/2018
Interruption of Highly Active Antiretroviral Therapy
in HIV Clinical Practice
Results From the Italian Cohort of Antiretroviral-Naive Patients
Antonella d’Arminio Monforte, MD,* Alessandro Cozzi-Lepri, PhD,† Andrew Phillips, PhD,†
Andrea De Luca, MD,‡ Rita Murri, MD,‡ Cristina Mussini, MD,§ Paolo Grossi, MD,
kAndrea Galli, MD,¶ Tiziano Zauli, MD,# Maria Montroni, MD,** Paolo Tundo, MD,††
and Mauro Moroni, MD* for the Italian Cohort of Antiretroviral-Naive Patients Study Group
Objectives: To investigate the frequency of a first therapy interruption (TI) $12 weeks, to identify the factors associated with TI and with therapy resumption, and to compare the risk of devel-oping clinical events during TI and during continuous therapy.
Methods:Observational study of 3142 patients who started a first highly active antiretroviral therapy (HAART) regimen. End points were time to (1) first TI of $12 weeks, (2) subsequent therapy resumption, and (3) development of new AIDS-related events or death.
Results:Over a median follow-up period of 41 months (interquartile range: 18–60 months), 721 patients (22.9%) interrupted HAART for $12 weeks, with a probability of 28.6% (95% confidence interval [CI]: 26.7–30.6) by 4 years from the date of therapy initiation. Patient decision (47.4%) and toxicity (24.0%) were the main reasons for TI. Women, injection drug users, and patients with a higher current CD4 cell count were more likely to interrupt. The median time to therapy resumption was 12 months (95% CI: 11–14). The higher the current CD4 count, the slower was the rate of resuming therapy; conversely, patients who stopped because of failure and those with a pre-HAART viral load .100,000 copies/mL resumed therapy sooner. Two hundred eighty-one patients experienced clinical progression at a rate of 2.6 per 100 person-years (pys) (95% CI: 2.3–3.0) while patients were on therapy and 3.5 per 100 pys (95% CI: 2.4–4.8) during TI. The adjusted relative hazard of clinical progression associated with TI was 2.75 (95% CI: 1.14–6.65; P = 0.03).
Conclusions:TI occurring in clinical practice is associated with an increased risk of clinical progression; hence, it should be discouraged outside strictly experimental settings.
Key Words: highly active antiretroviral therapy, treatment inter-ruption, clinical setting, clinical progression
(J Acquir Immune Defic Syndr 2005;38:407–416)
T
he efficacy of highly active antiretroviral therapy (HAART) has been well demonstrated by trends in mor-bidity and mortality over calendar time,1,2in randomized cli-nical trials,3,4
and in cohort studies studying subjects starting such regimens.5,6
Nevertheless, the complexity of the regim-ens, the frequent occurrence of adverse events, and incomplete adherence leading to the emergence of resistant viruses7,8
have resulted in investigation of alternatives to continuous lifelong therapy. Structured treatment interruption (STI) strategies have been investigated in subjects with well-controlled viral replication and in subjects with multiple failures. Although the rationale for the use of STI in these 2 clinical situations is different, being to reduce the total exposure to therapy and/or to enhance HIV-specific cellular immune response in the first case and to re-establish the circulation in plasma of a virus that is sensitive to antiretroviral drugs in the second case, preli-minary results on the safety and benefit of such approaches are mixed.9–15
Similarly, cohort studies examining unsupervised therapy interruptions have not so far provided a consistent guide to the risks, in terms of CD4 cell count depletion and occurrence of AIDS-related diseases.16–21
Therefore, STI str-ategies are still considered to be experimental and limited to patients included in clinical research studies.22
Nevertheless, a considerable proportion of patients in the clinical setting choose to temporarily discontinue therapy, often without supervision by their treating clinician, because of toxicity or because of the desire to have a break from therapy.
The aim of this study was to investigate the frequency of treatment interruption (TI) in a large cohort of patients after they underwent their first HAART regimen so as to identify the factors associated with the occurrence of their first TI as well as those associated with subsequent therapy resumption and to investigate whether there is an increased risk of developing clinical events during TI compared with periods of continuous therapy.
Received for publication March 18, 2004; accepted September 28, 2004. From the *Istituto di Malattie Infettive e Tropicali, Universita` di Milano,
Milano, Italy; †Royal Free and University College Medical School, London, United Kingdom; ‡Istituto di Clinica delle Malattie Infettive, Universita` Cattolica del S. Cuore, Roma, Italy; §Clinica di Malattie Infettive, Universita` di Modena, Modena, Italy; kDivisione di Malattie
Infettive, Ospedale di Varese, Varese, Italy;{Clinica di Malattie Infettive, Universita` Vita e Salute, Milano, Italy; #Divisione di Malattie Infettive, Ospedale di Ravenna, Ravenna, Italy; **Cattedra di Immunologia Clinica, Universita` di Ancona, Ancona, Italy; and ††Divisione di Malattie Infettive, Ospedale di Lecce, Lecce, Italy.
The Italian Cohort of Antiretroviral-Naive Patients study is supported by an unrestricted educational grant from GlaxoSmithKline Italy.
Reprints: Antonella d’Arminio Monforte, Institute of Infectious and Tropical Diseases, University of Milan, L. Sacco Hospital, Via GB Grassi, 74-20157 Milan, Italy (e-mail: [email protected]).
METHODS
The Italian Cohort of Antiretroviral-Naive Patients (I.Co.N.A.) is a cohort that was set up in 1997, and it in-cludes patients consecutively enrolled from 69 departments of infectious diseases all over Italy. To be recruited, patients have to be naive to antiretroviral treatment, irrespective of the rea-son for being so; they all signed consent forms to participate in the cohort study. Details of the I.Co.N.A. study are given elsewhere.7
Briefly, in the I.Co.N.A. database, the reasons for switching or interrupting therapy (as given by clinicians) were coded as: patient decision, side effects/toxicity, therapy failure, and other reasons (eg, therapy contraindications, adherence, simplification). I.Co.N.A. clinicians typically tick the box ‘‘patient decision’’ when the decision to interrupt therapy is primarily made by the patient, who informs his or her treating doctor at the next visit.
Patients were included in the present analysis if they had started a first HAART regimen (defined as a regimen con-taining at least 3 drugs chosen from among nucleoside reverse transcriptase inhibitors [NRTIs], protease inhibitors [PIs], and nonnucleoside reverse transcriptase inhibitors [NNRTIs]) and had at least 1 clinical follow-up visit after HAART initiation. When more than 1 drug was interrupted at the same time and the reason given was different according to the drug stopped, the reason given for stopping the ‘‘third’’ drug (typically, the PI or NNRTI) was used in the analysis.
Three main end points were considered in this analysis. The first end point was the time from HAART initiation to the first time at which all the drugs were interrupted for a period of at least 12 weeks (ie, patients who interrupted HAART but restarted therapy within 12 weeks were not defined as having a TI). Similarly, the follow-up of patients who had their last clinical visit less than 12 weeks after the date of TI were censored at this date, and the TI was ignored. A complete interruption longer than 12 weeks occurring after 1 or more of these shorter interruptions was a defining event, however. Indeed, we thought that interruptions shorter than 12 weeks should not be considered as real preplanned interruptions.
The second end point was therapy resumption, defined as the time from therapy interruption to the time of restarting 1 or more antiretrovirals. Follow-up of patients for whom ther-apy was not resumed was censored at the date of the last cli-nical follow-up visit.
Standard survival analysis methods, including Kaplan-Meier estimation and Cox proportional hazards models, were used to analyze the rate and determinants of the first TI and of therapy resumption after the first TI. To calculate the proba-bility of the first TI according to the duration of time since HAART initiation, the arbitrary date (before enrollment) of January 1, 1996 was chosen as time 0 for the analysis. This time was chosen rather than the date of initiation of HAART; otherwise, the covariate ‘‘cumulative time spent on HAART’’ and the survival time would be identical, and it would not be possible to obtain a useful estimate of the relative hazard (RH) associated with this factor from fitting a Cox model.
For the subgroup of patients who interrupted therapy at a CD4 cell count greater than 200 cells/mL, we estimated the probability of resuming therapy by the time of reaching a CD4
count less than 200 cells/mL. The structure of repeated CD4 count data is comparable with that of censored time-to-event data such that it was possible to define a ‘‘censored’’ minimum CD4 count observed over follow-up for patients who did not restart therapy and a ‘‘known’’ minimum CD4 count for those who restarted, which was defined as failure; the Kaplan-Meier method can then be used to estimate the CD4 count at which a certain proportion of the patients would be expected to restart therapy. The SAS statistical package was used after subtracting to the minimum CD4 count, calculated separately for each patient, a constant such that all observations were positive (as required by the package). Details of this method are described elsewhere.23
Survival times were left truncated at the CD4 count at the time of the first TI such that patients were considered to be ‘‘at risk’’ only starting from their own CD4 count measured at the time of TI.
The third end point was the development of a new AIDS-defining event or death. AIDS-defining events were classified according to the 1993 Centers for Disease Control and Prevention (CDC) guidelines.24 Only the first clinical
event since the initiation of HAART was accounted for; time 0 was the time of initiation of first HAART, and follow-up of patients who did not develop an event was censored at the date of the last clinical follow-up. For this end point, all the TIs longer than 12 weeks experienced during the follow-up period (and not just the first TI) were taken into account. The number of new clinical events and the follow-up time that patients spent on therapy and off therapy were calculated. The rate of clinical events was expressed per person-year (py) of follow-up, and the rate ratios (RRs) with 95% confidence intervals (CIs; rate off therapy vs. rate on therapy) were determined, using univariate Poisson regression, overall and stratified by the current CD4 cell count. The risk of clinical progression associated with TI was also assessed in a multivariate pro-portional hazards model, including a time-dependent covariate taking the value of 0 if a patient was on therapy or during the first 12 weeks of TI and taking the value of 1 from the point in time at which a patient had been off therapy for $12 weeks up to the date that he or she restarted therapy or the date of the last clinical visit, whichever occurred first. The 12-week lag was introduced to try to minimize the potential reverse causality problem resulting from the fact that patients some-times discontinue their treatment as a consequence of immi-nent death.
The covariates for the current time-dependent absolute levels of CD4 cell count, viral load, and triglycerides (and marker changes from pretherapy levels) were constructed using all the measurements available without any time restric-tion on how recent a measurement had to be.
RESULTS
Study Population
A total of 3142 patients were included in the analysis. Overall, the median CD4 count before starting HAART was 284 cells/mL (interquartile range [IQR]:127–450 cells/mL), and the viral load was 4.70 log10copies/mL (IQR: 3.97–5.23
HAART was 1999 (range: 1997–2004). The remaining general characteristics of the patients according to the number and duration of TIs (none or ,12 weeks, 1 TI $12 weeks, or more than 1 TI $12 weeks) are shown in Table 1.
Over a median clinical follow-up of 41 months (IQR: 18–60 months), a total of 721 patients (22.9%) interrupted HAART for at least 12 weeks: 655 (20.8%) had a single interruption, 54 (1.7%) had 2 interruptions, and 12 (0.4%) had 3 interruptions for a total of 1015 interruptions. The first of these interruptions occurred in the calendar period ranging between September 1997 and February 2004. The median CD4 count and viral load at time of the first HAART interruption were 532 cells/mL (IQR: 307–784 cells/mL) and 2.71 log10 copies/mL (IQR: 1.90–4.29 log10 copies/mL),
respectively; at the time of interruption, 50.5% of patients (n = 364) had a viral load .500 copies/mL, whereas in 357 patients (49.5%), the viral load was undetectable (n = 186 at a cutoff of
500 copies/mL and n = 171 at a cutoff of 50 copies/mL). The most common type of regimen that patients had been receiving when the interruption took place was a combination of 2 NRTIs and a single PI (46.3%), followed by 2 NRTIs and an NNRTI (34.8%); 3 NRTIs, with 1 being abacavir (7.6%); and ritonavir-boosted PI combinations (3.3%). The most frequent reason for interruption was patient decision (47.4% [n = 342]), followed by toxicity (24.0% [n = 173]), other reasons (24.1% [clinical contraindications, n = 23; poor adherence, n = 41; and clinical decision, n = 9]), and therapy failure (4.4% [n = 32]). The reason for stopping was highly correlated to the regimen received at the time of interruption (P = 0.0001). For example, the reason for interrupting was adherence in only 5% of patients taking 3 NRTIs (with abacavir) versus 46% of those taking NNRTI-containing regimens, 60% of those taking single PI regimens, and 38% of those taking ritonavir-boosted PI regimens.
TABLE 1. General Baseline Characteristics of 3142 Patients of the I.Co.N.A. According to the Number and Duration of TIs Characteristics at the Time of
Starting HAART Continued HAART or TI ,12 Weeks (n = 2421) One TI .12 Weeks (n = 655)
Two or More TIs .12 Weeks
(n = 66) Total (n = 3142) P
Male, n (%) 1769 (73.1) 437 (66.7) 43 (65.2) 2249 (71.6) 0.003*
Age, years median (IQR) 36 (32–41) 35 (31–39) 35 (31–41) 36 (32–41) 0.0001†
Mode of transmission, n (%) IDU 771 (31.9) 290 (44.3) 33 (50.0) 1094 (34.8) 0.0001* Homo/bisexual 527 (21.8) 110 (16.8) 15 (22.7) 652 (20.8) Heterosexual 940 (38.8) 225 (34.4) 16 (24.2) 1181 (37.6) Other/unknown 183 (7.6) 30 (4.6) 2 (3.0) 215 (6.8) Treatment history Pretreated, n (%) 582 (24.0) 208 (31.8) 19 (28.8) 809 (25.8) 0.003* CDC stage, n (%) A 1527 (63.2) 465 (71.1) 41 (62.1) 2033 (64.9) 0.0001* B 411 (17.0) 120 (18.4) 11 (16.7) 542 (17.3) C 477 (19.8) 69 (10.6) 14 (21.2) 560 (17.9) CD4 cells/mL Median 267 359 320 284 0.0001† IQR 112–428 195–555 149–495 127–450
HIV-RNA log10copies/mL
Median 4.75 4.53 4.82 4.70 0.0001†
IQR 4.03–5.26 3.84–5.06 3.94–5.28 3.97–5.23
Calendar year of starting 0.0001*
1997 339 (14.0) 121 (18.5) 23 (34.9) 483 (34.9) 1998 586 (24.2) 226 (34.5) 19 (28.8) 831 (26.5) 1999 325 (13.4) 106 (16.2) 7 (10.6) 438 (13.9) 2000 456 (18.8) 117 (17.9) 11 (16.7) 584 (18.6) 2001 202 (8.3) 45 (6.9) 3 (4.6) 250 (8.0) 2002 262 (10.8) 30 (4.6) 3 (4.6) 295 (9.4) 2003–2004 251 (10.4) 10 (1.5) 0 (0.0) 261 (8.31) HAART regimen, n (%) 2 NRTI + 1 PI 1400 (57.8) 422 (64.4) 48 (72.7) 1870 (59.5) 0.02* 2 NRTI + NNRTI 830 (34.3) 192 (29.3) 15 (22.7) 1037 (33.0) 2 NRTI + 2 PI 65 (2.7) 10 (1.5) 1 (1.5) 76 (2.4) 3 NRTI 106 (4.4) 22 (3.4) 2 (3.0) 130 (4.1) Other 20 (0.8) 9 (1.4) 0 (0.0) 29 (0.9) *x2 test. †Kruskall-Wallis test.
Factors Associated With the Probability
of First Interruption
When the absolute risk of interrupting therapy for the first time was compared according to patients’ characteristics, we found that interruptions were more frequently observed among women (compared with men), injection drug users (IDUs; compared with patients infected through other modes of transmission), asymptomatic patients (vs. patients with a previous diagnosis of AIDS), pretreated patients, patients with a higher CD4 cell count nadir, and patients who initially started HAART with a single PI-containing regimen (see Table 1).
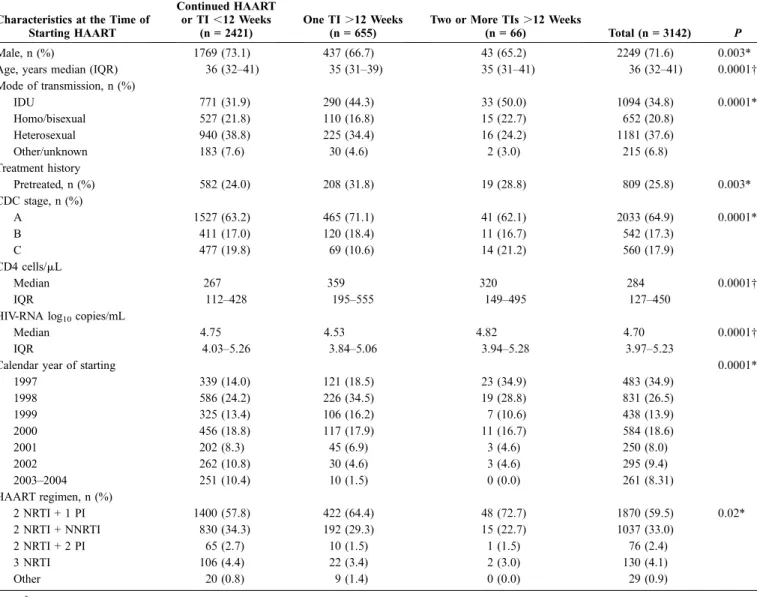
The Kaplan-Meier estimate of the probability of interrupting all drugs for at least 12 weeks for the first time was 28.6% (95% CI: 26.7–30.6) by 4 years from HAART initiation. In this univariate analysis, the rate of occurrence of the first TI seemed to be high over the first 3 months (incidence rate of 11.2 per 100 pys, 95% CI: 9.2–13.4); this rate remained stable over the following 9 months but then almost halved after the first year (5.9 per 100 pys, 95% CI: 5.3–6.5; RR compared with 0–3 months = 0.53, 95% CI: 0.43–0.65; P = 0.0001; Fig. 1). From fitting a multivariate proportional hazards model, women (vs. men [RH = 1.59, 95% CI: 1.15–2.19; P = 0.005]), IDUs (vs. heterosexuals [RH = 1.73, 95% CI: 1.12–2.68; P = 0.01]), and patients with higher measurements of the most recent CD4 count (CD4 .350/mL [RH = 1.95, 95% CI: 1.25– 3.06] vs. CD4 #200/mL; P = 0.004) were more likely to interrupt therapy for the first time for $12 weeks. In contrast, as suggested by the Kaplan-Meier analysis and by analysis of the incidence of interruptions over time, the adjusted RH of interruption decreased in the 3- to 6-month follow-up period (RH = 0.33, 95% CI: 0.21–0.52; P = 0.0001) and in the 6- to 9-month follow-up period (RH = 0.16, 95% CI: 0.11–0.24; P = 0.0001) compared with the first 3 months.
In a subgroup analysis in which only the interruption based on a patient’s decision was considered as an event (and follow-up was censored at the date of interruption for other reasons), in addition to the previous predictors, older patients were less likely to interrupt (RH = 0.72, 95% CI: 0.54–0.96),
whereas antiretroviral-naive patients (vs. pretreated; RH = 1.52, 95% CI: 1.00–2.34; P = 0.05), patients coinfected with hepatitis C virus (HCV; RH = 1.89, 95% CI: 1.08–3.28), and patients with a higher pre-HAART viral load (RH = 1.42 per log10higher, 95% CI: 1.15–1.76; P = 0.001) were more likely
to stop.
Factors Associated With the Probability
of Restarting Therapy
Among the 721 patients who interrupted therapy, the Kaplan-Meier estimate of the median time to resume therapy after the time of the first TI was 12 months (95% CI: 11–14) and 233 patients (32.3%) were still off therapy at the time of their last clinical visit (censored).
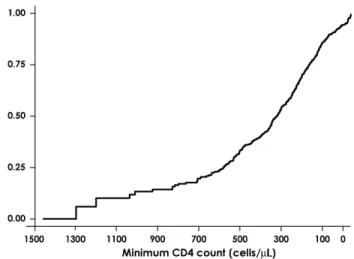
From the Kaplan-Meier analysis using the minimum CD4 cell count over follow-up as the ‘‘survival time’’ in the subpopulation of patients who interrupted with a CD4 count .200 cells/mL, by the time CD4 count had dropped to 200 cells/mL, 76.0% (95% CI: 70.4–81.3) of patients had resumed therapy (Fig. 2). Consistently, when we compared the time to therapy resumption using a multivariate proportional hazards model, we found that the most recent CD4 count after interruption was a strong predictor of the probability of restarting therapy (RH = 0.92 per 100 cells/mL higher, 95% CI: 0.89–0.96; P = 0.0001). Further, patients who stopped because of failure (RH = 2.38 vs. those who stopped because of their own decision, 95% CI: 1.56–3.63; P = 0.0001) and those with a pre-HAART viral load higher than 100,000 copies/mL (RH = 1.79, 95% CI: 1.39–2.29 vs. pretherapy viral load of 500–30,000 copies/mL; P = 0.0001) had a faster rate of therapy resumption after interrupting for the first time. In contrast, there was no evidence that the propensity to restart therapy was different between patients interrupting because of
FIGURE 1. Kaplan-Meier curve: probability of first therapy interruption in 3142 patients starting their first highly active antiretroviral therapy regimen.
FIGURE 2. Probability of resuming therapy by current CD4 count in patients who had a CD4 count .200 cells/mL when they interrupted highly active antiretroviral therapy. Each individual contributed a single CD4 cell count to this analysis: the minimum CD4 count observed during the follow-up period.
drug toxicity and those who stopped because of their own decision (RH = 0.99, 95% CI: 0.78–1.26; P = 0.94).
Interruptions and Risk of Clinical Progression
Over the follow-up period, 281 (8.9%) of the 3142 patients studied experienced clinical progression (168 expe-rienced a new AIDS-defining disease and 113 died). For 50% of participants, the date of the clinical event occurred before the date of their latest CD4 cell count; for an additional 25% of participants, it was recorded within 2 months of their last laboratory test. Overall, for only 5% of patients was the date of the clinical event more than 8 months after the date at which their CD4 count was last monitored. The Kaplan-Meier estimate of the probability of clinical progression by 72 months from starting HAART was 12.9% (95% CI: 11.1– 14.5). Of the 168 AIDS-defining events, 21 (12.5%) were Kaposi sarcoma, 17 (10.2%) were Mycobacterium tuberculo-sis, 17 (10.2%) were esophageal candidiatuberculo-sis, 17 (10.2%) were Mycobacterium avium infections, 15 (9.0%) were Pneumo-cystis carinii pneumonia (PCP), 15 (9.0%) were non-Hodgkin lymphoma, 13 (7.8%) were cytomegalovirus infections, 11 (6.6%) were HIV-related encephalopathy, 10 (6.0%) were brain toxoplasmosis, 8 (4.8%) were recurrent pneumonia, 7 (4.2%) were progressive multifocal leukoencephalopathy, 6 (3.6%) were wasting syndrome, 5 (3.0%) were cervical cancer, 3 (1.8%) were cryptococcosis, 1 (0.6%) was primary brain lymphoma, 1 (0.6%) was herpes simplex disease, and 1 (0.6%) was isosporydiasis.
At the time of these events, 135 patients (48.0%) were receiving prophylaxis against PCP or toxoplasmosis, 49 (17.4%) against mycobacteriosis, 15 (5.3%) against herpes viruses, and 30 (10.7%) against fungal infections, and 8 (2.9%) were receiving other prophylactic drugs. Overall, only 57 patients (31.0%) were not receiving any prophylactic treatment when they developed a clinical event.
In patients who experienced clinical progression, the median CD4 count at the time of the events was 144 cells/mL (IQR: 50–308 cells/mL) and the median HIV-RNA measure-ment was 3.67 log10 copies/mL (IQR: 2.49–5.11 log10
copies/mL). A total of 245 patients (87.2%) had a clinical event when they were receiving therapy (or were off therapy for ,12 weeks) at a median CD4 count and viral load of 157 cells/mL (IQR: 59–329 cells/mL) and 3.18 log10 copies/mL
(IQR: 2.30–5.70 log10 copies/mL), respectively. Thirty-six
patients (12.8%) progressed to AIDS or death while they were off therapy for at least 12 weeks, with a median CD4 count of 90 cells/mL (IQR: 18–178 cells/mL) and a median viral load of 4.94 log10copies/mL (IQR: 3.92–5.35 log10copies/mL). Thus,
in patients who were receiving therapy, clinical events occurred at a significantly lower viral load (P = 0.0007) and higher CD4 count (P = 0.002) than those observed in patients who were off therapy.
The whole cohort represented 10,293 pys of follow-up, which could be divided into 9251 pys on therapy or ,12 weeks off and 1042 pys of interruptions of at least 12 weeks. Thus, the rate of clinical events while patients were on therapy was 245 per 9251 pys (ie, 2.6 per 100 pys, Poisson exact 95% CI: 2.3–3.0), and 36 events per 1042 pys were observed during TI, giving a rate of 3.5 per 100 pys (95% CI: 2.4–4.8).
Therefore, the crude RR of AIDS and death during periods off therapy compared with periods on therapy was 1.30 (95% CI: 0.89–1.86; P = 0.14).
In an attempt to evaluate the risk of clinical progression associated with TI in a context in which CD4 counts during TI were more closely monitored, we tested the hypothesis of the presence of an interaction between the time-dependent covariate indicating a TI and the current CD4 count (stratified using the cutoffs of 50 and 200 cells/mL). The assumption was that the strata with a current CD4 count of .200 cells/mL would give an estimate of the risk of AIDS or death associated with CD4 count–guided TI, during which it is unlikely to observe a CD4 count #200 cells/mL. Indeed, this may represent the only sensible way to distinguish between different TIs in an observational setting. From this analysis performed on the subset of patients with an available measure-ment of the most recent CD4 count (281 events over 10,185 pys), there was little statistical evidence that the risk of clinical progression associated with TI was different in patients with different levels of current CD4 count (P = 0.41 for interaction). At a high CD4 count, however, the absolute rates were more similar between the 2 groups: the RH of AIDS or death associated with a TI was 1.89 (95% CI: 1.05–3.36) in patients with 0 to 50 cells/mL, the RH was 1.64 (95% CI: 0.98–2.73) in those with 51 to 200 cells/mL, and the RH was 0.54 (95% CI: 0.24–1.21) in those with .200 cells/mL (Table 2).
Using a univariate Cox model and the time-dependent covariate described in the section on methods, we found that a TI of at least 12 weeks was associated with an RH of 3.45 compared with continued therapy (95% CI: 2.18–5.45; P = 0.0001). Having a TI of at least 12 weeks remained an independent predictor of the risk of AIDS or death after adjusting for baseline factors such as gender, age, mode of HIV transmission, viral load, CD4 cell count, CDC disease stage, and type of HAART regimen as well as the current change in CD4 cell count and viral load from baseline (Table 3). Other factors independently associated with the risk of AIDS or death from this analysis were the mode of HIV transmission (IDUs were at higher risk than those infected via heterosexual sex [RH = 1.85, 95% CI: 1.37–2.51; P = 0.0001]) at baseline CDC stage B vs. stage A ([RH = 1.47; 95% CI: 1.05–2.05, P = 0.03] or at stage C vs. stage A [RH = 2.23, 95% CI: 1.63–3.06; P = 0.0001]) and a pretherapy viral load higher than 100,000 copies/mL (RH = 1.47, 95% CI: 1.05–2.06) versus a viral load 500 to 30,000 copies/mL (P = 0.03; see Table 3). In contrast, patients with a higher CD4 count nadir (CD4 count .350 cells/mL [RH = 0.38, 95% CI: 0.26–0.56; P = 0.0001] and CD4 count of 201–350 cells/mL [RH = 0.60, 95% CI: 0.43–0.85; P = 0.004] both vs. CD4 count ,200 cells/mL) and with greater current viral load suppression on therapy (.2 log10copies/mL suppression less than pretherapy
levels [RH = 0.44, 95% CI: 0.23–0.83] vs. #1 log10copies/mL
or increase; P = 0.01) were at a lower risk of clinical progression (see Table 3).
Finally, from fitting a multivariate Cox model with a time-dependent covariate capturing the duration of TI fitted as a continuous variable rather than as a binary variable indicating whether a patient was or was not off therapy for longer than 12 weeks, the risk of clinical progression was
estimated to increase by 12% (95% CI: 1%–23%; P = 0.02) per each additional month spent off therapy (see Table 3, model 2).
DISCUSSION
Our analysis of a large cohort of patients, who were mostly antiretroviral-naive before starting their first HAART regimen, has shown that a substantial proportion of patients are likely to experience a long TI (of at least 12 weeks), with a probability of 28.6% by 4 years from the date of therapy initiation; the median time of resuming therapy after this first interruption was 12 months. Our analysis focused on interruptions that occurred over the calendar period between September 1997 and February 2004. Most regimens (46%) that were interrupted were HAART combinations including a single PI, that are no longer in use in the clinic. Nevertheless, 38% of the patients had an interrupted HAART combination regimen containing an NNRTI or a ritonavir-boosted PI. It would be interesting to repeat the analysis in the near future when a higher percentage of patients would be receiving more ‘‘modern’’ combinations. The main reasons for stopping ther-apy are related to patient requests and drug toxicities, account-ing for 81% of the reasons reported by the treataccount-ing physicians. Patients receiving 3 NRTIs (with 1 being abacavir) were less likely to interrupt because of nonadherence compared with the other regimens.
Our analysis has shown that HAART interruption was associated with a 3.5-fold increased risk of clinical progression in a univariate Cox model. Because those who interrupted
therapy tended to have higher CD4 counts, however, this could be an underestimate of the detrimental effect of TI. The CD4 count, being associated with the risk of clinical progression, is a confounder (patients who interrupted tend to have a higher CD4 count) and an intermediate variable (interruption affects the CD4 count) in the association between TI and the risk of developing AIDS or death, and standard Poisson or survival analyses do not allow control of confounding without simultaneous adjustment for the effect of TI on CD4 counts. Approaches to estimation of relative risks in these circum-stances have been suggested.25
We chose not to implement these methods, because our focus was less on the exact magnitude of the known negative effect of TI on clinical progression and more on the effect of TI after adjustment for the CD4 cell count and viral load. Indeed, even after adjust-ment for the current CD4 cell count, viral load, and other potential confounding factors, the RH remained significantly raised at 2.75, suggesting that CD4 depletion (and the increase in viral load) may only partly explain the increased risk in clinical progression during TI.
Treatment interruptions are commonly observed in clinical settings, and a large proportion of patients who decide to interrupt therapy are known to physicians, who, although are not encouraging this policy, may have no convincing arguments to discourage it; thus, a critical evalua-tion of this phenomenon as well as of its impact on the clinical course of HIV infection is needed. Specifically, it is unclear whether the potential risks of interrupting therapy can be compensated for by its potential benefits, for example, in terms of reduction of exposure to antiretroviral drugs and potential
TABLE 2. Incidence of Clinical Events in Periods When Patients Were On or Off Therapy According to the Current CD4 Count (Only 10,185 pys With a Measure of CD4 Count Were Used)
Current CD4 Count
Off Therapy
On
Therapy Total Crude RR (95% CI) P
.200 Events 6 100 106 pys 883 7917 8800 Rate 100 pys 0.6 1.3 1.2 (95% CI) (0.2–1.5) (1.0–1.5) (0.9–1.5) 0.53 (0.24–1.21) P = 0.14 51–200 Events 17 87 104 pys 125 1021 1146 Rate 100 pys 13.7 8.5 0.9 (95% CI) (7.9–21.8) (6.8–10.5) (0.7–1.1) 1.64 (0.98–2.73) P = 0.06 0–50 Events 13 58 71 pys 26 215 241 Rate 100 pys 50.0 26.9 29.4 (95% CI) (26.6–85.5) (20.5–35.9) (23.0–37.2) 1.89 (1.06–3.36) P = 0.03 Total Events 36 245 281 pys 1033 9152 10,185 Rate 100 pys 3.2 2.7 2.8 (95% CI) (2.2–4.5) (2.4–3.0) (2.4–3.1)
TABLE 3. Factors Independently Associated With the Probability of Developing New AIDS Related Events or Death From Fitting a Proportional Hazards Model
Crude Analysis Adjusted Analysis
Factor Crude RH (95% CI) P Adjusted RH (95% CI) P
Men 1.00 1.00
Women 0.69 (0.52–0.91) 0.01 0.84 (0.61–1.16) 0.29
Age, years
Per 10 years older 1.14 (0.99–1.29) 0.06 1.05 (0.90–1.23) 0.51
Mode of HIV transmission
Heterosexual 1.00 1.00 IDU 1.79 (1.35–2.36) 0.0001 1.85 (1.37–2.51) 0.0001 Homo/bisexual 1.20 (0.8–1.69) 0.32 1.21 (0.83–1.77) 0.33 Other/unknown 1.23 (0.73–2.08) 0.43 1.13 (0.66–1.92) 0.65 TI Model 1 No or ,12 weeks 1.00 1.00 Yes 3.45 (2.18–5.45) 0.0001 2.75 (1.14–6.65) 0.03 Model 2
Per month longer 1.03 (1.01–1.05) 0.0007 1.12 (1.01–1.23) 0.02
1993 CDC classification A 1.00 1.00 B 2.03 (1.48–2.80) 0.0001 1.47 (1.05–2.05) 0.03 C 4.04 (3.11–5.26) 0.0001 2.23 (1.63–3.06) 0.0001 CD4 count nadir Model 1
Per 100 cells/mL higher 0.70 (0.65–0.75) 0.0001 0.80 (0.74–0.87) 0.0001
Model 2 (categoric)
0–200 1.00 1.00
201–350 0.40 (0.30–0.55) 0.0001 0.60 (0.43–0.85) 0.004
.350 0.21 (0.15–0.29) 0.0001 0.38 (0.26–0.56) 0.0001
Current CD4 count change from baseline Model 1
Per 100 cells/mL greater 0.84 (0.73–0.97) 0.01 0.96 (0.83–1.11) 0.58
Model 2 (categoric)
#100 or decrease 1.00 1.00
101–200 increase 0.59 (0.30–1.15) 0.12 0.72 (0.34–1.52) 0.39
.200 increase 0.66 (0.38–1.14) 0.14 1.04 (0.56–1.95) 0.90
Pretherapy viral load Model 1
Per log10copies/mL higher 1.59 (1.39–1.88) 0.0001 1.21 (1.04–1.40) 0.01
Model 2 (categoric)
501–30,000 1.00 1.00
30,001–100,000 1.62 (1.14–2.31) 0.007 1.30 (0.90–1.86) 0.16
.100,000 2.45 (1.80–3.37) 0.0001 1.47 (1.05–2.06) 0.03
Current viral load suppression relative to baseline Model 1
per log10copies/mL greater 0.71 (0.60–0.85) 0.0002 0.76 (0.63–0.92) 0.004
Model 2 (categoric)
#1 log or increase 1.00 1.00
1–2 logs suppression 0.60 (0.30–1.20) 0.15 0.63 (0.31–1.31) 0.29
.2 logs suppression 0.41 (0.23–0.72) 0.002 0.44 (0.23–0.83) 0.01
improvements of toxicity profiles and quality of life. Indeed, treatment ‘‘holidays’’ can potentially reduce the stress of continuous timing of the drugs,26
probability of experiencing side effects and toxicities such as dyslipidemia, and modifi-cations of the body shape or lipodystrophy known to be related to prolonged use of therapy.27
In contrast, the benefits associated with an enhancement of the HIV-specific cellular immune response after a TI seem to be negligible. Data from pilot studies and randomized trials on supervised TI in chronically infected patients with well-controlled viral replication showed a partial restoration of HIV-specific cellular immunity after TI but also little evidence that this immune response was then capable of controlling viral replication.9–11
To our knowledge, there are few published data on TIs and their consequences in clinical settings, and the results are conflicting. An important study, including a large number of patients enrolled in the Swiss cohort, considered TI up to only 3 months.17
In that study of 4720 patients, 1299 of whom underwent TI, the authors did not find any correlations between interruption of therapy and death or new AIDS-defining events. In contrast, in a randomized study of a group of 270 patients with multidrug-resistant HIV and a plasma viral load .5000 copies/mL, a 4-month STI was associated with greater progression of disease without immunologic or virol-ogic benefits or improvement of quality of life.14
We decided to address the problem in another way by considering only presumably preplanned interruptions with a duration of 3 months or more, because this is becoming a relatively common situation in clinical settings, and to look at the possible detrimental effect of such interruptions on clinical progression of HIV infection. Most of these interrup-tions were made on the basis of patient decision. Unfortu-nately, the reason for interruption in our database is collected using the general classification of ‘‘patient decision,’’ and the real reason why patients are making such a decision is not specified; however, we can speculate that a consistent proportion of interruptions is decided on between patients and treating clinicians and is a result of side effects or other clinical reasons.
The first observation from our data is that the likelihood of interrupting treatment (for at least 3 months) decreased with longer exposure to therapy. Because more than half of the interruptions seemed to be determined by patient decision and another 24% by drug toxicity, it could be argued that the commitment of our patients to therapy is not so strong and, in turn, that long-term toxicities do not yet have a large impact on this cohort. This may be explained by the fact that most of our patients were antiretroviral naive at enrollment; consequently, the total time of exposure to HAART is relatively shorter compared with that of patients in other cohorts. Actually, only 24 patients interrupted therapy because of lipodystrophy, and 16 interrupted therapy because of metabolic toxicities (data not shown).
Women, IDUs, and, if the decision for interrupting was primarily made by the patient, HCV antibody–positive individuals were more likely to interrupt therapy; another previous analysis has shown that women and HCV-coinfected subjects of the I.Co.N.A. are at higher risk of experiencing
toxicities.7,28
Moreover, TIs seemed more likely to occur at higher values of the current CD4 cell count, further confirming that most interruptions are in the context of successful rather than failing therapy. From our estimates, patients with a current CD4 count higher than 350 cells/mL are almost twice as likely to interrupt therapy as those with a current CD4 count ranging between 201 and 350 cells/mL.
It is important to observe that the median time to therapy resumption was 1 year. Given a median decay of 16 CD4 cells/mL per month, as reported in 72 patients interrupting a successful therapy regimen for more than 12 weeks,29over
a time span of 1 year, the risk of experiencing critical CD4 count levels is high. In our cohort, even if the decision to interrupt therapy was mainly made by the patients, it was possible to monitor their level of immunosuppression during the periods when they were off therapy. Actually, the decision to resume therapy seemed to be mainly driven by the CD4 cell count during interruption, and more than 75% of patients interrupting therapy with CD4 counts greater than 200 cells/mL resumed therapy once the CD4 count dropped to less than 200 cells/mL. The probability of resuming therapy was 8% lower per 100 cells/mL higher in the most recent CD4 count; in addition, patients stopping therapy because of failure were 2.4 times more likely to resume it than those interrupting based on their own decision. Similar results have been obtained in other cohort studies.30
Most importantly, our data have shown a detrimental effect of therapy interruptions of more than 12 weeks on the short-term risk of clinical progression. These results are consistent with those of a previous cohort study.21
Moreover, subjects who already have AIDS and those with a higher viral load before starting therapy were also at higher risk of clinical progression, whereas those with a higher CD4 count nadir were at lower risk; these findings confirm the established importance of baseline CD4 counts and HIV-RNA copy levels in predicting the clinical outcome of HAART.31,32
Interest-ingly, the risk of AIDS or death was also reduced in patients with current viral suppression from pretherapy levels of .2 log10copies/mL compared with those with a reduction less than
1 log10.
In conclusion, TIs of at least 12 weeks are not uncom-mon in clinical practice; in up to 80% of our cases, they were requested by the patients or seemed to be associated with drug-related toxicity. Women, IDUs, and HCV-infected indi-viduals seemed to be at a higher risk of having interruptions. Once therapy is interrupted for 12 weeks or more, patients seem to remain off therapy, on average, for 1 year, and the decision to restart therapy is mainly based on CD4 cell count depletion. Unfortunately, the risk of clinical progression during these interruptions seems to be remarkably higher than that of patients under continuous therapy such that patients interrupting treatment need to be accurately monitored and perhaps discouraged outside strictly experimental settings. When the current CD4 count was .200 cells/mL, there was some evidence that the risk of AIDS or death in patients who had interrupted therapy and in those remaining on HAART was similarly low, suggesting that more analyses should be carried out in patients with this level of CD4 cell count.
REFERENCES
1. Palella FJ, Delaney KM, Moorman AC, et al. Declining morbidity and mortality among patients with advanced human immunodeficiency virus infection. N Engl J Med. 1998;338:853–860.
2. Mocroft A, Vella S, Benfield TL, et al. Changing patterns of mortality across Europe in patients infected with HIV-1. Lancet. 1998;352:1725– 1733.
3. Hammer SM, Kathleen ES, Hughes MD, et al. A controlled trial of two nucleoside analogues plus indinavir in persons with human immunode-ficiency virus infection and CD4+ cell counts of 200 per cubic millimeter or less. N Engl J Med. 1997;337:725–733.
4. Cameron DW, Hearth-Chiozzi M, Danner S, et al. Randomized placebo-controlled trial of ritonavir in advanced HIV-1 disease. Lancet. 1998;351:543–549.
5. Lederberger B, Egger M, Opravil M, et al. Clinical progression and virological failure on highly active antiretroviral therapy in HIV-1 patients: a prospective cohort study: Swiss HIV Cohort Study. Lancet. 1999; 353:863–868.
6. Detels R, Tarwater P, Phair JP, et al, for the Multicenter AIDS Cohort Study. Effectiveness of potent antiretroviral therapies on the incidence of opportunistic infections before and after AIDS diagnosis. AIDS. 2001; 15:347–355.
7. d’Arminio Monforte A, Cozzi Lepri A, Rezza G, et al. Insights into the reasons for discontinuation of the first highly active antiretroviral therapy (HAART) regimen in a cohort of antiretroviral naive patients. I.Co.N.A. Study Group. Italian Cohort of Antiretroviral-Naive Patients. AIDS. 2000;14:499–507.
8. Paterson DL, Swindells S, Mohr J, et al. Adherence to protease inhibitor therapy and outcomes in patients with HIV infection. Ann Intern Med. 2000;133:21–30.
9. Ruiz L, Carcelain G, Martinez-Picado J, et al. HIV dynamics and T-cell immunity after three structured treatment interruptions in chronic HIV-1 infection. AIDS. 2001;15(Suppl):F19–F27.
10. Garcia F, Montserrat P, Ortiz GM, et al. The virological and immunological consequences of structured treatment interruptions in chronic HIV-1 infection. AIDS. 2002;15(Suppl):F29–F40.
11. Oxenius A, Price DA, Gunthard HF, et al. Stimulation of HIV-specific cellular immunity by structured treatment interruption fails to enhance viral control in chronic HIV infection. Proc Natl Acad Sci USA. 2002; 99:13747–13752.
12. Deeks SG, Wrin T, Liegler T, et al. Virological and immunological consequences of discontinuing combination antiretroviral-drug therapy in HIV infected patients with detectable viremia. N Engl J Med. 2001; 344:472–480.
13. Katlama C, Dominguez S, Duvivier C, et al. Long-term benefit of treatment interruption in salvage therapy (GIGHAART ANRS 097) [abstract 68]. Presented at the 10th Conference on Retroviruses and Opportunistic Infections; 2003; Boston.
14. Lawrence J, Mayers DL, Hullsiek KH, et al, for the 064 Study Team of the Terry Beirn Community Programs for Clinical Research on AIDS. Structured treatment interruption in patients with multidrug-resistant human immunodeficiency virus. N Engl J Med. 2003;349:837–846. 15. Ruiz L, Go´mez L, Domingo P, et al. A multicenter, randomized, controlled
clinical trial of continuous vs. intermittent HAART guided by CD4+ T-cell counts and plasma HIV-1 RNA levels [abstract 65]. Presented at the 10th Conference on Retroviruses and Opportunistic Infections; 2003; Boston.
16. Miller V, Sabin C, Hertogs K, et al. Virological and immunological effects of treatment interruptions in HIV-1 infected patients with treatment failure. AIDS. 2000;14:2857–2867.
17. Taffe´ P, Rickenbach M, Hirschel B, et al. Impact of occasional short interruptions of HAART on the progression of HIV infection: results from a cohort study. AIDS. 2002;16:747–755.
18. Chen RY, Westfall AO, Raper JL, et al. Immunologic and virologic consequences of temporary antiretroviral treatment interruption in clinical practice. AIDS Res Hum Retroviruses. 2002;18:909–916.
19. Poulton MB, Sabin CA, Fisher M. Immunological changes during treat-ment interruptions: risk factors and clinical sequelae.AIDS. 2003;17:126–128. 20. Youle M, Janossy G, Turnbull W, et al. Changes in CD4 lymphocyte counts after interruption of therapy in patients with viral failure on protease inhibitor-containing regimens. AIDS. 2000;14:1717–1720.
21. Lundgren JD, Vella S, Paddam L, et al. Interruption/stopping antiretroviral therapy and the risk of clinical disease: results from the EuroSIDA Study [abstract 48]. Presented at the Ninth Conference on Retroviruses and Opportunistic Infections; 2002; Seattle.
22. Department of Health and Human Services (DHHS). Guidelines for the use of antiretroviral agents in HIV-1-infected adults and adolescents. July 14, 2003. Available at: http://AIDSinfo.nih.gov.
23. Phillips AN, Lee CA, Elford J, et al. The cumulative risk of AIDS as the CD4 lymphocyte count declines. J Acquir Immune Defic Syndr. 1992; 5:148–152.
24. Centers for Disease Control and Prevention. 1993 Revised system for HIV infection and expanded surveillance case definition for AIDS among adolescents and adults. MMWR. 1992;41:9–12.
25. Robins JM, Blevins D, Ritter G, et al. G-estimation of the effect of prophylaxis therapy for Pneumocystis carinii pneumonia on the survival of AIDS patients. Epidemiology. 1992;3:319–336.
26. Tuldra` A, Fumaz CR, Ferrer MJ, et al. Psychological impact of structured treatment interruptions in patients with prolonged undetectable HIV-1 viral loads. AIDS. 2001;15:1904–1906.
27. Carr A, Samaras K, Burton S, et al. A syndrome of peripheral lipodystrophy, hyperlipidaemia and insulin resistance in patients receiving HIV protease inhibitors. AIDS. 1998;12(Suppl):F51–F58.
28. d’Arminio Monforte A, Bugarini R, Pezzotti P, et al. Low frequency of severe hepatic cytolysis and strong association with HCV coinfection in HIV-positive patients treated with HAART. J Acquir Immune Defic Syndr. 2001;28:114–123.
29. Tebas P, Henry K, Mondy K, et al. Effect of prolonged discontinuation of successful antiretroviral therapy on CD4+ T cell decline in human immunodeficiency virus-infected patients: implications for intermittent therapeutic strategies. J Infect Dis. 2002;186:851–854.
30. Mussini C, Bugarini R, Perno CF, et al. Kinetics of CD4 cells after discontinuation of antiretroviral therapy in patents with virological failure and a CD4 cell count greater than 500 cells/mL. AIDS. 2002;16:1551– 1554.
31. Hogg RS, Yip B, Chan KJ, et al. Rates of disease progression by baseline CD4 cell count and viral load after initiating triple-drug therapy. JAMA. 2001;286:2568–2577.
32. Egger M, May M, Cheˆne G, et al, and the ART Cohort Collaboration. Prognosis of HIV-1 infected patients starting highly active antiretroviral therapy: collaborative analysis of prospective studies. Lancet. 2002; 360:119–129.
APPENDIX
The I.Co.N.A. study group consists of the following individuals:
Italy
Ancona: M. Montroni, G. Scalise, A. Zoli, M. S. Del Prete; Aviano (PN): U. Tirelli, G. Di Gennaro; Bari: G. Pastore, N. Ladisa, G. Minafra; Bergamo: F. Suter, C. Arici; Bologna: F. Chiodo, V. Colangeli, C. Fiorini, O. Coronado; Brescia: G. Carosi, G. P. Cadeo, F. Castelli, C. Minardi, D. Vangi; Busto Arsizio: G. Rizzardini, G. Migliorino; Cagliari: P. E. Manconi, P. Piano; Catanzaro: T. Ferraro, A. Scerbo; Chieti: E. Pizzigallo, M. D’Alessandro; Como: D. Santoro, L. Pusterla; Cremona: G. Carnevale, D. Galloni; Cuggiono: P. Vigano`, M. Mena; Ferrara: F. Ghinelli, L. Sighinolfi; Firenze: F. Leoncini, F. Mazzotta, M. Pozzi, S. Lo Caputo; Foggia: G. Angarano, B. Grisorio, S. Ferrara; Galatina (LE): P. Grima, P. Tundo; Genova: G. Pagano, N. Piersantelli, A. Alessandrini, R. Piscopo; Grosseto: M. Toti, S. Chigiotti; Latina: F. Soscia, L. Tacconi; Lecco: A. Orani, P. Perini; Lucca: A. Scasso, A. Vincenti; Macerata: F. Chiodera, P. Castelli; Mantova: A. Scalzini, G. Fibbia; Milano: M. Moroni, A. Lazzarin, A. Cargnel, G. M. Vigevani, L. Caggese, A. d’Arminio Monforte, D. Repetto, R. Novati, A. Galli,
S. Merli, C. Pastecchia, M. C. Moioli; Modena: R. Esposito, C. Mussini; Napoli: N. Abrescia, A. Chirianni, C. Izzo, M. Piazza, M. De Marco, V. Montesarchio, E. Manzillo, M. Graf; Palermo: A. Colomba, V. Abbadessa, T. Prestileo, S. Mancuso; Parma: C. Ferrari, P. Pizzaferri; Pavia: G. Filice, L. Minoli, R. Bruno, S. Novati; Perugia: F. Balzelli, K. Loso; Pesaro: E. Petrelli, A. Cioppi; Piacenza: F. Alberici; A. Ruggieri; Pisa: F. Menichetti, C. Martinelli; Potenza: C. De Stefano, A. La Gala; Ravenna: G. Ballardini, E. Briganti; Reggio Emilia: G. Magnani, M. A. Ursitti; Rimini: M. Arlotti, P. Ortolani; Roma: R. Cauda, F. Dianzani, G. Ippolito, A. Antinori, G. Antonucci, S. D’Elia, P. Narciso, N. Petrosillo, V. Vullo,
A. De Luca, A. Del Forno, M. Zaccarelli, R. Acinapura, P. De Longis, M. Ciardi, G. D’Offizi, M. P. Trotta, P. Noto, M. Lichtner, M. R. Capobianchi, E. Girardi, P. Pezzotti, G. Rezza; Sassari: M. S. Mura, M. Mannazzu; Torino: P. Caramello, A. Sinicco, M. L. Soranzo, L. Gennero, M. Sciandra, M. Bonasso; Varese: P. A. Grossi, C. Basilico; Verbania: A. Poggio, G. Bottari; Venezia: E. Raise, S. Pasquinucci; Vicenza: F. De Lalla, G. Tositti; Taranto: F. Resta, A. Chimienti