mPGES-1 in prostate cancer controls
stemness and amplifies epidermal
growth factor receptor-driven
oncogenicity
Federica Finetti1, Erika Terzuoli1, Antonio Giachetti1, Raffaella Santi2, Donata Villari3, Hiromi Hanaka4, Olof Radmark4, Marina Ziche1,5and Sandra Donnini1,5
1Department of Life Sciences, University of Siena, Via Aldo Moro 2, 53100 Siena, Italy
2Department of Surgery and Translational Medicine, University of Florence, Largo Brambilla 3, 50134 Firenze, Italy 3Department of Clinical and Experimental Medicine, University of Florence, Viale Pieraccini 18, 50139 Firenze, Italy 4Department of Medical Biochemistry and Biophysics, Karolinska Institutet, SE-171 77 Stockholm, Sweden 5Istituto Toscano Tumori (ITT), Firenze, Italy
Correspondence should be addressed to S Donnini or M Ziche Emails [email protected] or [email protected]
Abstract
There is evidence that an inflammatory microenvironment is associated with the
development and progression of prostate cancer (PCa), although the determinants of intrinsic inflammation in PCa cells are not completely understood. Here we investigated whether expression of intrinsic microsomal PGE synthase-1 (mPGES-1) enhanced aggressiveness of PCa cells and might be critical for epidermal growth factor receptor (EGFR)-mediated tumour progression. In PCa, overexpression of EGFR promotes metastatic invasion and correlates with a high Gleason score, while prostaglandin E2(PGE2) has been reported to modulate oncogenic EGFR-driven oncogenicity. Immunohistochemical studies revealed that mPGES-1 in human prostate tissues is correlated with EGFR expression in advanced tumours. In DU145 and PC-3 cell lines expressing mPGES-1 (mPGES-1SCcells), we demonstrate that silencing or ‘knock down’ of mPGES-1 (mPGES-1KD) or pharmacological inhibition by MF63 strongly attenuates overall oncogenic drive. Indeed, mPGES-1SCcells express stem-cell-like features (high CD44, b1-integrin, Nanog and Oct4 and low CD24 and a6-integrin) as well as mesenchymal transition markers (high vimentin, high fibronectin, low E-cadherin). They also show increased capacity to survive irrespective of anchorage condition, and overexpress EGFR compared to mPGES-1KD cells. mPGES-1 expression correlates with increased in vivo tumour growth and metastasis. Although EGFR inhibition reduces mPGES-1SCand mPGES-1KDcell xenograft tumour growth, we show that mPGES-1/PGE2signalling sensitizes tumour cells to EGFR inhibitors. We propose mPGES-1 as a possible new marker of tumour aggressiveness in PCa.
Key Words " mPGES-1 " prostate cancer " stemness " EGFR " EMT Endocrine-Related Cancer (2015) 22, 665–678
Introduction
Prostate cancer (PCa) is currently treated with androgen deprivation and chemotherapeutic agents. Resistance to chemotherapy, a mounting issue in clinical oncology due to its association with tumour recurrence, has hastened
the search for new prognostic biomarkers and new therapeutic targets aimed at patient stratification in relation to treatment (Schrecengost & Knudsen 2013,
Augello et al. 2014). Because w40% of PCas express
En
docrine
-Rela
ted
epidermal growth factor receptor (EGFR), expression of which is correlated with tumour recurrence and high Gleason score, the receptor is assumed to be a potential molecular target for advanced PCa. However, clinical trials in PCa patients have shown limited efficacy of EGFR-targeted drugs (Canil et al. 2005,Hammarsten et al. 2007, Schlomm et al. 2007, Gravis et al. 2008, Nabhan et al. 2009). Multiple mechanisms, such as unrestrained expression of EGFR, emergence of oncogenic mutants (KRAS, BRAF and PIK3CA) and inactivation of the PTEN tumour suppressor gene, underlie resistance to these drugs. Acquired EGFR antagonist resistance is often associated with the activation of bypass signalling path-ways typically embedded in tumour cells or the surround-ing tissue (Arteaga 2002, Wieduwilt & Moasser 2008, Cathomas et al. 2012,Seshacharyulu et al. 2012).
Inflammatory molecules have been shown to enhance EGFR oncogenic action in epithelial tumours, fostering their propensity to metastasize. Many studies on the link between inflammation and cancer have dealt with stimuli
originating from the cancer microenvironment
(extrinsic), providing strong support for this mechanism
(Mantovani et al. 2008, Hanahan & Weinberg 2011,
Coussens et al. 2013).
Microsomal PGE synthase-1 (mPGES-1), known to be induced in inflammatory as well as tumour cells by pro-inflammatory cytokines, such as interleukin-1 beta (IL-1b) and tumour necrosis factor alpha (TNFa), contributes in a critical way to tumour progression (Jakobsson et al. 1999, van Rees et al. 2003,Takeda et al. 2004,Kamei et al. 2009, Xu et al. 2012,Sha et al. 2013,Takahashi et al. 2014). We recently found that EGFR activation up-regulates mPGES-1, which in turn promotes phosphorylation of EGFR through prostaglandin E2(PGE2) (Donnini et al. 2012).
Here we investigated whether expression of intrinsic mPGES-1 in advanced PCa cells enhanced their aggres-siveness and might be critical for EGFR-mediated tumour progression. To begin to understand the mechanism underlying enhanced prostate oncogenic drive exerted by mPGES-1, we first examined human PCa specimens obtained after prostatectomy in a group of patients showing various stages of malignancy. The close associ-ation between mPGES-1 and EGFR expression observed in these tumours led us to detailed study of this connection in experiments on hormone-independent PCa cells DU145 and PC-3 in vitro and in vivo. We demonstrate that these cells have a mesenchymal phenotype and stem-like features, which are stem-likely to confer aggressive traits. Evidence that intrinsic mPGES-1 underpins these traits is seen in cell cultures in which ablation of the mPGES-1
gene (DU145 mPGES-1KD) or inhibition of mPGES-1 activity prevents development of a vigorous tumorigenic phenotype. The enhanced oncogenic drive observed in vitro translated to nude mice in vivo inoculated with DU145 or PC-3 cells, as we found significantly higher tumour growth and lung metastasis formation in mice inoculated with PCa cells expressing mPGES-1. Further, blockade of EGFR in vivo with erlotinib indicated the possibility of quenching the oncogenic drive exerted by malignant cooperation of the two signals (PGE2and EGF).
Materials and methods
Tumour samplesFor PCa immunohistochemical study, formalin-fixed, paraffin-embedded tissue blocks from 52 radical prosta-tectomy specimens were retrieved from the archives of the University of Florence (Florence, Italy). Informed consent and approval according to the Helsinki Declaration were obtained from the local ethics review board. The speci-mens were reviewed by two genitourinary pathologists; pathological stage and tumour grade were assigned according to tumour/lympho-node/metastasis (TNM) (2010) classification and the Gleason score, respectively
(Epstein et al. 2005, Edge et al. 2010). Twenty-five
carcinomas were limited to the prostate (pT2, organ-confined PCa) and were moderately differentiated (Gleason scoreZ6), whereas 27 cases (advanced PCa) were non-organ-confined tumours (pT3/pT4) with a high Gleason score (R7) (Table 1). The median age of patients was 67.7 years (range 41–78 years).
Immunohistochemical analysis of tumour samples Tissue slides were deparaffinised in xylene and dehydrated in ethanol. Microwave pre-treatment in EDTA (pH 9.0) (for EGFR) or in citrate buffer (pH 6.0) (for mPGES-1 and a6-integrin) was performed for 20 min. Endogenous peroxi-dase activity was blocked with 3% hydrogen peroxide (v/v) for 10 min and with 3% BSA (w/v) for 30 min. The slides were incubated with primary antibodies targeting
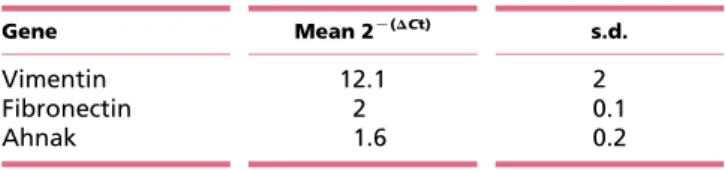
Table 1 Gene expression of vimentin, fibronectin and ahnak in DU145 cells expressing mPGES-1
Gene Mean 2K(DCt) s.d. Vimentin 12.1 2 Fibronectin 2 0.1 Ahnak 1.6 0.2 En docrine -Rela ted Cancer
a6-integrin (1:100; Santa Cruz, Heidelberg, Germany), mPGES-1 (1:50; Thermo Scientific, Waltham, MA, USA) and EGFR (1:100; Cell Signalling, Leiden, The Netherlands) followed by chromogenic visualization using Immuno-peroxidase Secondary Detection System kits (Chemicon, Billerica, MA, USA). In particular, sections were incubated for 15 min in the appropriate species-specific biotinylated secondary antibodies and then with streptavidin-conjugated HRP for 15 min. After incubation they were exposed to 3,3-diaminobenzidine tetrahydrochloride (Sigma) for 10 min to produce a brown reaction product. After counterstaining with hematoxylin, slides were washed thoroughly, dehydrated, cleared in xylene and mounted. Staining intensity was scored as negative (no staining) or positive (brown colour).
Cell lines
DU145 WT (passages 5–20, ATCC HTB-81, certified by STRA) is a PCa cell line with high constitutive expression of mPGES-1 (Hanaka et al. 2009). DU145 mPGES-1 knockdown (mPGES-1KD cells, passages 8–20) and non-target shRNA (mPGES-1SCcells, 8–20) cells were obtained and cultured as described (Hanaka et al. 2009). PC-3 WT (passages 8–20, ATCC CRL-1435, certified by STRA) and LNCaP WT (passages 5–15, ATCC CRL-1740, certified by STRA) PCa cells were from ATCC. Cells were grown in RPMI (Euroclone, Pero Milano, Italy) and supplemented with 10% FBS (v/v). Human umbilical vein endothelial cells (HUVEC, passages 3–10) were from Lonza (Basel, Switzerland) (C2519A, certified by expression of CD31/105, vWFVIII, and positivity for acetylated low-density lipoprotein uptake). Cells were grown in endo-thelial growth medium (EGM-2) (Clonetics, Lonza) and supplemented with 10% FBS (v/v).
Transient mPGES-1 silencing
For siRNA transfection, the siRNAs sequence (human mPGES-1: 50-CGGGCTAAGAATGCAGACTTT-30) was from Qiagen. The day before transfection, cells were trypsinized and 3!105cells were seeded in six-well plates. Transient transfection of siRNA was carried out using Lipofectamin 2000 (Invitrogen) according to the manufacturer’s instructions. Cells were assayed 72 h after transfection.
mPGES-1 shRNA transfection
Lenti vector plasmids for mPGES-1 knock down (Sigma) and mPGES-1C/C (p Lenti vector with C-terminal
Myc-DDK tag-NM_004878) were obtained from Sigma and Origene (Origene, Rockville, MD, USA), respectively. psPAX2 packaging plasmid (12260) and pMDG.2 envelope
plasmid (12259) were obtained from Addgene
(Cambridge, MA, USA).
All the plasmids were sequence-verified. To generate mPGES-1 knock down (mPGES-1KD) cells or mPGES-1 overexpressing (C/C) cells, 1!106 HEK293 cells (Life Technologies) were transfected with 2.25 mg of PAX2 packaging plasmid, 0.75 mg of PMD2G envelope plasmid and 3 mg of pLKO.1 hairpin vector utilizing 12 ml of Lipofectamine 2000 on 10 cm plates. Polyclonal popu-lations of transduced cells were generated by infection with 1 multiplicity of infectious units (MOI) of lentiviral particles. Three days after infection, cells were selected with 10 mg/ml puromycin (Gibco) or 20 mg/ml neomycin/ kanamycin (Sigma) for 1 week.
Epithelial-mesenchymal transition PCR array
The expression of 88 human Epithelial-mesenchymal transition (EMT) genes was profiled in DU145 cells using the EMT-RT2 Profiler PCR Arrays (SAAB Bioscience, Qiagen). Total RNA was isolated using an RNA Mini kit (Qiagen) and reverse transcribed using an RT-PCR kit (Qiagen). Relative expression was determined for each of the 88 genes using the formula 2KDCt.
Real-time PCR
Total RNA was obtained using an RNA Mini kit (Qiagen). RNA (0.5 mg) was reverse transcribed using a RT-PCR kit (Bio-Rad). Premixed primers for vimentin, fibronectin, ahnak, ITGB1, Nanog, Oct4 and GAPDH (as internal control) were from Applied Biosystems. Real-time PCR was performed using SYBR Green Supermix (Bio-Rad) according to the manufacturer’s instructions. RT-PCR was performed using an iCycler iQ5 PCR Detection System. The results are expressed as 2KDCtor fold increase.
Western blot
Tumour cells (5!105) were seeded in 6 cm plates in medium with 10% fetal bovine serum (FBS) (v/v) for 96 h, then lysed and analysed. Where indicated, cells were treated with PGE2(1 mmol/l), erlotinib (10 mmol/l), NS398 (10 mmol/l) or [2-(6-chloro-1H-phenanthro-(9,10-d) imidazol-2-yl)isophthalonitrile, MF63 (10 mmol/l). PGE2 and NS389 were from Sigma, erlotinib was from Santa Cruz and MF63 was from AbMole (Houston, TX, USA). To assess
En
docrine
-Rela
ted
translocation of b-catenin from cytosol to nucleus, cells were trypsinized and homogenized on ice in lysis buffer
containing 0.1 mmol/l EGTA, 0.1 mmol/l EDTA,
10 mmol/l Hepes, 10 mmol/l KCl, protease and phospha-tase inhibitors. After incubation on ice for 15 min, Nonidet-P-40 was added to cell lysates, which were then centrifuged (3900 g, 30 s). The supernatant contained the cytosolic fraction, while the pellet was solubilized in lysis buffer containing 1 mmol/l EGTA, 1 mmol/l EDTA, 20 mmol/l Hepes, 10 mmol/l NaCl, 1% protease and phosphatase inhibitors (v/v), followed by incubation on ice for 10 min and centrifuging (5480 g, 5 min). The supernatant contained the nuclear fraction. An equal amount of proteins was loaded on SDS–PAGE gel and transferred to a nitrocellulose membrane. Western blot was performed as described byDonnini et al. (2012). Sources of antibodies were: anti-vimentin and anti-fibronectin, Sigma; anhak, Abcam (Cambridge, UK); b-catenin, anti-a6 integrin and anti-b1 integrin, Santa Cruz; anti-P-Tyrosine, anti-EGFR, anti-caspase3 and anti-P-ERK1/2, Cell Signalling; anti-PGE2synthases, anti-COX synthases, anti-PGDH, anti-PGT and anti-EP receptors, Cayman Chemicals; anti-E-cadherin, DAKO (Milan, Italy). Images were digitalized with CHEMI DOC Quantity One software, blots were analysed in triplicate by densitometry using NIH Image 1.60B5 Software, and arbitrary densitometric units were normalized for b-actin (Sigma), tubulin (Santa Cruz) or H2A (Abcam, UK).
Tumour growth and lung metastasis in immunodeficient mice
Experiments were performed according to Italian and EEC guidelines for animal care and welfare (EEC Law No. 86/609). The experiments were approved by the Italian Ministry of Health (215/2011-B). To assess the contri-bution of mPGES-1 to the anti-tumour activity of erlotinib, immunodeficient mice (5-week-old male athy-mic athy-mice, Harlan, Indianapolis, IN, USA) were inoculated s.c. in the right flank with 20!106DU145 cells (mPGES-1SCor mPGES-1KD). When tumours reached a volume of 70–100 mm3, the animals were randomly assigned to treatment with erlotinib (50 mg/kg, three times a week by gavage). The first treatment is reported as day 1. Serial calliper measurements of perpendicular diameters were used to calculate tumour volume in mm3 with the formula: shortest diameter!longest diameter!thickness of tumour in millimeter. After treatment, animals were sacrificed and tumours were collected and split in two parts. One part was immediately frozen in liquid
nitrogen for western blot. The other part was embedded in Tissue-Tek O.C.T. (Sakura, Torrance, CA, USA) and frozen in liquid nitrogen for histology (Donnini et al. 2007). For histology, seeSupplementary Data, see section onsupplementary datagiven at the end of this article.
To assess the contribution of mPGES-1 to lung metastases, DU145 and PC-3 PCa cells (mPGES-1SC or mPGES-1KD) were suspended in PBS at a density of 20!106 cells/ml, and 250 ml of suspension was injected into the tail vein. To investigate whether EGFR inhibition affected the invasive activity of mPGES-1, cells were pre-treated with erlotinib (10 mmol/l) for 72 h before injection. After 7 weeks, immunodeficient mice were sacrificed, lungs removed and fixed in Bouin’s solution and the number of metastatic colonies counted.
MTT assay
Cell proliferation was quantified by Vybrant MTT cell proliferation assay as described (Donnini et al. 2007). Briefly, tumour cells (5!103) were seeded in 96-multiwell plates in medium with 10% serum for 24 h and then, where indicated, exposed to erlotinib (0.1–10 mmol/l) for 96 h in 10% FBS (v/v). Results are reported as 540 nm absorbance/well.
Adhesion
DU145 cells were maintained in 10% FBS (v/v) and then trypsinized; 5!104cells/ml in 1% FBS (v/v) medium were seeded in 96 multiwell plates coated with human fibronectin and incubated for 2 h at 37 8C. The wells were washed gently with PBS and adherent cells were fixed and stained with Diff-Quik. Adherent cells were counted by microscope in five random fields at 200!.
Tumour-endothelium adhesion
Tumour-endothelium adhesion was performed using the CytoSelect tumour-endothelium adhesion assay kit according to the manufacturer’s instructions (Cell Biolabs, San Diego, CA, USA). Briefly, HUVEC cells (10!105 cells/well in 48 multiwell plates) were maintained in 10% FBS (v/v) for 48 h. After monolayer formation, DU145 cells were harvested and 1!106 cells/ml were suspended in serum-free medium and incubated for 1 h in the presence of CytoTracker. Cells were washed twice and added to the endothelial cell monolayer. After 1 h cells were lysed and the fluorescence read at 480 nm/520 nm. Where indicated, endothelial cells were pre-treated for 4 h with TNFa to increase cell–cell adhesion (Sheski et al. 1999).
En
docrine
-Rela
ted
Transendothelial migration
HUVEC cells (8!105cells/well in the filter of a 48-well transwell plate) were maintained in 10% FBS (v/v) for 48 h. After monolayer formation, DU145 cells were harvested and 1!106cells/ml were suspended in serum-free medium and incubated for 1 h in the presence of CytoTracker. Cells were washed twice with serum-free medium and 2!105 cells were added to the upper side of the transwell plate. After 2 h the medium in the lower side of the plate was collected and centrifuged. Migrant tumour cells were lysed and fluorescence measured at 480 nm/520 nm.
Cell viability assay
Tumour cells at a density of 5!105 cells/ml were incubated for 24 or 48 h in medium with 0.1% FBS (v/v). After incubation, the numbers of dead cells stained with trypan blue and total cells were evaluated by optical microscope. The number of dead cells was reported as a percentage of total cells.
Flow cytometry
Tumour cells were harvested and 3.5!104 cells were incubated in ice for 30 min with primary antibody, then washed in PBS and exposed to secondary antibody for an additional 30 min. Surface CD44 and CD24 (Abcam) were quantified by flow cytometry using unlabelled monoclonal or polyclonal Ab followed by fluorescein isothiocyanate (FITC) or tetramethylrhodamine (TRIC)-labelled second-ary antibodies. Cells were analysed by flow cytometry using a FACScan flow cytometer (Becton-Dickinson, Franklin Lakes, NJ, USA). Data was acquired by CellQuest and plotted using FlowJo (Tree Star, Ashland, OR, USA).
Clonogenic assay
Tumour cells were plated in 60 mm culture dishes (1000 cells per dish) in medium containing 10% FBS. After 24 h cells were treated with erlotinib or MF63 (1–10 mmol/l) in 10% FBS (v/v) and kept in a humidified incubator for 10 days. Colonies (O50 cells) were fixed and stained with 0.05% crystal violet (w/v) (Sigma) in 10% ethanol (v/v), counted and photographed.
Statistical analysis
Results were expressed as meansGS.E.M., analysed by Student’s t-test and/or one-way ANOVA with Bonferroni’s
correction. A value of P!0.05 was considered to denote statistical significance.
Results
mPGES-1 promotes the mesenchymal and stem cell-like phenotype in PCa cells
We investigated the correlation of mPGES-1 expression (immunohistochemistry) with staging and grading in a series of PCa cases. Overall, mPGES-1 expression was detected in 12/25 (48%) organ-confined PCa and in 21/27 (77.7%) advanced PCa (Fig. 1A). In human advanced PCa samples, both mPGES-1 and EGFR were co-expressed in a high percentage of cases (nZ19/27, 70.3%;Fig. 1A). In the same group, a6-integrin, a stem cell marker (Marthick & Dickinson 2012,Hoogland et al. 2014), was negative or weakly stained (nZ19/27;Fig. 1B). By contrast, only 7/25 (28%) of organ-confined tumours showed co-expression of mPGES-1 and EGFR (Fig. 1A, 70.3% vs 28%, see also panel a and b from an organ confined PCa sample vs c and d from an advanced PCa sample).
In DU145 cell line isolated from a castration-resistant human brain metastasis of PCa, characterized by mPGES-1 expression (mPGES-1SC) (Hanaka et al. 2009), the knock down for mPGES-1 (stable or transient mPGES-1KD) did not affect PGE2 receptor expression (EP1-4), while it obliterated PGE2output (O90%, P!0.001 vs mPGES-1SC) (A and B, and Supplementary Figure 1, see section on supplementary datagiven at the end of this article). The large PGE2 loss occurred despite a slight increase in cyclooxygenase-2 (COX-2) expression, while other enzymes involved in PGE2 metabolism were either unchanged (e.g. COX-1), or only negligibly changed (e.g. the cytosolic isoform, cPGES, the microsomal type 2 isoform, mPGES-2, the prostaglandin transporter, PGT and the enzyme implicated in PGE2 degradation,
15-hydroxyprostaglandin dehydrogenase (PGDH))
(Fig. 2A). Compared to DU145 WT, transfection of cells with the empty vector (mPGES-1SC) did not affect the PGE
2 signalling cascade (Fig. 2A). Similar results were obtained in experiments of transiently silenced mPGES-1 cells (Supplementary Figure 2A).
Because PGE2 regulates genes involved in EMT in tumour cell lines (Dohadwala et al. 2006), we assessed whether constitutively high mPGES-1 expression in DU145 affected their mesenchymal-cell-like phenotype with respect to mPGES-1KDcells. The results showed that w1/4 of EMT-related genes (nZ22/88) were influenced by high expression of intrinsic mPGES-1 (Fig. 2B). Notable
En
docrine
-Rela
ted
changes occurred in transcription factors known to induce EMT, such as Snail, Slug (SNAI2 gene) and ZEB, and in several genes coding for cytoskeletal proteins, such as E-cadherin, vimentin, fibronectin and ahnak. Western blot and immunofluorescence analysis illustrated the marked loss of vimentin, fibronectin and ahnak and the increased expression of E-cadherin in stably and transi-ently silenced mPGES-1KD cells (C and D). Reduced expression of vimentin, fibronectin and ahnak was also detected by quantitative RT-PCR (Table 1). Treatment of mPGES-1KDcells with PGE2(1 mmol/l, 24 h) reversed both vimentin and fibronectin expression, confirming the involvement of PGE2 in this process (Fig. 2E). In line with the role of PGE2in cancer cell growth and E-cadherin expression (Castellone et al. 2005,Lu et al. 2012), we found massive translocation of b-catenin into the nucleus of
DU145 mPGES-1SCcells, while it remained localized in the cytoplasm of mPGES-1KDcells (Fig. 2E and F).
We also observed a prevalence of stem-cell-like markers, regarded as indicators of tumour invasiveness, in DU145 mPGES-1SCcompared to mPGES-1KDcells. This was indicated by the large increase in the CD44C/CD24Kratio, the decrease in a6-integrin and the increase in b1 integrin, as well as transcription factors Nanog and Oct4 in mPGES-1SC (Fig. 3A, B and C), all pluripotency maintaining factors overexpressed in PCa stem cells (Klarmann et al. 2009, Rentala et al. 2010, Marthick &
Dickinson 2012, Nanta et al. 2013, Hoogland et al.
2014).Similar results were obtained for the PC-3 cell line. PC-3 cells expressed constitutive mPGES-1, and knocking down the enzyme significantlyreduced PGE2 output (O60%, P!0.01 vs mPGES-1SC), promoted epithelial
mPGES-1 EGFR A PCa No of patients (%) mPGES-1+/ EGFR+ mPGES-1–/ EGFR+ mPGES-1+/ EGFR– mPGES-1–/ EGFR– Organ-confined 7 (28%) 4 (16%) 5 (20%) 9 (36%) Advanced 19 (70.3%) 3 (11.1%) 2 (7.4%) 3 (11.1%) mPGES-1 EGFR a b c d B mPGES-1 α6-integrin Figure 1
Immunohistochemical expression of mPGES-1, EGFR and a6-integrin in prostate cancer. (A) Representative images of mPGES-1 and EGFR expression in organ-confined (a and b) or advanced (c and d) prostate
cancer. (B) Representative images of mPGES-1 and a6-integrin expression in advanced prostate cancer.
En
docrine
-Rela
ted
phenotype, decreased cell clonogenicity and reduced the expression of stem cell markers (Supplementary Figure 3A, B, C, D, E and F, see section onsupplementary datagiven at the end of this article). We also recorded anchorage-independent cell viability in mPGES-1SCcells, in contrast to the drastic decline seen in mPGES-1KDcells, associated with caspase-3 activation (Fig. 3D and E, and Supplemen-tary Figure 3G and H). Adhesion studies with fibronectin coated-wells or endothelial cells revealed that mPGES-1SC cells rapidly adhered (2 h) to the matrix or endothelium (whether or not it had been activated by TNFa to favour cell–cell interaction and transmigration), whereas mPGES-1KDcells displayed a significantly delayed adhesion (F and G). Since knock down of mPGES-1 in cells does not affect cell survival in vitro, as measured by MTT assay (Abs 0.95G 0.08 and 0.88G0.11 for DU145 mPGES-1SCand mPGES-1KD
cells; Abs 0.74G0.06 and 0.79G0.09 for PC-3 mPGES-1SC and mPGES-1KD cells respectively), or cell apoptosis in suspension up to 24–48 h, we conclude that the inhibition of adhesion in mPGES-1KD cells depends on the modi-fication of cytoskeletal organization, for example of vimentin and fibronectin. Finally, by measuring trans-endothelial migration, we showed a far greater ability (nearly threefold) of mPGES-1SCthan mPGES-1KDcells to cross cell layers (Fig. 3H), indicating the involvement of mPGES-1/PGE2signalling in prostate tumour invasiveness.
Inhibition of mPGES-1 activity suppresses stem-like phenotype
Further evidence that the mPGES-1-PGE2 cascade enhances PCa cell aggressiveness was obtained by
WT mPGES-1SC cPGES-1 mPGES-1 COX-1 COX-2 mPGES-2 PGDH PGT Actin A *** B 0 50 100 150 200 250 300 350 400 PGE 2 le v els (pg/ml) C Vimentin Actin Fibronectin Ahnak E-cadherin ADU E-cadherin Vimentin Fibronectin Anahk 2.0 1.5 1.0 0.5 0.0 WT ** * * *** D E 0 24 h Vimentin Actin PGE2 Fibronectin β-catenin
Cyt Nuc Cyt Nuc Tubulin H2A F mPGES-1KD WT mPGES-1SCmPGES-1KD WT mPGES-1SCmPGES-1KD mPGES-1SC mPGES-1KD mPGES-1SC mPGES-1KD Figure 2
mPGES-1 promotes EMT in DU145 cells. (A) Expression of enzymes involved in arachidonic acid cascade in DU145 WT, mPGES-1SCand mPGES-1KDcell
lines in basal condition (10% FCS) measured by western blot. (B) EIA analysis of PGE2production measured in medium conditioned by DU145
cells. Results (three experiments run in duplicate) are expressed as pg/ml of PGE2. ***P!0.001 vs mPGES-1SC-. (C and D) Representative images and
quantification of western blot analysis of E-cadherin, vimentin, fibronectin and ahnak expression in DU145 cells. *P!0.05, **P!0.01 and ***P!0.001 vs DU145 mPGES-1SC(E) Western blot analysis of fibronectin and vimentin
in mPGES-1KDcells treated with PGE
2(1 mmol/l, 24 h). (F) Western blot
analysis of b-catenin localization in DU145 mPGES-1SCand mPGES-1KDcells.
Nuc, nucleus; Cyt, cytoplasm.
En
docrine
-Rela
ted
inhibiting mPGES-1 activity with the selective inhibitor MF63 (Xu et al. 2008). MF63 (10 mmol/l, 24–48 h) significantly inhibited PGE2production and reversed the mesenchymal phenotype in DU145 and PC-3 cells, promoting E-cadherin and inhibiting vimentin expression (Fig. 4A, B and C). MF63 also upregulated a6-integrin and significantly reduced cell clonogenicity (Fig. 4D and E).
To complement the above findings, we also trans-fected mPGES-1 in LNCaP PCa cells, isolated from a castration-resistant human lymph node metastases lack-ing constitutive mPGES-1 (Supplementary Figure 4A, see section on supplementary data given at the end of this article). As expected, forced expression of mPGES-1 in LNCaP cells promoted an increase in PGE2production, cell growth and development of the mesenchymal phenotype as documented by E-cadherin decrease (Supplementary Figure 4B, C, D and E).
mPGES-1 induces growth and lung metastasis formation In light of the observed link between mPGES-1/PGE2 signalling, EMT and stemness markers in PCa cells, we
investigated whether the presence of mPGES-1 in DU145 and PC-3 cells influenced their growth and metastatic invasion in vivo.
In tumours induced by inoculating nude mice with mPGES-1SCor mPGES-1KDcells, the volume measurements (here reported at days 12 and 21) showed significant differences, growth being 2.3-fold higher in DU145 mPGES-1SCthan mPGES-1KDtumours, and 4.9-fold higher in PC-3 mPGES-1SC than mPGES-1KD tumours (Fig. 5A). Consistently, Ki-67 showed denser immunostaining in mPGES-1SCthan mPGES-1KDtumours (Fig. 5B). Accordingly, the Ki67 score was 45G2.9% and 57G3.8% for DU145 and PC-3 mPGES-1SCrespectively and 21G1.9% and 29G1.8% for DU145 and PC-3 mPGES-1KDrespectively, indicating a higher proliferation rate in cells overexpressing mPGES-1.
Western blot (Fig. 5C) and immunohistochemistry of tumours (Fig. 5D) revealed abundant mPGES-1 and vimentin expression in mPGES-1SC, contrasting with the absence of these two proteins in mPGES-1KDtumours.
We also investigated the contribution of mPGES-1 expression to PCa metastasis by injecting DU145 and PC-3 cells (mPGES-1SCand mPGES-1KDcells for both cell lines) A 0 2 4 6 8 10 12 CD44/CD24 e xpression CD44 CD24 * * mPGES-1SC mPGES-1KD α6-integrin Actin β1-integrin Actin mPGES-1SC mPGES-1KD B 0.5 1.5
mPGES-1SC mPGES-1KD mPGES-1SC mPGES-1KD
ADU α6-integrin β1-integrin 1.0 0.0 ** ** C 1.2 1.0 0.8 0.6 0.4 0.2 0.0 Nanog Oct4 Gene e xpression (f old increase) mPGES-1SC mPGES-1KD mPGES-1SC mPGES-1KD mPGES-1SC mPGES-1KD ** ** D ** *** 0 10 20 30 40 50
Apoptosis % of death cells
24 h 48 h Caspase 3 0 24 48 0 24 48h Cleaved caspase 3 Actin mPGES-1SCmPGES-1KD E ** ### ** ** 0.5 TNFα Adhesion relativ e to untreated mPGES-1 SC cells F 0.5 1.5 Cont PGE2 Adhesion relativ e to untreated mPGES-1 SC cells Cont G 0 2000 4000 6000 8000 10 000 T ransendothelial mig ration RFU ** H 2.0 1.0 0.0 mPGES-1SCmPGES-1KD 1.0 1.5 0.0 Figure 3
EGFR activation mediates mPGES-1/PGE2-dependent EMT of DU145 cells.
(A) FACS analysis for CD24 and CD44 expression in DU145 mPGES-1SC-and
mPGES-1KDcells, and (B) western blot analysis and quantification of a6 and
b1-integrin expression in mPGES-1SCand mPGES-1KDcells. Data are
representative of three different experiments and quantification was performed by Image J. *P!0.01 vs DU145 mPGES-1SC(C) RT-PCR analysis of
Nanog and Oct4 expression in mPGES-1SCand mPGES-1KDDU145 cells.
Data are reported as fold increase vs mPGES-1SCcells. **P!0.01 vs DU145
mPGES-1SC. (D) Cell viability of DU145 mPGES-1SCand mPGES-1KDin
suspension in 0.1% of serum. Results are expressed as % of dead cells. **P!0.01 and ***P!0.001 vs DU145 mPGES-1SC. (E) Western blot analysis
of caspase 3 activation in DU145 cells grown in suspension for the indicated time. (F) Adhesion of DU145 mPGES-1SCand mPGES-1KDuntreated or
pretreated with PGE2(1 mmol/l, 96 h) on fibronectin coated-96 well plate.
Cell adhesion was evaluated after 2 h of incubation in 1% serum. Results (three experiments in triplicate) are expressed as % of adherent cells relative to untreated mPGES-1SC. **P!0.01 vs mPGES-1SC;###P!0.01 vs
mPGES-1KD. (G) CytoTracker labeled DU145 mPGES-1SCor mPGES-1KDcells
were allowed to attach to untreated or TNFa-pre-treated HUVEC monolayers in 48 well plates for 1 h. Adherent cells were lysed and quantified. Results (three experiments in duplicate) are expressed as fold increase to the adhesion of mPGES-1SCon untreated HUVEC. **P!0.01 vs
mPGES-1SC. (H) Migration of DU145 mPGES-1SCand mPGES-1KDtoward
HUVEC monolayer. CytoTracker labeled tumor cells were seeded in the upper side of 48 well-transwell and migration was evaluated after 2 h by measuring the fluorescence in the lower side of the well. Data are reported as relative fluorescence unit of three experiments run in duplicate. **P!0.01 vs DU145 mPGES-1SC. En docrine -Rela ted Cancer
in the tail vein of nude mice. In mice injected with DU145 or PC-3 mPGES-1SC, the number of lung colonies was 18G2 and 20G3.8, respectively. In contrast, knock down of mPGES-1 significantly reduced the numbers of colonies (10G1.9 and 3.3G2.8 respectively,Fig. 5E).
These results demonstrate that mPGES-1/PGE2 signal-ling plays a significant role in prostate tumour growth and metastasis development.
mPGES-1 induces EGFR expression in prostate tumours and mediates EGFR-dependent tumour growth
It is well documented that PGE2favours EGF/EGFR-induced oncogenicity by directly phosphorylating EGFR (Buchanan et al. 2003,Donnini et al. 2007). However, it is unknown whether mPGES-1/PGE2 signalling modulates EGFR expression levels.We measured EGFR expression in DU145 mPGES-1SC and mPGES-1KD cells, in tumours from mice inoculated with the respective cell lines and in DU145 and PC-3 treated with MF63. We found distinctly higher EGFR expression levels in the mPGES-1SCgroup than in the mPGES-1KD group (A, B and C and Supplementary Figure 2B). Consistently, p-ERK1/2, a known downstream effector of EGFR signalling, was higher in mPGES-1SCthan mPGES-1KD tumours (Fig. 6D), suggesting that EGFR signalling plays a role in mPGES-1 enhancement of tumour growth.
Moreover, treatment of DU145 and PC-3 mPGES-1SC cells with mPGES-1 inhibitor MF63 (10 mmol/l) and DU145 mPGES1SC cells with COX-2 inhibitor NS398 (10 mmol/l, 96 h) inhibited EGFR expression (Fig. 6E and F), while exogenous PGE2(1 mmol/l, 96 h) increased EGFR
protein levels in DU145 mPGES-1KD cells, supporting involvement of PGE2in promoting EGFR over-expression in prostate tumours.
Further evidence of involvement of mPGES-1/PGE2 signalling in EGFR expression was obtained in exper-iments in vitro and in vivo using erlotinib, a known inhibitor of EGFR. In vitro, erlotinib administration to DU145 cells (10 mmol/l) abrogated EGFR phosphorylation and downregulated vimentin expression (Fig. 6G). Phos-phorylation of EGFR was independent of EGF expression, which was affected in mPGES-1KDcells but not in mPGES-1SC(Supplementary Figure 5, see section on supplemen-tary data given at the end of this article). Erlotinib also reduced cell viability in DU145 mPGES-1KD cells and functionally halved the number of cell colonies (number of colonies: mPGES-1SCZ58G4 vs mPGES-1KDZ27G5) (Fig. 6H, I, J, K and L). In vivo, erlotinib decreased tumour growth in DU145 mPGES-1SC and mPGES-1KD-bearing mice with respect to the vehicle-treated group (area under curve: mPGES-1SCCerlotinibZ12360 vs mPGES-1KDC erlotinibZ5664, Fig. 6M). Erlotinib treatment was more effective in reducing tumour volume when mPGES-1 was knocked down (Fig. 6I), but it did not affect the number of metastases for DU145 and PC-3 cell lines (number of metastases: mPGES-1SCZ20G4.8 and mPGES-1KDZ7.5G 3.5 for DU145; mPGES-1SCZ17. 7G4.2 and mPGES-1KDZ 5.3G3.4 for PC-3).
All together, this data provides clear evidence of the role played by the mPGES-1/PGE2pathway in inducing a mesenchymal phenotype and stemness in PCa cells, thus reinforcing EGFR tumorigenic drive.
A B C E-cadherin Vimentin Actin DU145 PC-3 E-cadherin Vimentin Actin ** ** 0 50 100 150 200 250 300 350 400 450 500 Basal MF63 PGE 2 le v els (pg/ml) DU145 PC-3 D E Actin α 6-integrin DU145 PC-3 0 24 48 h 0 24 48 h (MF63) (MF63) 0 48 h 0 24 h (MF63) (MF63) Actin α 6-integrin 0 50 100 150 200 250 300 350 0 0.1 1 10 No . of colon y/w ell DU145 PC-3 ** # ### MF63 Figure 4
Pharmacological inhibition of mPGES-1 controls EMT markers, a6-integrin and EGFR expression, and reduces prostate cancer cells growth. (A). EIA analysis of PGE2production measured in medium conditioned by DU145 or
PC-3 cells after 48 h of treatment with MF63 (10 mmol/l). Results (three experiments run in duplicate) are expressed as pg/ml of PGE2. **P!0.01 vs
basal. (B, C and D) Western blot analysis of E-cadherin, vimentin and
a6-integrin expression after MF63 treatment (10 mmol/l). (E). Quantification of DU145 and PC-3 colonies in the presence or absence of MF-63 10 mmol/l. Data are reported as the number of colonies of three experiments in triplicate. *P!0.05 and **P!0.01 vs basal PC-3;#P!0.05 and###P!0.001 vs
basal DU145. En docrine -Rela ted Cancer
Discussion
The present study shows that by eliciting mesenchymal and stem-cell-like traits and EGFR expression, the tumour
intrinsic inflammatory mPGES-1/PGE2 pathway
cooperates with the EGFR oncogene to promote an aggressive PCa phenotype.
As an experimental paradigm we used DU145 and PC-3 cells in which mPGES-1 was stably or transiently knocked down by mRNA silencing (mPGES-1KD), compar-ing them with prostate cells containcompar-ing a negative control non-targeting shRNA plasmid (mPGES-1SC). Further, evidence of the specificity of mPGES-1/PGE2signalling in PCa aggressiveness was obtained by pharmacological inhibition of the enzyme with the selective MF63 inhibitor (Xu et al. 2008).
Inflammation plays a role in the development and progression of many cancers, including PCa, and multiple pro-inflammatory molecules are associated with PCa recurrence (Ørsted & Bojesen 2013). Here we investigated the contribution of the mPGES-1/PGE2pathway to EMT, a process that promotes acquisition of mesenchymal traits, such as enhanced growth and migratory capacity, inva-siveness and resistance to apoptosis, by epithelial cells. We observed that mPGES-1 knockdown influenced a set of genes promoting EMT in tumour cells, such as genes coding for transcriptional activity (Snail, Slug and ZEB), which were significantly downregulated. The effect on the cytoskeletal protein vimentin, which became undetect-able in mPGES-1KDand in cells treated with MF63, was particularly striking. A number of other changes occurred
A B ** * 0 500 1000 1500 2000 2500 3000 12 21 T umor v olume (mm 3)
Days from injection
mPGES-1SC mPGES-1KD mPGES-1SC mPGES-1KD
0 500 1000 1500 2000 12 21 T umor v olume (mm 3)
Days from injection ** * DU145 PC-3 DU145 PC-3 50 μM Actin Vimentin C D mPGES-1 mPGES-1SC mPGES-1KD mPGES-1SC mPGES-1KD mPGES-1SC mPGES-1KD DU145 PC-3 1 2 3 1 2 3 1 2 3 1 2 3 Actin Vimentin mPGES-1 mPGES-1SCmPGES-1KD DU145 PC-3 100 μM 100 μM 0 5 10 15 20 25 mPGES-1SC mPGES-1KD
Number of superficial lung metastasis
DU145 PC-3 E ## * mPGES-1SC mPGES-1KD Figure 5
mPGES-1 expression controls in vivo tumor growth, vimentin and EGFR expression. (A). Tumor volume measured in athymic mice inoculated with DU145 and PC-3 mPGES-1SCor mPGES-1KDcells after 12 or 21 days. *P!0.05
and **P!0.01 vs mPGES-1SC. (B) Immunohistochemical analysis of Ki67
expression in tumor specimens derived from mPGES-1SCor mPGES-1KD. Data
are representative of five tumor specimens for both tumor cell types.
(C and D) Western blot and immunohistochemical analysis of vimentin expression in xenograft tumor tissues. Data are representative of five tumor specimens for both tumor cell types. (E). Quantification and images of lung metastasis after injection in mice tail vein of DU145 or PC-3 mPGES-1SCor
mPGES-1KDcells. Images: grey frame: DU145; black frame: PC-3. *P!0.05
and##P!0.01 vs mPGES-1SC En docrine -Rela ted Cancer
in mPGES-1KD cells. They included downregulation of insulin growth factor binding protein-4 (IGFBP-4) and the integrin b1 (ITGB1) gene, re-localization of b-catenin and overexpression of E-cadherin. All these markers are known to be associated with PCa aggressiveness (Damon et al.
1998, Miyake et al. 2000, Mohan & Baylink 2002,
Bijnsdorp et al. 2013, Carbonell et al. 2013).
Regulation of these markers may therefore be causally
related to the loss of function parameters observed in mPGES-1KDcells.
mPGES-1 expression in PCa cells was clearly associated with stem-like features as demonstrated by the greater survival ability of mPGES-1SC cells in suspension compared to mPGES-1KD cells. Additional evidence of mPGES-1-linked stemness was a significant shift in the CD44/CD24 ratio, decreased b1-integrin, increased
EGFR Actin A ** ## B ADU (EGFR/Actin) 1.6 1.4 1.2 1.0 0.8 0.6 0.4 0.2 0.0
mPGES-1SC mPGES-1KDmPGES-1KD +PGE 2 mPGES-1SC mPGES-1KD 50 μM 50 μM P-ERK 1/2 Actin 1 2 3 1 2 3 1 2 3 1 2 3 mPGES-1SC mPGES-1KD D EGFR Actin C mPGES-1SC mPGES-1KD DU145 DU145 E EGFR Actin DU145 PC-3 EGFR Actin 0 24 72 h 0 24 72 h EGFR Actin PGE2 – – – + NS398 – + – – mPGES-1SC mPGES-1KD DU145 MF63 F ** ** * H 0 20 40 60 80 100 0 0.01 0.1 1 10 MTT Assa y % dead cells Erlotinib (μmol/l) mPGES-1SC mPGES-1KD Vimentin Actin P-Tyr EGFR G Erlotinib Ctr I 0 20 40 60 80 100 120 0 1 10 Δ colonies induced b y er lotinb o v er the control (%) Erlotinib (μmol/l) ** ** * J mPGES-1SC mPGES-1KD mPGES-1SC mPGES-1KD 100 μM 100 μM # *** ** ** ** 0 500 1000 1500 2000 2500 3000 3500 1 3 5 8 10 12 15 17 19 T umor v o lume (mm 3)
Days from injection
mPGES-1SC mPGES-1SC+erlotinib mPGES-1KD mPGES-1KD+erlotinib K Figure 6
mPGES-1 expression in cells mediates prostate tumor responsiveness to erlotinib. (A) Western blot analysis of the EGFR expression in DU145 mPGES-1SCand mPGES-1KDcells in basal condition or treated for 96 h with
1 mmol/l PGE2. Graph: quantification of EGFR expression. Data (three
experiments) represent the ratio between EGFR and actin. **P!0.01 vs mPGES1SC and##P!0.01 vs mPGES-1KD. (B) Immunofluorescence analysis of
EGFR expression in mPGES-1SCand mPGES-1KDcells. (C and D) EGFR
expression and ERK 1/2 phosphorylation in tumor specimens derived from DU145 mPGES-1SCand mPGES-1KD. (E and F) Western blot analysis of EGFR
expression in DU145 and PC-3 mPGES-1SCtreated with MF63 (10 mmol/l,
24–72 h), in DU145 mPGES-1SCtreated with NS398 (10 mmol/l, 96 h) and in
DU145 mPGES-1KDtreated with PGE2 (1 mmol/l, 96 h). Representative gels
of three experiments. (G) Western blot analysis of EGFR phosphorylation
and vimentin expression in DU145 mPGES-1SCcells treated with erlotinib
(10 mmol/l, 96 h). Data are representative of three experiments. (H) MTT assay of DU145 mPGES-1SCand mPGES-1KDcells treated with erlotinib
(0.01–10 mmol/l, 96 h). Data (three experiments in triplicate) are reported as cell death (%). (I) Representative colonies of DU145 mPGES-1SCand
mPGES-1KDcells. (J) Quantification of DU145 mPGES-1SCand mPGES-1KDcolonies in
the presence or absence of erlotinib 1 and 10 mmol/l. Data are reported as D of mPGES-1SCand mPGES-1KDcell colonies in the presence of erlotinib over the control (%) and are the means of three experiments in duplicate. *P!0.05 vs mPGES-1SC; **P!0.01 vs mPGES-1KD. (K) Tumor volume
measured in athymic mice inoculated with DU145 mPGES-1SCor mPGES-1KD
cells and treated with erlotinib (400 mg/mouse per three times per week, ip.).#P!0.05, **P!0.01 and ***P!0.001 vs DU145 mPGES-1SC.
En
docrine
-Rela
ted
a6-integrin expression and increased transcription factors Nanog and Oct4 (Nanta et al. 2013). Collectively, these results provide evidence of involvement of mPGES-1/PGE2 in promoting EMT and stemness in mPGES-1SC tumour cells, since its ablation and inhibition impairs their inherent potential to survive in suspension and to transmigrate to endothelial cells.
EGFR studies provided another means to examine the interplay between PGE2 input and oncogenic drive mediated by the EGFR system. The picture emerging is one of reciprocal activation producing vigorous PCa progression when both components (PGE2 and EGF) of this circuit are maximally expressed, as in mPGES-1SC cells, and conversely, a reduced outcome in mPGES-1KD and in mPGES-1-inhibited cells, in which both com-ponents are downregulated. This circuit appears to be operant in the clinical setting here reported, as in human prostate tumours mPGES-1 and EGFR are concomitantly expressed in specimens with a high Gleason score compared to specimens of organ-confined lesions with a low Gleason score. Thus, mPGES-1/PGE2 signalling empowers tumour cells to disseminate and seed meta-stases by activating EMT and stemness in PCa.
The present findings illustrate the role of mPGES-1 signalling in influencing EGFR-mediated oncogenicity and in contributing, in association with the EGFR path-way, to aggressiveness in PCa. Indeed, erlotinib treatment reduced tumour development in the mPGES-1SCgroup to approximately the same level as that observed in mPGES-1KD tumours. Further, ablation of PGE2 production significantly reduced lung metastasis in mice, indicating that mPGES-1 signalling plays a key role in EMT and stemness of PCa cells (Oskarsson et al. 2014). The combination of mPGES-1 knockdown or pharmacological inhibition of mPGES-1 by MF63 with erlotinib results in a more effective strategy to inhibit PCa cell growth. Ability to undergo EMT and acquire stem-cell-like features enables tumours to expand, spread and resist chemother-apy/target therapy (Clevers 2011, Hoggatt et al. 2013). PGE2 release in the tumour microenvironment was recently shown to be responsible for tumour initiation and repopulation, hence inhibitors of PGE2 production interfere with tumour progression and chemoresistance
(Kurtova et al. 2015). Our study demonstrates that
mPGES-1 ablation or inhibition in human PCa cells suppresses their overall oncogenic drive and reduces their stemness and invasiveness. We conclude that the mPGES-1 gene may be considered a signature gene for identifying a subtype of rapidly progressing prostate tumours, which, in the case of overexpression of EGFR,
may benefit from combined treatment with inhibitors of EGFR, tyrosine kinase and PGE2.
Supplementary data
This is linked to the online version of the paper athttp://dx.doi.org/10.1530/
ERC-15-0277.
Declaration of interest
The authors declare that there is no conflict of interest that could be perceived as prejudicing the impartiality of the research reported.
Funding
The project was funded by Associazione Italiana Ricerca sul Cancro (AIRC) IG: 10731 and Istituto Toscano Tumori Grant Proposal 2010. F Finetti was a SIF (Societa` Italiana di Farmacologia)-Takeda 2013 fellow, and E Terzuoli was a FIRC (Fondazione Italiana per la Ricerca sul Cancro) fellow.
References
Arteaga CL 2002 Epidermal growth factor receptor dependence in human tumors: more than just expression? Oncologist 7 (Suppl 4) 31–39.
(doi:10.1634/theoncologist.7-suppl_4-31)
Augello MA, Den RB & Knudsen KE 2014 AR function in promoting metastatic prostate cancer. Cancer Metastasis Reviews 15 399–411.
(doi:10.1007/s10555-013-9471-3)
Bijnsdorp IV, Geldof AA, Lavaei M, Piersma SR, van Moorselaar RJ & Jimenez CR 2013 Exosomal ITGA3 interferes with non-cancerous prostate cell functions and is increased in urine exosomes of metastatic prostate cancer patients. Journal of Extracellular Vesicles 2 article 22097.
(doi:10.3402/jev.v2i0.22097)
Buchanan FG, Wang D, Bargiacchi F & DuBois RN 2003 Prostaglandin E2 regulates cell migration via the intracellular activation of the epidermal growth factor receptor. Journal of Biological Chemistry 278 35451–35457.
(doi:10.1074/jbc.M302474200)
Canil CM, Moore MJ, Winquist E, Baetz T, Pollak M, Chi KN, Berry S, Ernst DS, Douglas L, Brundage M et al. 2005 Randomized phase II study of two doses of gefitinib in hormonerefractory prostate cancer: a trial of the National Cancer Institute of Canada-Clinical Trials Group. Journal of Clinical Oncology 23 455–460. (doi:10.1200/JCO.2005.
02.129)
Carbonell WS, DeLay M, Jahangiri A, Park CC & Aghi MK 2013 b1 integrin targeting potentiates antiangiogenic therapy and inhibits the growth of bevacizumab-resistant glioblastoma. Cancer Research 73 3145–3154.
(doi:10.1158/0008-5472.CAN-13-0011)
Castellone MD, Teramoto H, Williams BO, Druey KM & Gutkind JS 2005 Prostaglandin E2 promotes colon cancer cell growth through a Gs-axin-b-catenin signaling axis. Science 310 1504–1510. (doi:10.1126/science.
1116221)
Cathomas R, Rothermundt C, Klingbiel D, Bubendorf L, Jaggi R, Betticher DC, Brauchli P, Cotting D, Droege C, interhalder R et al. 2012 Efficacy of cetuximab in metastatic castration-resistant prostate cancer might depend on EGFR and PTEN expression: results from a phase II trial (SAKK 08/07). Clinical Cancer Research 18 6049–6057. (doi:10.1158/
1078-0432.CCR-12-2219)
Clevers H 2011 The cabcer stem cell: premises, promises and challenges. Nature Medicine 17 313–319. (doi:10.1038/nm.2304)
En
docrine
-Rela
ted
Coussens LM, Zitvogel L & Palucka AK 2013 Neutralizing tumor-promoting chronic inflammation: a magic bullet? Science 339 286–291.
(doi:10.1126/science.1232227)
Damon SE, Maddison L, Ware JL & Plymate SR 1998 Overexpression of an inhibitory insulin-like growth factor binding protein (IGFBP), IGFBP-4, delays onset of prostate tumor formation. Endocrinology 139 3456–3464.
Dohadwala M, Yang SC, Luo J, Sharma S, Batra RK, Huang M, Lin Y, Goodglick L, Krysan K, Fishbein MC et al. 2006 Cyclooxygenase-2-dependent regulation of E-cadherin: prostaglandin E(2)
induces transcriptional repressors ZEB1 and snail in non-small cell lung cancer. Cancer Research 66 5338–5345. (
doi:10.1158/0008-5472.CAN-05-3635)
Donnini S, Finetti F, Solito R, Terzuoli E, Sacchetti A, Morbidelli L, Patrignani P & Ziche M 2007 EP2 prostanoid receptor promotes squamous cell carcinoma growth through epidermal growth factor receptor transactivation and iNOS and ERK1/2 pathways. FASEB Journal 21 2418–2430. (doi:10.1096/fj.06-7581com)
Donnini S, Finetti F, Terzuoli E, Giachetti A, In˜iguez MA, Hanaka H, Fresno M, Ra˚dmark O & Ziche M 2012 EGFR signaling upregulates expression of microsomal prostaglandin E synthase-1 in cancer cells leading to enhanced tumorigenicity. Oncogene 31 3457–3466. (doi:10.1038/onc.
2011.503)
Edge S, Byrd DR, Compton CC, Fritz AG, Greene FL, Trotti A 2010 AJCC Cancer Staging Manual, 7th edn, pp 457–468. New York, NY: Springer–Verlag.
Epstein JI, Allsbrook WC Jr, Amin MB & Egevad LL 2005 ISUP Grading Committee. The 2005 International Society of Urological Pathology (ISUP) Consensus Conference on Gleason Grading of Prostatic Carcinoma. American Journal of Surgical Pathology 29 1228–1242.
(doi:10.1097/01.pas.0000173646.99337.b1)
Gravis G, Bladou F, Salem N, Gonc¸alves A, Esterni B, Walz J, Bagattini S, Marcy M, Brunelle S & Viens P 2008 Results from a monocentric phase II trial of erlotinib in patients with metastatic prostate cancer. Annals of Oncology 19 1624–1628. (doi:10.1093/
annonc/mdn174)
Hammarsten P, Rudolfsson SH, Henriksson R, Wikstro¨m P & Bergh A 2007 Inhibition of the epidermal growth factor receptor enhances castration-induced prostate involution and reduces testosterone-stimulated prostate growth in adult rats. Prostate 67 573–581. (doi:10.1002/pros.
20529)
Hanahan D & Weinberg RA 2011 Hallmarks of cancer: the next generation. Cell 144 646–674. (doi:10.1016/j.cell.2011.02.013)
Hanaka H, Pawelzik SC, Johnsen JI, Rakonjac M, Terawaki K, Rasmuson A, Sveinbjo¨rnsson B, Schumacher MC, Hamberg M, Samuelsson B et al. 2009 Microsomal prostaglandin E synthase 1 determines tumor growth in vivo of prostate and lung cancer cells. PNAS 106 18757–18762.
(doi:10.1073/pnas.0910218106)
Hoggatt J, Mohammad KS, Singh P, Hoggatt AF, Chitteti BR, Speth JM, Hu P, Poteat BA, Stilger KN, Ferraro F et al. 2013 Differential stem- and progenitor-cell trafficking by prostaglandin E2. Nature 495 365–369.
(doi:10.1038/nature11929)
Hoogland AM, Verhoef EI, Roobol MJ, Schro¨der FH, Wildhagen MF, van der Kwast TH, Jenster G & van Leenders GJ 2014 Validation of stem cell markers in clinical prostate cancer: a6-integrin is predictive for non-aggressive disease. Prostate 74 488–496. (doi:10.1002/pros.
22768)
Jakobsson PJ, Thore´n S, Morgenstern R & Samuelsson B 1999 Identification of human prostaglandin E synthase: a microsomal, glutathione-dependent, inducible enzyme, constituting a
potential novel drug target. PNAS 96 7220–7225. (doi:10.1073/pnas.96.
13.7220)
Kamei D, Murakami M, Sasaki Y, Nakatani Y, Majima M, Ishikawa Y, Ishii T, Uematsu S, Akira S, Hara S et al. 2009 Microsomal prostaglandin E synthase-1 in both cancer cells and hosts contributes to tumour
growth, invasion and metastasis. Biochemical Journal 425 361–371.
(doi:10.1042/BJ20090045)
Klarmann GJ, Hurt EM, Mathews LA, Zhang X, Duhagon MA, Mistree T, Thomas SB & Farrar WL 2009 Invasive prostate cancer cells are tumor initiating cells that have a stem cell-like genomic signature. Clinical & Experimental Metastasis 26 433–446. (
doi:10.1007/s10585-009-9242-2)
Kurtova AV, Xiao J, Mo Q, Pazhanisamy S, Krasnow R, Lerner SP, Chen F, Roh TT, Lay E, Ho PL et al. 2015 Blocking PGE2-induced tumour
repopulation abrogates bladder cancer chemoresistance. Nature 517 209–213. (doi:10.1038/nature14034)
Lu D, Han C & Wu T 2012 Microsomal prostaglandin E synthase-1 promotes hepatocarcinogenesis through activation of a novel EGR1/ b-catenin signaling axis. Oncogene 31 842–857. (doi:10.1038/onc.
2011.287)
Mantovani A, Allavena P, Sica A & Balkwill F 2008 Cancer-related inflammation. Nature 454 436–444. (doi:10.1038/nature07205) Marthick JR & Dickinson JL 2012 Emerging putative biomarkers: the role of
a2 and 6 integrins in susceptibility, treatment, and prognosis. Prostate Cancer 2012 298732. (doi:10.1155/2012/298732)
Miyake H, Pollak M & Gleave ME 2000 Castration-induced up-regulation of insulin-like growth factor binding protein-5 potentiates insulin-like growth factor-I activity and accelerates progression to androgen independence in prostate cancer models. Cancer Research 60 3058–3064.
Mohan S & Baylink DJ 2002 IGF-binding proteins are multifunctional and act via IGF-dependent and -independent mechanisms. Journal of Endocrinology 175 19–31. (doi:10.1677/joe.0.1750019)
Nabhan C, Lestingi TM, Galvez A, Tolzien K, Kelby SK, Tsarwhas D, Newman S & Bitran JD 2009 Erlotinib has moderate single-agent activity in chemotherapy naı¨ve castration-resistant prostate cancer: final results of a phase II trial. Urology 74 665–671. (doi:10.1016/j.
urology.2009.05.016)
Nanta R, Kumar D, Meeker D, Rodova M, Van Veldhuizen PJ, Shankar S & Srivastava RK 2013 NVP-LDE-225 (Erismodegib) inhibits epithelial-mesenchymal transition and human prostate cancer stem cell growth in NOD/SCID IL2Rg null mice by regulating Bmi-1 and microRNA-128. Oncogenesis 2 e42. (doi:10.1038/oncsis.2013.5)
Ørsted DD & Bojesen SE 2013 The link between benign prostatic hyperplasia and prostate cancer. Nature Reviews. Urology 10 49–54.
(doi:10.1038/nrurol.2012.192)
Oskarsson T, Batlle E & Massague´ J 2014 Metastatic stem cells: sources, niches, and vital pathways. Cell Stem Cell 14 306–321. (doi:10.1016/j.
stem.2014.02.002)
van Rees BP, Sivula A, Thore´n S, Yokozaki H, Jakobsson PJ, Offerhaus GJ & Ristima¨ki A 2003 Expression of microsomal prostaglandin E synthase-1 in intestinal type gastric adenocarcinoma and in gastric cancer cell lines. International Journal of Cancer 107 551–556. (doi:10.1002/ijc.
11422)
Rentala S, Yalavarthy PD & Mangamoori LN 2010 a1 and b1 integrins enhance the homing and differentiation of cultured prostate cancer stem cells. Asian Journal of Andrology 12 548–555. (doi:10.1038/aja.
2010.20)
Schlomm T, Kirstein P, Iwers L, Daniel B, Steuber T, Walz J, Chun FH, Haese A, Kollermann J, Graefen M et al. 2007 Clinical significance of epidermal growth factor receptor protein overexpression and gene copy number gains in prostate cancer. Clinical Cancer Research 13 6579–6584.
(doi:10.1158/1078-0432.CCR-07-1257)
Schrecengost R & Knudsen KE 2013 Molecular pathogenesis and progression of prostate cancer. Seminars in Oncology 40 244–258.
(doi:10.1053/j.seminoncol.2013.04.001)
Seshacharyulu P, Ponnusamy MP, Haridas D, Jain M, Ganti AK & Batra SK 2012 Targeting the EGFR signaling pathway in cancer therapy. Expert Opinion on Therapeutic Targets 16 15–31. (doi:10.1517/14728222.2011.
648617) En docrine -Rela ted Cancer
Sha W, Olesch C, Hanaka H, Ra˚dmark O, Weigert A & Bru¨ne B 2013 Necrosis in DU145 prostate cancer spheroids induces COX-2/ mPGES-1-derived PGE2 to promote tumor growth and to inhibit T cell activation. International Journal of Cancer 133 1578–1588.
(doi:10.1002/ijc.28181)
Sheski FD, Natarajan V & Pottratz ST 1999 Tumor necrosis factor-a stimulates attachment of small cell lung carcinoma to endothelial cells. Journal of Laboratory and Clinical Medicine 133 265–273. (doi:10.1016/
S0022-2143(99)90083-5)
Takahashi R, Amano H, Satoh T, Tabata K, Ikeda M, Kitasato H, Akira S, Iwamura M & Majima M 2014 Roles of microsomal prostaglandin E synthase-1 in lung metastasis formation in prostate cancer RM9 cells. Biomedicine & Pharmacotherapy 68 71–77. (doi:10.1016/j.biopha.2013.
10.008)
Takeda H, Miyoshi H, Tamai Y, Oshima M & Taketo MM 2004 Simultaneous expression of COX-2 and mPGES-1 in mouse
gastrointestinal hamartomas. British Journal of Cancer 90 701–704.
(doi:10.1038/sj.bjc.6601584)
Wieduwilt MJ & Moasser MM 2008 The epidermal growth factor receptor family: biology driving targeted therapeutics. Cellular and Molecular Life Sciences 65 1566–15684. (doi:10.1007/s00018-008-7440-8)
Xu D, Rowland SE, Clark P, Giroux A, Coˆte´ B, Guiral S, Salem M, Ducharme Y, Friesen RW, Me´thot N et al. 2008 MF63 [2-(6-chloro-1H-phenanthro [9,10-d]imidazol-2-yl)-isophthalonitrile], a selective microsomal prostaglandin E synthase-1 inhibitor, relieves pyresis and pain in preclinical models of inflammation. Journal of Pharmacology and Experimental Therapeutics 326 754–763. (doi:10.1124/jpet.108.138776) Xu LW, Qian M, Jia RP, Xu Z, Wu JP, Li WC, Huang WB & Chen XG 2012 Expression and significance of microsomal prostaglandin synthase-1 (mPGES-1) and Beclin-1 in the development of prostate cancer. Asian Pacific Journal of Cancer Prevention 13 1639–1644. (doi:10.7314/APJCP.
2012.13.4.1639)
Received in final form 4 June 2015 Accepted 23 June 2015
Made available online as an Accepted Preprint 25 June 2015 En docrine -Rela ted Cancer