Table of contents
ABBREVIATIONS
ABSTRACT
INTRODUCTION
LYSOSOMES: STRUCTURE AND FUNCTIONS LYSOSOMAL DISORDERS
LYSOSOMAL Ca2+ REGULATION
LYSOSOMAL BIOGENESIS REGULATION TRASCRIPTION FACTOR EB: TFEB
MITOCHONDRIA: STRUCTURE AND FUNCTION
MITOCHONDRIA AS SITE OF MAJOR ATP PRODUCTION Citric acid cycle
Respiratory chain
MITOCHONDRIA AND CELL FATE THE CONCEPT OF Ca2+ SIGNAL
THE PERMEABILITY TRANSITION PORE: mPTP
RESULTS: TFEB AND Ca2+ HOMEOSTASIS
INTRODUCTION RESULTS
CONCLUSIONS
RESULTS: c SUBUNIT OF ATP SYNTHASE INVOLVEMENT IN CELLULAR HOMEOSTASIS
INTRODUCTION RESULTS
CONCLUSIONS
MATERIALS AND METHODS
CELL CULTURE AND TRANSFECTION mRNA SILENCING
ANALYSIS OF LYSOSOMAL MORPHOLOGY
Lamp-GFP FLUORESCENCE ANALYSIS BY TALI® IMAGED-BASED CYTOMETER
PLASMA MEMBRANE AND LYSOSOMAL COLOCALIZATION THE PHOTOPROTEIN AEQUORIN
Recombinant Aequorin Luminescence detection
[Ca2+] MEASUREMENTS BY THE PHOTOPROTEIN AEQUORIN
FURA-2/AM MEASUREMENTS
QUANTIFICATION OF MITOCHONDRIAL ΔΨ
QUANTIFICATION OF PLASMA MEMBRANE POTENTIAL GPN AND VACUOLIN-1 TREATMENTS
MITOCHONDRIA SWELLING ASSAY
MITICHONDRIA SWELLING EXTRACTION, HIGH RESOLUTION BLUE NATIVE AND SDS POLYACRYLAMIDE GEL (PAGE) TWO
DIMENTIONAL SEPARATION IN-GEL ACTIVITY ASSAY
MITOCHONDRIA ISOLATION FROM HeLa CELLS Co2+-CALCEIN ASSAY
CO-IMMUNO PRECIPITATION IMMUNOBLOTTING
STATISTICAL ANALYSIS
Abbreviations
Ψm Mitochondrial membrane potential
Ψmp Plasma membran potential
[Ca2+]c Cytoplasmic calcium concentration [Ca2+]m Mitochondrial calcium concentration
[Ca2+]er Endoplasmic reticulum calcium concentration acetyl-CoA acetyl coenzyme A
ADP Adenosine 5’ DiPhosphate
ANT Adenine Nucleotide Translocase
AIF Apoptosis-Inducing Factor
ATG13 Autophagy-related protein 13
ATP Adenosine 5’ TriPhosphate
Bcl-2 B cell leukemia/lymphoma 2
Bcl-xL B cell leukemia/lymphoma extra large
bHLH basic Helix-loop-helix
Ca2+ Calcium
ClC7 Cloride Channel 7
CLEAR Coordinated Lysosomal Expression and Regulation
CMA Chaperone-Mediated Autophagy
CsA Cyclosporine A
DAG Diacylglycerol
DIABLO Direct inhibitor of apoptosis-binding protein with a low isoelectric point
DMSO DiMethyl SulfOxide
DOA Dominant Optic Atrophy
DRP1 Dynamin Related Protein 1
ER Endoplasmic Reticulum
ERK2 Extracellular signal-Regulated Kinase 2
ETC Electron Transport Chain
FAD Flavin Adenine Nucleotide
FCCP Carbonyl Cyanide –p- trifluoromethoxyphenylhydrazone FIP200 focal adhesion kinase Family–Interacting Protein of 200 kDa FIS1 Mitochondrial fission 1 protein
GFP Green Fluorescent Protein
GPN Glycyl-Phenylalanyl-Napthylamide
GTP Guanine TriPhosphate
HIF1α Hypoxiainducible Factor 1α
HtrA2 High temperature requirement protein A2 IAP Inhibitor of Apoptosis Proteins
IMM Inner Mitochondrial Membrane
IMS Intermembrane Space
IP3 Inositol 1,4,5-trisphosphate
IP3R Inositol 1,4,5-trisphosphate receptor
JC1 J-aggregate forming lipophilic cation 5,59,6,69-tetrachloro-1,19,3,39 tettraethylbenzimidazol-carbocyanine iodine
kDa KiloDalton
LAMP Lysosomal-Associated Membrane Protein
LYNUS LYsosomal NUtrient Sensing
LysoNaATP endolysosomal ATP-sensitive Na+-permeable channel
MAM Mitochondria Associated Membrane
MCOLN1 Mucolipin1
MFN Mitofusin
Mg2+ Magnesium
MITF Microphthalmia-associated transcription factor MiT/TFE Microphthalmia-transcription factor E
MOMP Mitochondrial Outer Membrane Permiabilization
MP6 Mannose-6phosphate
MP6R Mannose-6phosphate receptor
MPT Mitochondrial Permeability Transition mPTP mitochondrial Permeability Transition Pore mtGFP mitochondrial Green Fluorescent Protein
mTORC kinase complex mammalian Target Of Rapamiycin Complex NAADP Nicotinic Acid Adenine Dinucleotide Phosphate
NADH Nicotinamide Adenine Dinucleotide
NADP Nicotinamide Adenine Dinucleotide Phosphate NCX Na+/Ca2+ exchanger
OMM Outer Mitochondrial Membrane
OPA1 Optic atrophy 1
OXPHOS OXidative PHOSphorylation
PG1α PPARγ co-activator 1α
PiC inorganic Phosphate Carrier
Pin1 Peptidyl-prolyl cis/trans isomerase
PKCβ Protein Kinase Cβ
PMCA Plasma Membrane Ca2+-ATPase
PPAR Peroxisome Proliferator-Activated Receptor PPIF Peptidyl Prolyl Isomerase F
RNA RiboNucleic Acid
RNS Reactive Nitrogen Species
ROC Receptor-Operated Channels
ROS Reactive Oxygen Species
RyR Ryanodine Receptor
SERCA Sarco/Endoplasmic Reticulum Ca2+-ATPase
siRNA short interfering RNA
Smac Second mitochondria-derived activator of caspase
SMOC Second Messenger-Operated Channels
SNARE N-ethylmaleimide-sensitive factor attachment protein receptors
SOC Store-Operated Channel
SYTVII Synaptotagmin VII
TCA Citric Acid Cycle
TFE3 Trascription Factor E3
TFEB Trascription Factor EB
TFEC Trnscription Factor EC
TGN trans-Golgi Network
TNF-alpha Tumour Necrosis Factor alpha
TPC Two Pore Channel
TRP Transient Receptor Potential
TRPML Transient Receptor Potential MucoLipin TSPO Peripheral Benzodiazepine Receptor
ULK UNC-51 Like Kinase
Vac1 Vacuolin1
VAMP Veisicle-Associated Membrane Protein
VDAC Voltage-Dependent Anion Channels
Abstract
This thesis focuses on two different proteins and their involvement in cellular homeostasis: the transcription factor EB (TFEB), with the effects it has on cellular Ca2+ homeostasis, and the c subunit of mitochondrial F1/FO ATP synthase, and its important role in the mitochondrial permeability transition pore (mPTP).
TFEB is a master regulator of the lysosomal gene network and it has been demonstrated that the overexpression of TFEB induces lysosomal biogenesis, with a consequent increase of the total lysosomal content per cell, and enhances lysosomal trafficking and their plasma membrane proximity. On the other hand, the recent identification of regulated Ca2+ channels in lysosomes suggests that they too may contribute to cytosolic Ca2+ signalling. Starting from these observations, we decided to investigate the role of TFEB and the contribution of lysosomes in intracellular Ca2+ homeostasis more in depth. We investigated the effects of the transiently TFEB3xflag overexpression on Ca2+ homeostasis in HeLa cells, by measuring mitochondrial and cytosolic Ca2+ response after agonist stimulation, capacitative calcium entry and Ca2+ dynamics in endoplasmic reticulum. No remarkable difference was observed in mitochondrial and cytosolic Ca2+ response but we found interesting effects of TFEB overexpression in the capacitative calcium entry. Furthermore, we proved that, if lysosomes are destroyed or damaged by using GPN or Vacuolin-1, these effects are deleted. Moreover, we observed a delay in the calcium uptake time necessary to reach the plateau in endoplasmic reticulum when TFEB is overexpressed. These observations suggest a possible Ca2+ buffering role of lysosomes and cast light on a new possible lysosomal function.
The mitochondrial permeability transition (MPT) is an alteration in the permeability of the mitochondrial inner membrane. Many studies assumed that the permeability transition state is caused by a high permeability channel, namely the mPTP. Although so far the real structure of the mPTP has not been defined clearly, several lines of evidence suggest that mitochondrial ATP synthase is connected to mPTP. The C
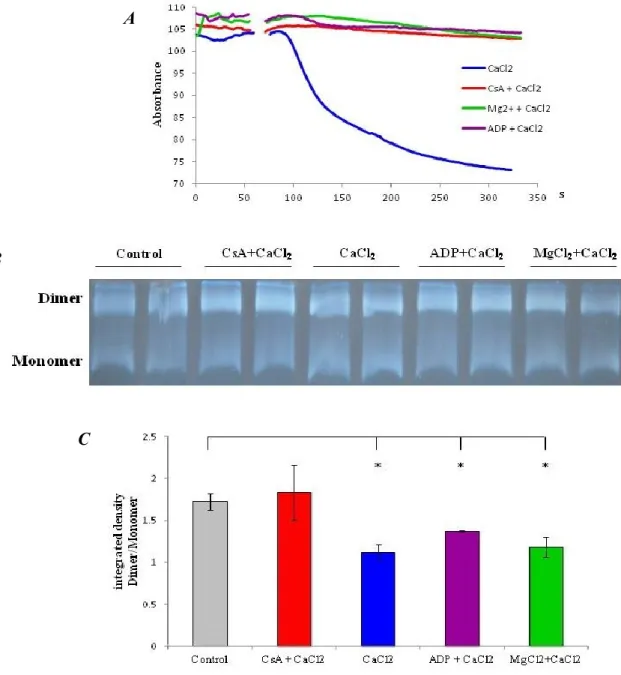
subunit of the mitochondrial F1/Fo ATP synthase plays a key role in the activity of the enzyme as it creates the c-ring of the Fo portion. Here, we confirm the theory that considers the c subunit of the mitochondrial F1/Fo ATP synthase as an important player in mPTP formation, with a crucial role in the MPT activity. We used the Blue Native assay to get information about possible conformational arrangements of F1/Fo ATP synthase, which are necessary for the mPTP opening; in particular, we focused on the dimer or monomer state of the enzyme. Then, we considered the possibility of F1/Fo ATP synthase arrangements in sub-complexes after the induction of mPTP opening and we drew our attention to three F1/Fo ATP synthase subunits: α, γ and c. Results from the co-IP experiments showed that subunit α, γ and c of ATP synthase interact with each other and that the interaction persists after induction of mPTP opening. Moreover, in order to check if one or more subunits of the enzyme could be fundamental for the mPTP opening, we performed the silencing of several F1/Fo ATP synthase subunits by the use of siRNA technique in HeLa cells. In association with the silencing, we used Co2+-Calcein assay and fluorescence microscopy to observe mPTP opening after induction with ionomycin. Our results confirmed the involvement of F1/Fo ATP synthase in the MPT process, in particular in the mPTP structure, and suggest a key role of the c subunit of F1/Fo ATP synthase in the mPTP opening.
Introduction
LYSOSOMES: STRUCTURE AND FUNCTIONS
Lysosomes are membrane-bound organelles that constitute up to 5% of intracellular volume of eukaryotic cells. They have been discovered in 1955 from Christian Duve that observed the “latency” acid phosphatase activity and postulate the presence of this enzyme in e membrane-enclosed compartment (1). Next year, Alex Novikoff showed
the first morphological demonstration by electron microscopy (2). Today is well known
from literature, in agreement with these initial observations, their existence, biogenesis, morphology, diverse functions and failure in disease.
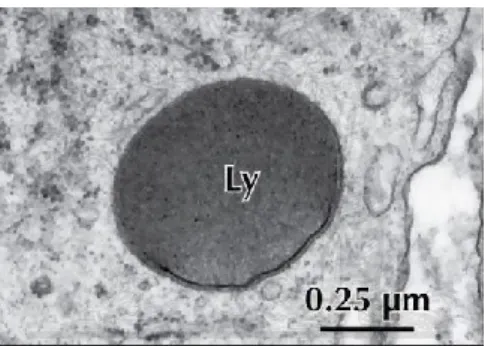
Fig. 1) Electron Micrograph of a Primary Lysosome (Ly) (image from Netter's Essential Histology)
Lysosomes are limited by a single phopholipid bilayer and their shape varies between globular and tubular patterns of ̴ 0,5µm diameter. As the same, their content can be heterogeneous: usually they appear electron-dense but often include irregularities and membrane sheets (3). Acidic interior with a pH of 4.5-5, is a common characteristic: it
is maintained by the vacuolar V-H+-ATPase, a transmembrane multiprotein complex that use energy derived from ATP hydrolysis to transport in protons across the lysosomal membrane (4), (5). Additional lysosomal membrane channels are probably
involved in lysosomal acidification, such as the anion transporter cloride channel 7 (ClC7), the cation transporters mucolipin 1 (MCOLN1 or TRPML1) and the two pore channel 1 (TPC) 1 and 2, which mediate Ca2+ and Na+ release from the lysosomes (6), (7), (8), (9), (10). The precise mechanisms that involve TPC2 and MCOLN1 in the complex
regulation of lysosomal acidification and ion balance are still controversial and require further investigation.
Segregate the ‘aggressive’ acidic environment of the lumen from the rest of the cell, is the main function of lysosomal membrane. This is ensured by presence of a thick glycocalyx, the polysaccarde-based coating that lines the internal perimeter to prevent the lysosomal membrane being degraded. The lysosomal membrane also actively mediates the fusion of lysosomes with other structures, such as endosomes, autophagosomes and plasma membrane, as well as the transport of metabolites, ions and soluble substrates into and out of the organelle. Lysosomal trafficking and fusion are mediated by specific sets of membrane-associated Rab GTPases (11),(12) and a
specific combinatorial set of N-ethylmaleimide-sensitive factor attachment protein receptors (SNARE) (13), including veisicle-associated membrane protein (VAMP) (see
below).
Into their acid matrix lysosomes contain more than 50 different acid hydrolases (proteinase, peptidase, phosphatases, nucleases, glycosidaes, sulphatase, lipases) and several activator protein that are localized mainly in the matrix (1). In a concerted
action this hydrolases are able to decompose simple and complex macromolecules and even membranes into their monomeric constituents, which are either recycled through biosynthetic pathways or further degraded to generate energy. The targeting of lysosomal matrix enzymes to lysosomes, as well as their ability to be secreted and taken up again by cells, is mediated by a mannose-6-phosphate (MP6) modification that they undergo in the late Golgi compartments (14), (15). The MP6 tags are recognized
and bound in the trans-Golgi network (TGN) by two different mannose-6-phosphate receptors (M6PR) that cycle between the TGN end endosomes (16). Unlike soluble
hydrolase, the delivery of newly synthesized lysosomal membrane proteins from the TGN, occurs either by an indirect route via plasma membrane or by a direct intracellular rout (17).
The question of how lysosomes form, has captivated the interest of cell biologists for decades. Early microscopy studies suggested lysosomes form by direct budding from the Golgi complex. Later studies led to models proposing lysosome maturation from endosomal compartments (18). The “maturation” model involves formation of early
endosomes by coalescenc of vesicles and addition of TGN-derived vesicles converts these endosomes to late endosomes, and eventually to lysosomes (Murphy rf, trends cell boil 1991). Alternatively there are three more possible models known from literature: transport”, “kiss and run” and “fusion-fission”. The “vesicle-transport” model postulates that early endosomes, late endosomes and lysosomes are stable compartments and the transport proceeds from early to late endosomes and then to lysosomes. The “kiss and run” model proposes that endosomes and lysosomes undergo repeated cycles of fusion and fission allowing transfer of materials and maintenance of mature lysosomes. The “fusion-fission” model is a variation of the “kiss and run” in which late endosomes and lysosomes undergo heterotypic fusion producing a hybrid organelle containing markers of both compartments (18).
Fig. 2) The structure of lysosomes (19)
The view that lysosomes are simply a ‘garbage-disposal-units’ has been challenged. Lysosomal functions are several and they can be schematically divided into three main types: degradation, secretion and signalling.
Lysosomal-mediate degradation
In all cells the primary degradative organelle is the lysosomes. Lysosomes receive intracellular or extracellular waste through various pathways including endocytosis and autophagy. Extracellular material reaches the lysosomes mainly by endocytosis, and occurs through specific mechanism according to the nature of the cargo.
Prominent examples of endocytosis are phagocytosis, macropinocytosis, clathrin-mediate endocytosis, caveolin-clathrin-mediate endocytosis and clathrin- and caveolin- mediated endocytosis (20). A generalized route map for the passage of endocytosed
material to lysosomes has been established. By definition, this material is delivered first to early endosomes, then to late endosome and subsequentely to lysosomes; the time of delivery to each endosomal compartment varying between cell types (21). The
early endosome is the major sorting compartment of the endocytic pathway, in which many ligands dissociate from their receptor in the pH of the lumen and from which many of the receptors recycle to the cell surface (22), (23). The membrane traffic pathway
from early to late endosomes has been well clarified (24), in contrast different models
have been proposed to explain how cargo is trafficked from late endosomes to lysosomes. A known hallmark of endosome-to-lysosome maturation is the progressive decrease of the internal pH to pH ̴ 5 in the mature lysosomes, crucial for the uptake of acid hydrolase (25).
Intracellular materials reach the lysosomes trough the process of autophagy, a ‘self-eating’ catabolic pathway and evolutionarily conserved, that is used by cell to degrades cytoplasmic components, thus contributing to cell survival and tissue homeostasis. Three type of autophagy have been identified: micro-autophagy, cytosolic protein are engulfed in the lysosome trough direct lysosomal membrane invagination; chaperone-mediated autophagy (CMA), cytosolic proteins are transported into the lysosome lumen through chaperone- and receptor-mediated internalization; macroautophagy, relies on the biogenesis of autophagosome that sequester cytoplasmic material and then fuse with lysosomes. Thus, the role of all three types of autophagy is strictly dependent on lysosomal function.
Lysosomal exocytosis
Lysosomes can secrete their content through a process called exocytosis. Contrary to what was thought at the beginning, not only ‘professional secretory cells’, but any cell type can perform lysosomal exocytosis. Lysosomal exocytosis mediates several physiological process, such as degranulation in cytotoxic T lymphocytes (26), bone
melanocyte function in pigmentation (30), platelet function in coagulation (31), and
hydrolase release by spermatozoa during fertilization (32).
In this process, lysosomes fuse with the plasma membrane in response to an increased in the concentration of cytosolic Ca2+ that leads to a bulk release of the lysosomal content into the extracellular matrix (33) (34). It can be detected by the translocation of
lysosomal membrane marker protein, like lysosomal-associated membrane 1 (LAMP1), to the plasma membrane (35) (36). As mentioned above, lysosomes fusion
with plasma membrane, also with endosomes and phagosomes, is controlled by SNARE. The molecular machinery mediating Ca2+-regulated exocytosis of conventional lysosomes includes the vesicle SNARE (v-SNARE) VAMP7, that forme a trans-SNARE complex with syntaxin 4 and the target SNAREs (t-SNARE) synaptosome-associated protein of 23kDa (SNAP23) on the plasma membrane, allowed by several Rab protein on the lysosomal surface (37) (38). The Ca2+ sensor
synaptotagmin VII (SYTVII) on lysosomes regulates lysosomal exocytosis and restrict both the kinetics and the extent of Ca2+-dependent fusion (37). Another important
mediator of lysosomal exocytosis is the lysosomal membrane Ca2+ channel MCOLN1
(39) (40).
Addictionally, lysosomal exocytosis provides the extra membrane for plasma-membrane wound repair (41) and allows the formation of a parasitophorous vacuole, a
membrane-bound organelle that contains an intracellular parasite. Plasma membrane enjuries induce the rapid migration of lysosomes to the damaged site. Lysosomes than fuse with the plasma membrane and efficiently reseal the damaged sites, process important in defence mechanism against bacterial infection (42).
Signalling from Lysosomes
The involvement of the lysosomes in nutrient sensing is a new concept that expands our view of this organelle from simply being an effector of cellular clearance to being a sensor and regulator of various cellular functions including, cell cycle progression, growth, macromolecules biosynthesis and autophagy.
The kinase complex mammalian target of rapamiycin complex 1 (mTORC1), a master controller of cell and organism growth (43), exert its activity on the lysosomal surface
(44). Growth factor, hormones, amino acids, glucose, oxygen, and stress are the major
activator of mTORC1, which in turn positively regulates proteins, mRNAs, lipid biosynthesis and ATP production. When nutrients are present, mTORC1 directly phosphorilates and suppresses the activity of the kinase complex ULK1-ATG13-FIP200, required to induce autophagosome biogenesis (45). The inhibition of mTORC1,
either by starvation or drugs, leads to the activation of ULK1-ATG13-FIP200 and autophagy. It was recently shown that the level of amino acids inside the lysosomal lumen controls mTORC1 docking on the lysosomal surface, which is a prerequisite for its activity, and that amino acids must accumulate in the lysosomal lumen in order for mTORC1 to bind and become activated (46). These observation support the idea that
mTORC1activity is dependent on the lysosomes. Another study demonstrates the presence of an interaction between an endolysosomal ATP-sensitive Na+-permeable channel, lysoNaATP, and mTORC1, on the lysosomal membrane. Thus, lysoNaATP regulates lysosomal pH stability and amino acid homeostasis by responding to ATP levels (47). Thus, a complex signaling machinery, which involve mTORC1 and other
protein complexes is located on the lysosomal surface. This machinery, herein referred like LYNUS, lysosomal nutrient sensing, responds to the lysosomal amino acid content and signals the information both cytoplasm and the nucleus.
It’s also important to mention the involvement of lysosomes in apoptotic process. For many years lysosomes have been though have a role limited to the digestion of engulfed apoptotic bodies (48). Likewise, lysosomal protease function was believed to
be limited to non specific intracellular protein degradation occurring within the lysosomes. These concepts now seem to be outdated. Indeed, partial lysosomal permeabilization with subsequent release of proteolytic enzymes into the cytosol and their active contribution to the signaling pathways, has been recently described in several models of apoptosis (49). The key-factor in determining the type of the cell
death (necrosis versus apoptosis) mediated by lysosomes enzymes seems to be the magnitude of lysosomal permeabilization, and, consequently, the amount of proteolytic enzymes released into the cytosol (50). A complete breakdown of the
organelle with release of high concentration of lysosomal enzyemes into the cytosol, results in unregulated necrosis, whereas partial, selective permeabilization trigger apoptosis (51). Once in the cytosol, the amount of lysosomal enzymes is sufficient to
overcome the protective barrier of the endogenous inhibitors (i.e. cystatins), and contribute to the execution of apoptotic program either by direct cleavage of key cellular substrates, or by acting in concert with caspases in the signaling pathway (52)
(53).
LYSOSOMAL DISORDERS
Seen the involvement of lysosomes in several processes that takes part in the cell, it is not surprising the existence of many pathology due to their disorders. Indeed, lysosomal disfunction has been associated with several human diseases, as well as the process of ageing. In particular, lysosomal storage disease (LSDs) are a group of rare and recessively inherited metabolic dysfunction of more than 50 genetic disorders caused by deficiency of lysosomal proteins or non-lysosomal proteins but that contributes to lysosomal function (54). These disorders are due to genetic defects, that
lead to the accumulation of substrate that are not degraded in the lysosomal lumen, followed by progressive lysosomal dysfunction in several tissue and organs. Most LSDs are caused by deficiency of soluble lysosomal proteins residing in the lumen of the lysosome. A minority is caused by defects in lysosomal membrane protein. It must be emphasized that in most lysosomal diseases more than one compound accumulates and in some disorder for various reasons the stored material can be rather heterogeneous (54). A generic pathway is presented: mutations of genes that encode for
protein involved in lysosomal functions result in a accumulation of specific substrates that have not been degraded in lysosome (primary storage). This lead to the accumulation of additional lysosomal substrate (secondary storage) due to a blockage in lysosomal trafficking. Excessive lysosomal storage has a broad impact on lysosomal function by causing defects in Ca2+ homeostasis, signally abnormalities and lysosomal membrane permeabilization. In addition, lysosomal dysfunction is associated with authophagy impairment, due to defective fusion between lysosomes and autophagosomes. This causes the accumulation of autophagic substrates such as aggregate-prone proteins and dysfunctional mitochondria (19). LSDs are most
Tab. 1) Examples of lysosomal storage diseases. Left column gives the name of the disease, middle column the deficient protein and the right column the stored compounds. GM1, GA1, GM2,GM3, GD1A are abbreviations for the respective gangliosides. SCMAS: subunit c of mitochondrial ATP synthase. (54)
LYSOSOMAL Ca2+ REGULATION
Lysosomes have a high intravesicular Ca2+ concentration estimated to be in the region of 500-600µM (55), that is maintained an unidentified H+-Ca2+ exchanger. Better known
are the proteins involved in lysosomal Ca2+ release.
The role of Ca2+ in lysosomal function is supported by the well-established paradigm of its role in organellar and plasma membrane fusion (56) but only recently the
lysosomes are considered emerging Ca2+ signaling center of the cell (57). Starting from
identification of nicotinic acid adenine dinucleotide phosphate (NAADP), a metabolite of NADP (58), as a potent Ca2+- mobilizing messenger that did not require activation of
IP3R or RyR (59), than other substantial evidence established that NAADP-evoked Ca2+
discovery that in the sea urchin eggs, the effects of NAADP are selectively abolished by disruption of acidic organelles, most notably by glycyl-phenylalanyl-napthylamide (GPN) which selectively destroy lysosomes (57). Thus, many study focused attention on
endo-lysosomal Ca2+ channels as candidates for the NAADP-gated channel; the more persuasive and extensive evidence suggest that NAADP-gated channel are formed by oligomeric assemblies of two pore channel, TPC, proteins (61) recently emerged as a
novel intracellular calcium release channel (62). At the presence, the strongest evidence
support TPC2 as the lysosomal Ca2+ channel and TPC1 as the endosomal Ca2+ channel. TPCs have a domain structure similar to one-half of voltage-sensitive Ca2+ channels and they are composed of two repeats of six trans-membrane helices each encompassing a putative pore (62).
Another candidate is MCOLN1, also known as the member of the mucolipin family of transient receptor potential (TRP) channel TRPML1, a lysosomal nonselective cation channel (63). MCOLN1 plays a role in lysosomal Ca2+ release (8) and in the
lysosomal-endosomal fusion (64). The TRP channels are tetrameric cation channels and are
activated by a wide range of stimuli, including G protein-coupled receptor interaction, ligand activation and temperature (65). MCOLN1 protein is localized to lysosomes and
it is encoded by the MCOLN1 gene (mutated in the lysosomal storage disorder mucolipidosis type IV).
LYSOSOMAL BIOGENESIS REGULATION
Cell metabolism is controlled by complex networks of genes, proteins and metabolites, which sense the cellular environment and organize the appropriate responses. In the past two decades, the importance of regulatory gene networks in cell metabolism has become evident in every aspect of cell function. In this context, the transcriptional networks associated with biogenesis and function organelles are of particular interest. Sardiello et al. observed how genes encoding lysosomal proteins tend to have coordinated expression (66). Pattern discovery analysis of the promoter region of the 96
known lysosomes genes (67) resulted in the identification of a palindromic 10-base pair
preferentially located within 200bp from the transcription start site (TSS), either in a single sequence or as tandem multiple copies. They named this motif coordinated lysosomal expression and regulation (CLEAR) element (66). The CLEAR consensus
sequence overlaps that of the E-box (CANNTG), a known target site for basic helix-loop-helix (bHLH) transcription factors (68). In particular, members of the
microphthalmia-transcription factor E (MiT/TFE) subfamily of bHLH factors were found to bind sequence similarly to the CLEAR consensus (69). The MiT/TFE
subfamily is composed of four members in humans: MITF, TFE3,TFEB, and TFEC
(70). In their work Sardiello et al. demonstrate that only TFEB is responsable of an
increase of mRNA level of lysosomes genes. Moreover, an expansion of the lysosomes compartment was detected by stably overexpression of TFEB. Accordingly, ultrastructural analysis revealed a significant increase in the number of lysosomes per cell, indicating the involvement of TFEB in lysosomal biogenesis (66). This discovery,
of a ‘lysosomes gene network’, and of its master regulator TFEB has reveal that lysosomal function can be coordinated.
TRASCRIPTION FACTOR EB: TFEB
The transcription factor EB, TFEB, is a member of the bHLH leucine-zipper family of TFs. TFEB recognize E-box sequence, site presents also in the CLEAR consensus sequence. TFEB binding CLEAR site promotes lysosomal genes expression (66).
Under basal conditions, in most cell types, TFEB is phosphorylated and located in the cytoplasm. TFEB translocation’s to the nucleus is a process controlled by its phosphorylation status, the dephosphorilated form is found in the nucleus (71).
Phosphoproteomic studies identified at least ten different phosphorylation sites in the TFEB protein and at least three different kinases: extracellular signal-regulated kinase (ERK2) (71) (72), mTORC (72-74) and protein kinase Cβ (PKCβ) (75). Interestingly,
cytoplasmic TFEB is located both in cytosol and on the lysosomal surface, where it interacts with mTORC1 and LYNUS machinery (73). This observation suggests a
mechanism by which the lysosomes regulates its own biogenesis by controlling TFEB subcellular localization. More recently, TFEB was shown to interact with active RAG
GTPases. This interaction promotes the lysosomal localization of TFEB and its mTORC1-dependent phosphorylation (76).
Not only biogenesis and lysosome-to nucleus signaling are controlled by TFEB, but also exocytosis and fusion of lysosome with plasma membrane, and lipidic catabolism
(19). In lysosomal exocitosis, TFEB induces both docking and fusion of lysosomes with
plasma membrane by regulating the expression of certain genes, the protein products of which increase lysosomal dynamics and cause a MCOLN1-mediated increase in intracellular Ca2+ (40). Interestingly, TFEB-mediated regulation of lysosomal
exocytosis has an important role in osteoclast differentiation and bone resorption (75).
Moreover, TFEB was found to regulate lipid metabolism (77). Trascriptome analysis in
the mouse liver after viral-mediated TFEB overexpression revealed that this transcription factor positively regulates the expression of genes involved in several steps of lipid breakdown, such as lipophagy, fatty acid oxidation and ketogenesis. Interestingly, peroxisome proliferator-activated receptor-α (PPARα) and PPARγ co activator 1α (PG1α), which are key regulators of lipid metabolism in response to starvation (78), are significantly induced by TFEB. The recent discovery of
MITOCHONDRIA: STRUCTURE AND FUNCTIONS
Mitochondria are organelles with complex structures and functions. They are derived from an α-proteobacterium-like ancestor, due to an ancient “invasion” that occurred more than a billion years ago (79). The acquisition of mitochondria (and plastids) was a
key event in the evolution of the eukaryotic cell, supplying it with bioenergetic and biosynthetic factors. At subcellular resolution mitochondria are composed of an outer membrane (OMM), mostly permeable to ions and metabolites up to 10 kDa, and a highly selective inner mitochondrial membrane (IMM), characterized by invaginations called cristae. The space between these two structures is called the intermembrane space (IMS). Together, the OMM and IMM enclose the mitochondrial matrix. The IMM is further subdivided into two compartments: the peripheral inner boundary membrane and the cristae (80). Cristae are not simply random folds, but rather internal
compartments formed by profound invaginations originating from very tiny “point-like structures” in the inner membrane. These narrow tubular structures, called cristae junctions, can limit the diffusion of molecules from the intra-cristae space towards the IMS, thus creating a microenvironment where mitochondrial electron transport chain (ETC) complexes (as well as other proteins) are hosted and protected from random diffusion. The inner boundary membrane is enriched with structural proteins and components of the import machinery of mitochondria (81). Mitochondrial morphology
in living cells is heterogeneous and can range from small spheres to interconnected tubules. This heterogeneity results from the balance between fusion and fission processes, and represents a phenomenon termed mitochondrial dynamics (82). A growing body of evidence indicates that mitochondrial morphology is critical for the physiology of the cell and changes in mitochondrial shape have been related to many different processes such as development, neurodegeneration, calcium (Ca2+) signalling, reactive oxygen species (ROS) production, cell division, and apoptotic cell death (83).
Mitochondrial shape is controlled by the identified “mitochondria-shaping proteins”, which regulate the fusion-fission equilibrium of the organelle. In mammals, key components of the fusion machinery include the homologues MFN1 and MFN2 (83).
The only dynamin-like GTPase currently identified in the IMM is OPA1, a fusion protein that is mutated in dominant optic atrophy (DOA), the most common cause of inherited optic neuropathy. Post-transcriptional mechanisms, including proteolytic
processing, tightly regulate OPA1 activity. In mammalian cells, mitochondrial division is regulated by DRP1 and FIS1 (84) (85). The large GTPase DRP1 is a cytosolic
dynamin-related protein, whose inhibition or downregulation results in a highly interconnected mitochondrial network. The same phenotype is caused by the downregulation of FIS1, a protein of the OMM, proposed to act as a mitochondrial receptor for DRP1 (86). For example, mitochondrial dynamics seem to influence
production of ROS and cellular longevity. DRP1-dependent fragmentation of the mitochondrial reticulum is a crucial component for accumulation of ROS in pathological conditions (87). How mitochondrial fission is required for ROS production
and lifespan remains unclear, although a link between the two processes seems plausible. Hence, factors other than mitochondrial metabolism per se could have a role in the pathogenesis of ROS-related diseases. Interestingly, many ROS (as well as Reactive Nitrogen Species, RNS) sources and targets are localized in the mitochondria and ER with are relevant consequences for different pathways (88).
MITOCHONDRIA AS SITE FOR MAJOR ENERGY PRODUCTION
Within cells, energy is provided by oxidation of “metabolic fuels” such as carbohydrates, lipids and proteins. It is then used to sustain energy-dependent processes, such as the synthesis of macromolecules, muscle contraction, active ion transport or thermogenesis. The oxidation process results in free energy production that can be stored in phosphoanhydrine “high-energy bonds” within molecules such as nucleoside diphosphate and nucleoside triphosphate (i.e., adenosine 5' diphosphate and adenosine 5’ trisphosphate, ADP and ATP, respectively), phosphoenolpyruvate, carbamoyl phosphate, 2,3-bisphosphoglycerate, and other phosphates like phosphoarginine or phosphocreatine.
Among them, ATP is the effective central link-the exchange coin-between energy producing and the energy demanding processes that effectively involve formation, hydrolysis or transfer of the terminal phosphate group. In general, the main energy source for cellular metabolism is glucose, which is catabolized in the three subsequent processes: glycolysis, tricarboxylic acid cycle (TCA or Krebs cycle), and finally oxidative phosphorylation to produce ATP. In the first process, which takes place in
cytosol, glucose is converted into pyruvate: this generate a low amount of ATP produced. Only 5% of ATP generate by glucose is provided by glycolysis. Subsequently, pyruvate is converted to acetyl coenzyme A (acetyl-CoA), which enters the TCA cycle, enabling the production of NADH. Finally, NADH is used by the respiratory chain complexes to generate a proton gradient across the inner mitochondrial membrane, necessary for the production of large amounts of ATP by mitochondrial ATP synthase. In addition, it should be mentioned that acetyl-CoA could be generated also by lipid and proteincatabolism.
Citric acid cycle
The citric acid cycle (TCA) was elucidated by Sir Hans Krebs in 1940 (89). The triose
deriving from glycolysis is completely oxidized into three molecules of CO2 during a sequence of reactions that allow the reduction of cofactors NAD and flavin adenine nucleotide (FAD), providing energy for the respiratory chain in the form of electrons. In 1949 Kennedy and Lehningher demonstrated that the entire cycle occurs inside mitochondria (89). The first reaction of the citric acid cycle is the condensation of one
Acetyl-CoA and a molecule of citrate to generate oxaloacetate and is catalysed by citrate synthase. Citrate is then transformed into isocitrate by aconitase through the formation of cis-aconitate. This step is reversible and could lead to the formation of both citrate and isocitrate. Only the fast consumption of isocitrate by its dehydrogenase can force the reaction to the proper direction. Isocitrate dehydrogenase catalyses the first irreversible oxidation leading to the decarboxylation of isocitrate, generating CO2 and α-ketoglutarate. The second carbon leaves the cycle in the following step, when the newly generated α-ketoglutarate is immediately decarboxylated by the α-ketoglutarate dehydrogenase complex in a reaction similar to the pyruvate decarboxylation. In fact, both these complexes share high similarities in enzyme amino acid composition and in the organization of the different subunits. Energy released from both oxidations is used to generate NADH from NAD that directly feeds into the respiratory chain. The following step is catalysed by succinyl-CoA synthetase and utilizes the energy derived from the succinyl-CoA removal to phosphorylate GDP (or ADP) to GTP (or ATP). Selectivity for the nucleotide is determined by the isozyme involved. It has been well established that at least two
isozymes of succinyl-CoA synthetase are expressed in animal tissues (90) and the
proportion between them seems to be tissue specific. The succinate generated in the previous step is the 4 carbon compound that is then converted, by three sequential reactions, to oxaloacetate to conclude the cycle. The first of these steps is the oxidation of succinate to fumarate by succinate dehydrogenase. This enzyme, tightly bound to the inner mitochondrial membrane (IMM), catalyses FAD reduction to FADH2 that provides electrons for the respiratory chain. Fumarate is then hydrated by fumarate hydratase to L-malate. Both succinate dehydrogenase and fumarate hydratase are oncosuppressor genes and their inactivation leads to the accumulation of succinate and fumarate that spread in the cytosol and promote hypoxiainducible factor 1α (HIF1α) accumulation by inactivating prolyl hydroxilase enzymes (promoter of HIF1α degradation); HIF1α, promotes a pseudo-hypoxic condition that favours tumour development (91). The last event that completes the citric acid cycle is the oxidation of
Lmalate to oxaloacetate. This reaction is performed by L-malate dehydrogenase, which induces the reduction of another molecule of NAD to NADH. The resulting molecule of oxaloacetate is suitable for starting another cycle through condensation with an acetyl group.
During all these processes, only one molecule of ATP (or GTP) is produced, but three molecules of NADH and one of FADH2 (plus one molecule of NADH from pyruvate dehydrogenase), which provide electrons for respiratory chain, are also generated and subsequently result in the production of large amounts of ATP (92).
Respiratory chain and oxidative phosphorylation
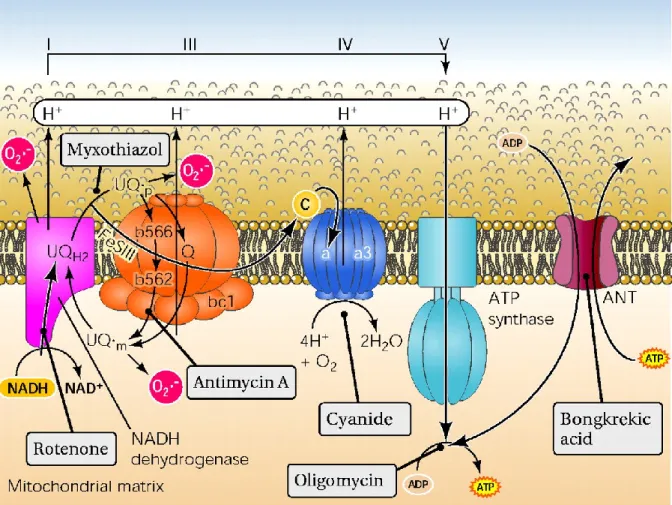
Respiratory chain comprises a series of hydrophobic complexes conducting electron transfer across the membrane and involved in oxidative phosphorylation (OXPHOS), a process that occurs in aerobic conditions. In eukaryotic cells, electron transport occurs in mitochondria and chloroplasts, whereas in bacteria it is carried out across the plasma membrane. As mentioned, the electron transfer is considered a part OXPHOS, the process through which ADP is phosphorylated into ATP by dint of energy derived from the oxidation of nutrients. The majority of the complexes are integral membrane proteins containing prosthetic groups capable of accepting or donating one or two electrons. Respiratory chain complexes I, III and IV, located in the IMM, and are able
to produce an electrochemical potential across the mitochondrial membrane by creating a concentration gradient of H+ ions between the two sides of the membrane. This potential is exploited to activate the transport channels present on the membrane and to promote the synthesis of ATP by ATP synthase. The electron carriers of the respiratory chain are organized in separated supramolecular intramembrane complexes, and each of them represents a fraction of the respiratory chain.
The complexes of the respiratory chain are: Complex I: NADH dehydrogenase Complex II: Succinate dehydrogenase Complex III: cytochrome c reductase Complex IV: Cytochrome c oxidase
Fig. 3) Schematic representation of mitochondrial electron transport chain (93)
All complexes are formed by multiple subunits and contain proteins encoded by nuclear or mitochondrial DNA, except the Complex II which is entirely encoded by nuclear DNA. The first complex, the NADH:ubiquinone oxidoreductase, transfers
electrons from NADH (produced in the citric acid cycle) and passes them on to the first shuttle, Coenzyme Q (ubiquinone), a liposoluble cofactor located within the phospholipid bilayer of the IMM. Succinate dehydrogenase is another entrance site for electrons into the respiratory chain. In this case, electrons derived from the oxidation of succinate are passed through FAD to Coenzyme Q. Coenzyme Q is located between Complex I and Complex III and can accept only one electron, becoming a semiquinone radical, or two electrons acquiring the fully reduced ubiquinol form. Since ubiquinone is small in size and hydrophobic, it is freely diffusible in the lipid bilayer of the IMM and can act as a bridge between less mobile electron carriers in the same membrane. Coenzyme Q transfers the electrons previously transported in complex I and complex II from NADH and FADH2 to complex III;here, electrons are moved through several heme groups from the liposoluble shuttle ubiquinone to the water soluble shuttle which is cytochrome c and hence they will be conducted to complex IV. Cytochrome c eventually transfers electrons directly to oxygen, leading to H2O production.
Cytochrome c is a peripheral membrane protein of 12.5 KDa soluble in water and weakly associated with the external surface of IMM due to interaction with cardiolipin
(94). This protein transfers electrons between complexes III and IV. Like all
cytochromes it has a prosthetic group (heme group) and it is constituted by a tetrapyrrolic ring with an iron atom covalently bonded to the center. Cytochrome c allows the passage of electrons to oxygen through the oscillation of the iron from the ferric form Fe3+ to the ferrous form Fe2+. Oxygen is then reduced to water. This constitutes the bulk of oxygen consumption in all aerobic life. Electron transport through complexes I, III and IV induces the pumping of protons from the matrix to the IMS. Specifically, for every two electrons coming from one molecule of NADH, four H+ are moved by complex I, four by complex III, and two by complex IV. The respiratory complex II does not generate any proton movement (95). The chemical
mechanism which couples the proton flow with the phosphorylation is called Chemiosmotic Model and it was proposed by Peter Mitchell (96). In agreement with
this model the electrochemical energy contained in the difference of proton concentration and in the charge separation across the IMM leads to the synthesis of ATP when the proton flow reverses its direction and protons back into the matrix
through a proton channel associated to the ATP synthase. The mechanism of action of ATP synthase (called also as complex V) was elucidated by the Nobel Prizes Paul Boyer and John Walker. ATP synthase could be divided in two main components: Fo that allows the channelling of protons, and F1 that catalyses ATP phosphorylation. The Fo is embedded in the IMM, while the F1 resides in the mitochondrial matrix and is bound to the Fo through a γ subunit (which drives conformational changes) and a b2δ dimer (that holds Fo and F1 together). The protons flow from the intermembrane space to the matrix through the Fo inducing its rotation; the movement is transmitted from the γ subunit to the F1 causing conformational rearrangements. The Fo region consists of three main subunits a (ATP6 gene), b (ATP5F1 gene) and c (ATP5G1, ATP5G2 and ATP5G3 genes), and in humans six additional subunits d, e, f, g, F6 and 8. The F1 has a trimeric structure consisting of αβ dimers. The sequential changes are linked to the binding of substrates, phosphorylation and release of ATP. The three available dimers are never in the same conformational state and the conformational changes in one dimer drive rearrangements in the other (97). This region consists of different
protein subunits, α (ATP5A1 and ATPAF2 genes), β (ATP5B, ATPAF1 and C16orf7 genes), γ (ATP5C1gene), δ (ATP5D gene) and ε (ATP5E gene).
Fig.4) ATP synthase schematization (98)
It has been calculated that for the synthesis of one ATP molecule, 4 protons are required (99). Once synthetized, ATP can locate inside mitochondrial matrix or be
transported into the IMS by the nucleotide exchanger adenine nucleotide translocase (ANT) that passively exchanges ATP with ADP. Once in the IMS, ATP can freely pass the OMM through the voltage dependent anion channel (VDAC).
A recent our work by Bonora et al. suggested moreover that the c subunit of the Fo ATP synthase constitutes a critical component of the mitochondrial Permeability Transition Pore (mPTP) and that it is required for the MPT, mitochondrial fragmentation and cell death induced by oxidative stress or mitochondrial Ca2+ overload (100). However this part will be discussed more extensively in the thesis.
The concentration gradient of H+ ions that is created between the two sides of the membrane is equivalent to a proton motive force and this is defined mitochondrial transmembrane potential which corresponds to -150/-180 mV in the cytosol (101). This
is essential for many processes, including the production of ATP by ATP synthase and the accumulation of Ca2+. Dysfunction of the respiratory chain are associated with mitochondrial disorders and affect tissues that require a large amount of energy as the brain, heart and skeletal muscle (102). Mitochondrial DNA encodes thirteen
polypeptides, each of which is an integral subunit of respiratory chain complexes (103).
MITOCHONDRIA AND CELL FATE
Mitochondria are also important checkpoints of the apoptotic process, as they may release caspase cofactors (104).
Apoptosis, or programmed cell death, is a highly regulated cellular event that plays an extremely important role in the tissue homeostasis and in the development of multicellular organisms. Defects in regulation of apoptosis are often associated with pathological conditions such as neurodegenerative diseases, tumorigenesis, autoimmune syndromes and viral infections. Apoptosis occurs through two pathways: the extrinsic pathway and the intrinsic or mitochondrial mitochondrial pathway, and it requires the action of specific enzymes (caspases) and regulatory proteins (such as those of the family Bcl-2). From the biochemical point of view, apoptosis is a proteolytic event generated by the activation of a large family of proteases called caspases (cysteine aspartate-specific proteases), generally present in the cytoplasm in the form of inactive enzymes. The main player in the apoptotic activation process is
cytochrome c. The majority of cytochrome c is tightly bound to mitochondrial inner membrane, thanks to its electrostatic interactions with acidic phospholipids, but a small fraction probably exists loosely attached to inner mitochondrial membrane and available for mobilization. This protein is an irreplaceable component of the mitochondrial electron transport chain, shuttling electrons from complexes III to IV, and is thus essential to life: the disruption of its only gene is embryonic lethal (105).
Once released in the cytoplasm, this protein drives the assembly of a caspases activating complex together with Apaf-1 (apoptosis–protease activating factor 1) and caspase 9, the so-called ‘apoptosome’. Cytochrome c, once in the cytosol, induces the rearrangement and heptaoligomerization of Apaf-1: each of these complexes can recruit up to seven caspase molecules, leading to their proteolytic selfprocessing and consequent activation (106). Mitochondria contain several other proapoptotic,
intermembrane space-resident proteins, such as Smac/ DIABLO, HtrA2/Omi, AIF and EndoG. DIABLO (direct inhibitor of apoptosis-binding protein with a low isoelectric point) and HtrA2 (high temperature requirement protein A2) both have an Nterminal domain that can interact and inhibit IAPs (inhibitor of apoptosis proteins). Another event that accompanies apoptosis is the loss of mitochondrial membrane potential caused by the opening of the PTP. The opening may be triggered by several factors, such as an excessive accumulation of Ca2+, ATP depletion, oxidative stress, increased fatty acids or inorganic phosphate. PTP opening causes mitochondrial depolarization, followed immediately by mitochondria swelling, rupture of the OMM, release of cytochrome c and other apoptotic factors, caspases activation and cell death by apoptosis. It is interesting to underline the important role of Ca2+ in this event, demonstrating how the mitochondrial Ca2+ signal represents a complex signaling pathway that mitochondria can translate in different biological consequences.
Moreover, mitochondria are the most important source of intracellular reactive oxygen species and leak from the electron transfer chain is supposed to be the main route (107).
An unexpected pathway has emerged that involves p66Shc in mitochondrial reactive oxygen species production. Intriguingly, upon phosphorylation by PKCβ and peptidyl– prolyl cis/trans isomerase (Pin1) recognition, p66Shc translocates to mitochondria (108)
where it exerts its own oxidoreductase activity (109). As a consequence, p66shc directly
transport chain) and generates H2O2, leading to mPTP opening and in turn cell death
(109). The study of Ca2+ homeostasis in apoptotic process has highlighted some
important regulators of apoptosis, such as proteins of Bcl-2 family, which are located in compartments deeply involved in the intracellular Ca2+ levels regulation (mitochondria and endoplasmic reticulum (ER)). Indeed, Bcl-2 was found to be associated to OMM, ER and nucleus; there is also a cytoplasmic form of Bcl-2 (110).
The Bcl-2 protein family controls the intrinsic pathway of apoptosis. Proapoptotic Bax and Bak proteins exist as inactive monomers in viable cells with Bax localizing in the cytosol, loosely attached to membranes, and Bak residing in mitochondrial fraction. Upon apoptosis induction, Bax translocate to mitochondria where it homooligomerizes and inserts in the outer membrane; similarly, also Bak undergoes a conformational change, which induces its oligomerization at the outer mitochondrial membrane. Together, these events trigger OMM permeabilization, the crucial process mediating the release of intermembrane space-resident caspase cofactors into the cytoplasm (111).
Mitochondria also undergo a more ‘macroscopic’ remodelling of their shape during the programed cell death. Indeed, after apoptosis induction, mitochondria become largely fragmented, resulting in small, rounded and numerous organelles. This process occurs quite early in apoptotic cell death, soon after Bax/Bak oligomerization, but before caspase activation.
Mitochondrial and ER networks are also fundamental for the maintenance of cellular homeostasis and for the determination of cell fate under stress conditions (112). The
communication between the two organelles takes place via a zone of close contact between ER and mitochondria, called MAM (mitochondria associated membrane) (113)
involved in bioenergetics and cell survival.
THE CONCEPT OF Ca2+ AS A CELLULAR SIGNAL
In the past two decades, our understanding of how extracellular signals are conveyed to eukaryotic cells via an increase in intracellular Ca2+ concentration has widely expanded. It is today common knowledge that a variety of extracellular stimuli (ranging from the binding of hormones, neurotransmitters, growth factors to phenomena such as cell-cell interactions), through diverse mechanisms (e.g. receptors
that are themselves ion channels, or have an intrinsic enzymatic activity or are coupled to enzymatic effectors via G proteins) induce a rise in cytoplasmic Ca2+ concentration ([Ca2+]c) with defined amplitude and kinetics (114) (115).
In most eukaryotic cells, a large electrochemical gradient for Ca2+ exists across the plasma membrane. The transmembrane potential across the membrane is around 70 to 90 mV. The interior of the cell is the more negative, yet the cytoplasmic concentration of Ca2+ ([Ca2+]c) is less than one-ten thousandth of that in the extracellular milieu. There are also intracellular organelles, such as the endoplasmic reticulum (ER) and secretory granules, that contain one to ten thousand fold greater concentrations of Ca2+ than the cytoplasm.
Moreover, the technological advancements in probe design and imaging systems, by allowing the accurate measurement [Ca2+] at the single cell level, have revealed a marked asynchronicity in cell response and a high spatio-temporal complexity of the intracellular Ca2+ signal. We now know that the Ca2+ signal can be conveyed as repetitive [Ca2+]c spikes (commonly referred to as Ca2+ oscillations) (116) as well as
localised [Ca2+]c increases that may either be confined or gradually propagate to the rest of the cell (“Ca2+ waves”) (117) (118).
An extensive Ca2+-signalling toolkit is used to assemble signalling systems with very different spatial and temporal dynamics. Rapid highly localized Ca2+ spikes regulate fast responses, whereas slower responses are controlled by repetitive global Ca2+ transients or intracellular Ca2+ waves. The Ca2+ has a direct role in controlling the expression patterns of its signalling systems that are constantly being remodelled in both health and disease. During the on reaction, stimuli induce both the entry of external Ca2+ and the formation of second messengers that release internal Ca2+ that is stored within the endoplasmic reticulum or Golgi apparatus. Most of this Ca2+ is bound to buffers, whereas a small proportion binds to the effectors that activate various cellular processes. Calcium can enter cells across plasma membrane by any of several general classes of channels, including voltage-operated channels (VOC), second messenger-operated channels (SMOC), store-operated channels (SOC) and receptor-operated channels (ROC). VOCs are activated by membrane depolarization, and SMOCs are activated by any of a number of small messenger molecules, the most common being inositol phosphates, cyclic nucleotides, and lipid-derived messengers.
SOCs are activated by the deplation of intracellular Ca2+ store, and ROCs are activated by direct binding of a neurotransmitter or hormone agonist (119). During the off
reactions, Ca2+ leaves the effectors and buffers and is removed from the cell by various exchangers and pumps. The Na+/Ca2+ exchanger (NCX) and the plasma membrane Ca2+-ATPase (PMCA) extrude Ca2+ to the outside, whereas the sarco/endoplasmic reticulum Ca2+-ATPase (SERCA) pumps Ca2+ back into the ER. Mitochondria also have an active function during the recovery process in that they sequester Ca2+ rapidly through a uniporter, and release more slowly back into the cytosol to be dealt with by the SERCA and the PMCA. Cell survival is dependent on Ca2+ homeostasis, whereby the Ca2+ fluxes during the off reactions exactly match those during the on reaction.
mPTP: THE MITOCHONDRIAL PERMEABILITY TRANSITION PORE
The mPTP is a high-conductance channel located at the contact sites between the inner and outer mitochondrial membranes. This channel is responsible for the non-selective permeability state of the mitochondrial inner membrane. The transition to this state for small molecules is referred to as the MPT. Due to osmotic forces, MPT results in a massive influx of water into the mitochondrial matrix, eventually leading to the structural breakdown of the organelle (104) (120).
The molecular composition of the mPTP is not yet clear, but several proteins have been shown to be components that participate in mPTP activity, including VDAC (121),
ANT (122), the inorganic phosphate carrier (PiC) (123), peptidyl prolyl isomerase F (PPIF) (124) (125), the peripheral benzodiazepine receptor (TSPO) (126), hexokinase II
(HKII) (127) and several members of the Bcl-2 family. Both pro- and anti-apoptotic
BCL-2 family members, including BAX, BID, BCL-2 and BCL-XL (127)(128)(129) have
been shown to physically bind toand hence modulate the function of-PTPC components, indicating that the molecular machineries mediating MPT-driven and primary MOMP do not operate in a mutually exclusive manner.
Ca2+ ions, prooxidant and proapoptotic proteins, a decrease in the mitochondrial membrane potential, pH variations and adenine nucleotides all sensitize the opening of the pore (104)(130).
MPT resulting from mPTP opening is usually considered a transducer event in between Ca2+ or oxidative signal and different type of cell death (131)(132).
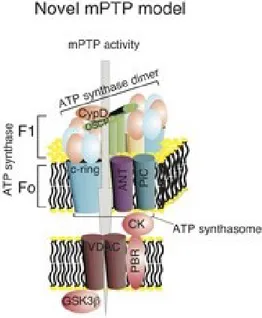
Recently, we suggested that, similar to PPIF, the c subunit of the Fo ATP synthase constitutes a critical component of the mPTP and that it is required for the MPT, mitochondrial fragmentation and cell death induced by oxidative stress or mitochondrial Ca2+ overload (100).
Fig. 5) Schematic representation of the different components of the mPTP complex.
Nonetheless several observations have suggested that mPTP is a component of the Ca2+ efflux mechanism (133) (134), proposing a physiological role for this ambiguous
complex. Unfortunately a different amount of studies have proposed the exact opposite
Results: TFEB and Ca
2+
homeostasis
INTRODUCTION
Ca2+ can be rapidly moved across biological membranes to generate spatially organized increased in cytosolic free ([Ca2+]c) (137) and for this is a versatile and
ubiquitous intracellular messenger (138). Most intracellular Ca2+ signals result from
opening of Ca2+ channels in the plasma membrane or endoplasmic reticulum (ER), and they are reversed by active transport across these membranes or by shuttling Ca2+ in mitochondria. The recent identification of regulated Ca2+ channels in lysosomes, notably the TPC and TRP channels, suggests that they too may contribute to cytosolic Ca2+ signalling. To reinforce this hypothesis, a recent work demonstrate how, in HEK cells, the amplitude of Ca2+ signals evoked by Ins(1,4,5)P3 increase after disruption of lysosomes and they suggest it’s due to the diminished ability of lysosomes to sequester Ca2+ from the ER (139).
As already mentioned, TFEB overexpression, transiently or in stable clones, comports a significant increased in lysosomes content, in their motility and in their localization closer to the plasma membrane. Moreover, has been shown how TFEB modulates lysosomal exocytosis by triggering cytoplasmic Ca2+ elevation through the cation-channel MCOLN1(40) (66).
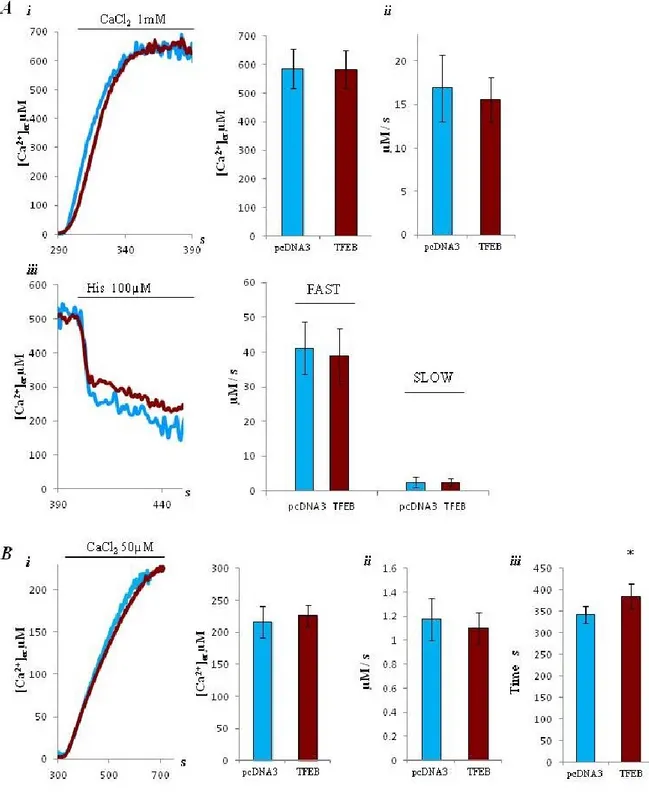
Starting from these observations present in literature, we decided to investigate the role of TFEB and the contribution of lysosomes in intracellular Ca2+ homeostasis more in depth. We investigated the effects of the transiently TFEB3xflag overexpression (TFEB samples), in comparison with a control (transfected with pcDNA3), on Ca2+ homeostasis in HeLa cells. We focused our attention on cytosolic and mitochondrial Ca2+ response after agonist stimulation, capacitative calcium entry and Ca2+ dynamics in endoplasmic reticulum.
RESULTS
The first step of this work was to confirm the cellular model shown from Sardiello et al. about the increase of lysosome number due to TFEB over expression (66). To verify
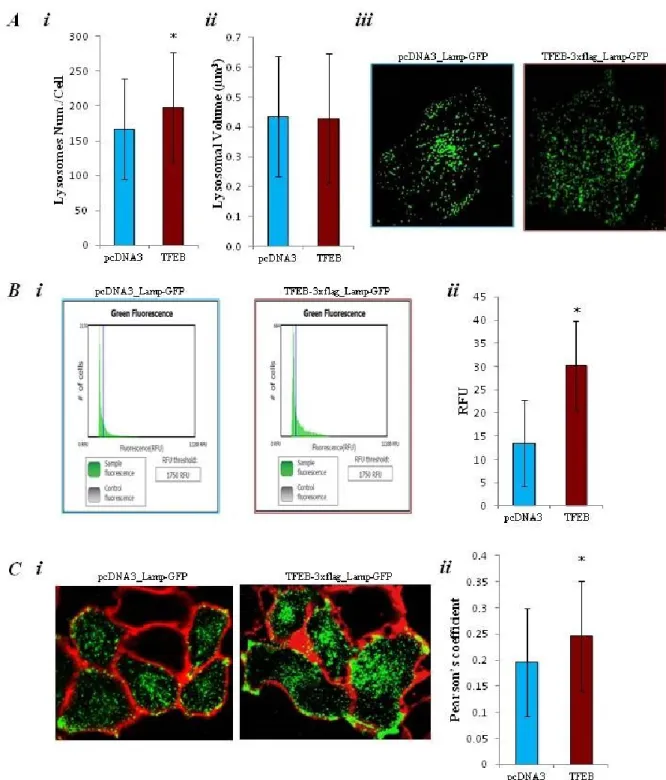
these data we made microscope analysis of lysosomal morphology. We used 3D imaging deconvolution in HeLa cells coexpressing TFEB-3xflag or pcDNA3 vector with the Lamp protein associated with the green fluorescence protein (Lamp-GFP). Lamp-GFP was both marker of lysosomes morphology and of transfection procedure quality. HeLa cells transfected with TFEB-3xflag vector present a significantly increased number of lysosomes respect to the control cells (167 ± 72 objects for control and 198 ± 78.9 objects for TFEB, n=55; *p<0.05), but it doesn’t influence the volume of the organelle (0.44 ± 0.2 µm3 and 0.43 ± 0.2 µm3, n=55; *p<0.05) Fig. 6) (A i, A ii, and Aiii). Previous data has been confirmed by the detection of the total levels of Lamp-GFP expression by measuring total GFP fluorescence using the Tali® Image-Based Cytometer. This approach allow measurement of lysosomal content by using a probe independent on lysosomal function. Specially it was observed a significant increased in total fluorescence per cell in TFEB-3xflag transfected HeLa respect the control (13.5 ± 9.3 RFU control vs 30.25 ± 9.6 RFU TFEB, n=4; *p<0.05)(B). As previous shown by Medina et al. (40), TFEB enhances plasma
membrane proximity of lysosomes. To confirm the probability to found lysosomes closer to PM in TFEB overexpressing cells respect to the control, we performed an experiment to see colocalization between lysosomes, marked with Lamp-GFP (green), and plasma membrane colored by the FM4-64fx colorant (red) (C i). The analysis of Pearson’s coefficient reveals a higher probability to found lysosomes close to the plasma membrane in HeLa cell transfected with TFEB-3xflag respect to the control (0.2 ± 0.1 R coefficient for control vs 0.25 ± 0.1 R coefficient for TFEB, n= 40; *p<0.05)(C ii).
Therefore, we confirmed that HeLa with a transiently overexpression of TFEB-3xflag shows an increased number of lysosomes and this entail a higher probability to found they nearer to the plasma membrane compared with the control.
Fig. 6) (A) Lysosomal network analysis. Analysis of the number (i) and of the volume (ii) of lysosomes and representative images (iii) of lysosomal structure in HeLa cells co-transfected with pcDNA3 (control) or with TFEB3xflag (TFEB), and the green fluorescent protein associated with lysosomal protein Lamp (Lamp-GFP). (B) Total Lamp-GFP fluorescence analysis. In HeLa cells co-transfected with pcDNA3 (control) or with TFEB3xflag (TFEB), and Lamp-GFP, was performed the analysis (ii) of the total green fluorescence per cells by the Tali® Image-Based Cytometer. In (i) is shown an example of instrument output.
(C) Colocalization between lysosomes and plasma membrane: Imaging of HeLa cells co-transfected with pcDNA3 (control) or with TFEB3xflag (TFEB) and Lamp-GFP to mark lysosomes (green); plasma membrane is colored with FM4-64fx colorant (red). In (i) are shown representative images of colocalization experiment. Histogram shows Pearson’s coefficient analysis to evaluate the probability of colocalization (ii).
Next we decided to measure cytosolic and mitochondrial Ca2+ response after different concentration of agonist.
The cytosolic Ca2+ signal elicited by histamine (100 μM) stimulation was investigated using cytosolic aequorin. Both in control and TFEB-3xflag transfected cells, stimulation causes a rapid rise in cytoplasmic [Ca2+]c, followed by a gradually declining sustained plateau. [Ca2+]c increase evoked by stimulation with histamine are similar in control and TFEB overexpressing (peak amplitude 2.55 ± 0.29 vs 2.48 ± 0.31 μM; n= 18) Fig. 7 (A). Then, we evaluated whether an increased number of lysosomes due to TFEB overexpression could affect Ca2+ handling in mitochondria, an important site for decoding cellular Ca2+ signals. In both condition, 100 μM histamine stimulation caused a large, rapid rise in [Ca2+]m, that returned to almost basal levels rapidly. However, the [Ca2+]m increase evoked by stimulation with histamine was similar in both condition (peak amplitude 107.39 ± 23.8 μM control, 98.38 ± 29.2 μM TFEB, n= 16) (B).
For both experiments, cytosolic and mitochondrial [Ca2+] measurement, there are no differences between control and TFEB overexpression, but there is for both the tendency to have lower peak amplitude of calcium in TFEB samples. Thus, we considered the possibility that an eventual small differences of [Ca2+]c could be hidden from the big amount of Ca2+ released from the ER after stimulation with 100 μM histamine, so we decided to check also with inferior concentration of agonist (10 µM and 5 µM). The use of lower amount of agonist doesn’t amplify the differences in [Ca2+]c between control and TFEB overexpressing cells (peak amplitude 1.55 ± 0.61 µM and 1,42 ± 0.56 µM, n= 16 for stimulation with 10 µM histamine (C i); peak amplitude 1.69 ± 0.15 µM and 1,70 ± 0.2 µM, n= 18 for stimulation with 5 µM histamine (C ii)). It has also been used an alternative method to verify the [Ca2+]c data through the fluorescent Ca2+ indicator Fura-2/AM with the lower amount of agonist considerate, but finally we concluded that there aren’t significantly differences in [Ca2+]c after stimulation with agonist, between control and TFEB overexpressing (peak amplitude 1.55 ± 0.54 ratio 340/380 nm and 1.48 ± 0.34 ratio 340/380 nm, n= 55) (D). Whereas a minor release of calcium from the ER can emphasize possible differences in [Ca2+]m, we checked also [Ca2+]m at the same conditions of less agonist, like for cytosolic Ca2+ measurements. Also in these cases we didn’t observe variation between
control and TFEB (peak amplitude 49.1 ± 12.25 µM and 46.9 ± 11.66 µM, n= 22 for stimulation with 10 µM histamine (E i); peak amplitude 28.94 ± 7.15 µM and 26.67 ± 8.94 µM, n= 26 for stimulation with 5 µM histamine (E ii)).
Fig. 7) (A-E) Calcium signalling characterization during lysosome content upregulation. (A&B) In HeLa control (pcDNA3) and HeLa overexpressing TFEB calcium release from ER were elicited by agonist stimulation, with 100 μM of Histamine, in cytosol, using wt- aequorin (A) and in mitochondria using mutate aequorine (B); (C&E) In HeLa control (pcDNA3) and HeLa overexpressing TFEB, calcium release from ER were elicited by agonist stimulation, respectively with 10 μM (i) or 5 μM (ii) of histamine, in cytosol, using wt- aequorin (C) and in mitochondria using mutate aequorine (E); (D) Cytosolic fluorescence were evaluated using the fluorescent Ca2+ indicator Fura-2/AM (iii) in pcDNA3 and TFEB cells in response to 5μM histamine.