Instrumentation, Mesure, Métrologie – n° 4/2018, 527-547
soft mobility planning for transport
energy-saving
Gattuso Domenico
1,*, Cassone Gian Carla
1, Malara Margherita
2 1. Dep DIIES Mediterranea, University of Reggio Calabria, Reggio Calabria, Italy 2. Dep PAU Mediterranea University of Reggio Calabria, Reggio Calabria, ItalyABSTRACT. The new generation of plans (Urban development plans, Sustainable Urban Transport Plans) in Italy, as well as in Europe and in other international contexts, tends to combine different actions such as urban regeneration, enhancement of areas of particular value, containing of negative traffic impacts, also through innovative technologies and measures, in particular in the ITS field (Intelligent Transportation Systems), soft mobility (pedestrian and cycle mobility, zero emission vehicles, shared mobility, green and clean public transport, etc.). The paper proposes an integrated approach to urban regeneration policy and soft mobility planning, aimed at significant transport energy-saving and environmental sustainability. The attention is focused on Transport models able to provide quantitative impact indicators of these integrated policies in terms of less energy consumption for the urban community. A specific application is proposed, for demonstration purposes, with reference to an ordinary day and a specific area of the Reggio Calabria city center, subject of a specific environmental upgrading and associated reorganization of the transport supply in soft mobility terms.
RÉSUMÉ. La nouvelle génération de plans (plans de développement urbain, plans de transport urbain durable) en Italie, ainsi qu'en Europe et dans d'autres contextes internationaux, tend à combiner différentes actions telles que la régénération urbaine, la mise en valeur de zones présentant une valeur particulière, contenant des impacts négatifs sur le trafic, également par le biais de technologies et de mesures innovantes, en particulier dans le domaine des STI (systèmes de transport intelligents), mobilité douce (mobilité des piétons et des cyclistes, véhicules zéro émission, mobilité partagée, transports publics écologiques et propres, etc.). Le document propose une approche intégrée de la politique de régénération urbaine et de la planification de la mobilité douce, visant à économiser l'énergie de transport important et la durabilité environnementale. L'attention est concentrée sur les modèles de transport capables de fournir des indicateurs d'impact quantitatifs de ces politiques intégrées en termes de moindre consommation d'énergie pour la communauté urbaine. Une application spécifique est proposée, à des fins de démonstration, en référence à une journée ordinaire et à une zone spécifique du centre-ville de Reggio Calabria, faisant l'objet d'une mise à niveau
environnementale spécifique et d'une réorganisation associée de l'offre de transport en termes de mobilité douce.
KEYWORDS: sustainability, urban regeneration, soft mobility, energy saving.
MOTS-CLÉS: durabilité, Régénération urbaine, mobilité douce, economie d'énergie.
DOI:10.3166/ I2M.17.527-547 © 2018 Lavoisier
1. Introduction
Urban regeneration policies are today also oriented towards environmental sustainability and energy consumption restraint. Vehicle mobility in cities is often one of the factors that most affect energy consumption. It may therefore be interesting to combine urban requalification actions with measures able to limit or remove energy consumption from vehicular traffic, in particular soft mobility measures (pedestrian areas, traffic calming, limited traffic areas, shared mobility). These policies can contribute to improve environmental quality and the public economy: reduction of polluting emissions (harmful gases, noise), improvement of people relations and social inclusion, accessibility to people with disabilities, green spaces expansion), energy savings.
This paper proposes an approach to the study of integrated policies of urban regeneration and soft mobility planning. After some references to the bibliography on the topic, some models of energy consumption estimation produced by vehicular flows on urban roads, are proposed, related to transport supply models. A proposal for environmental regeneration and soft mobility is then applied to the context of the city centre of Reggio Calabria.
Through a modelling approach, the impacts resulting from the regeneration project of a large area (waterfront) are simulated and the effects on energy consumption are estimated. The results are finally analyzed and commented.
The approach proposed in the paper appears innovative in the context of the sector literature as an interdisciplinary combination of two differentiated research fields (urban regeneration and soft mobility planning). Furthermore, an original model for the consumption estimation elaborated by the authors (LOGICA Laboratory) is presented.
2. Urban regeneration policies and soft mobility planning
The environmental quality of urban areas is strongly influenced by the widespread and difficult to control atmospheric pollution, substantially linked to the production and consumption of energy for:
• the energy needs of buildings; • support for production activities; • vehicular mobility.
An environmental requalification action also generally aims at the objective of atmospheric de-pollution of the urban environment and, therefore, at reducing energy consumption connected to urban mobility.
Soft mobility and its promotion in urban policies is related to the problem of emissions generated by vehicular traffic. Such a promotion is also based on the awareness that the increase of soft mobility would reduce private car traffic, particularly as regards short trips. The emerging attention to environmental concerns has been leading many cities towards the development of specific infrastructures and services dedicated to soft mobility. This should ensure highest levels of urban safety increasing occasions of public spaces regeneration. In the following section are presented general policies in terms of urban regeneration and soft mobility.
2.1. Literature guidelines on urban regeneration
Reconstruction, revitalisation, renewal, redevelopment and finally regeneration: these are terms that have outlined policies of urban degradation since the post-war period (Healey, 2013). Today the city is understood in a global sense, in which economic and environmental issues interact (Roberts and Sykes, 1999).
Over the year, in fact, the city has changed its constituent canons. The city, from a place of social life, has become a space to be used to take advantage of the infrastructure and services. This mentality has generated degradation, disorder, waste, lack of resources, poor services. It shaped to a new model of city that determined the processes of urban sprawling. Today the areas appear strongly unbalanced, denaturalized, defrauded by their characteristics (Panuccio et al., 2015). It is useful to define new models of urban development, in which cities play the dual role of policy takers and policy makers (Faludi, 1973). The European Union tries to push the city to recover its cultural and territorial origins in order to reorganize the available space, according to the new principles of logical and sustainable development (C. E. C., 1999).
The regeneration process must be based on a detailed analysis of the conditions of the urban area, must be related to the adaptation of social, physical, economic base and environmental conditions of the area, must ensure that the strategy is developed in agreement with the objectives of sustainable development, it must make the best possible use of human, economic and social resources and must seek to reach consensus through the participation and cooperation of all the actors involved in regeneration (Busacca, 2000; Moulaert et al, 2005; Carta, 2007). It should also indicate ways to integrate policies vertically and horizontally, monitor the outputs of the strategy and assess their impact. The urban regeneration approach applied to city waterfronts is today a key concept in literature (Bruttomesso, 1993); in particular for our application we will focus on the city of Reggio Calabria (Martinelli et al., 2014).
2.2. Policies for soft mobility in urban areas
Urban mobility has a greatest impact on cities’ energy consumption and pollution levels (Fallanca et al., 2011).
In 2014, around a quarter of the EU's total greenhouse gas emissions were produced by the transport sector. According to preliminary data, cars accounted for 44% of emissions in the sector, and heavy commercial vehicles and buses for 18% (Agenzia europea ambiente, 2016). For these reasons, sustainability is a key concern for modern transportation systems and so for urban planning. Modern urbanization is leading to the continuous expansion of urban areas, and the consequent strengthening of the commuting phenomenon that generates increased demands for mobility while creating congestion (Herrero, 2011). This increases the time spent travelling, the pollution and the predilection for private vehicles over public transport. These problems have resulted in a degradation of the quality of life of citizens. Private traffic induces many road accidents (in Italy there were 3.283 victims of road accidents in 2016, www.istat.com) which have a strong impact on public spending and contribute to increase operating costs and time spent travelling (Cheba et al., 2015).
The emerging attention to environment quality has been leading many cities towards the development of specific infrastructures and services dedicated to soft mobility (pedestrian and cycle mobility, zero emission vehicles, shared mobility, green and clean public transport, etc.). This should ensure highest levels of urban safety and increasing opportunities of public spaces regeneration (Borchiellini et al, 2017).
Generally, soft mobility and its promotion in urban policies is linked to the problem of emissions generated by vehicular traffic. Such a promotion is also based on the belief that the increase of soft mobility would reduce private car traffic, particularly as regards short trips.
Despite this increasing attention, the idea of a “network” for soft mobility has not yet been carried out. The supply of integrated facilities and services, being alternative to the car use, seems to have still difficult of accomplishment. By some years, the European Union is working on strategic policies to implement integrated models between public and private operators and to encourage new planning tools as Sustainable Urban Mobility Plans (SUMP). The design of an efficient and sustainable urban mobility system is a vital component of the new smart cities.
3. Models for estimation of energy consumption from urban traffic
Quantitative indicators should be used to assess the impacts of integrated urban regeneration and soft mobility policies (Mutani, 2018). Among others, it can be assumed that the reduction of energy consumption is a valid and effective indicator of the impact on the environment and, consequently, the effects on the levels of environmental pollution and on the quality of social life could be derived (Gulotta et
have general modelling tools (simulation models of transport networks and the interaction between mobility demand and supply) as well as specific models such as those designed to determine consumption energy in relation to attributes of the transport system such as vehicle flows, distances travelled by vehicles, infrastructure service levels (congestion, run-off speed).
3.1. Models of transport supply
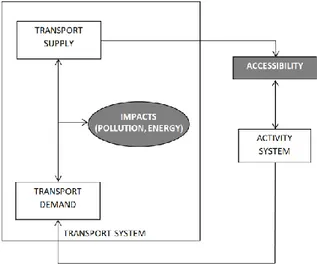
The analysis of urban mobility can be tackled by adopting transport models. Typical approaches focus the supply transport, the demand of users (origin, destination, modal choice, path) and interaction supply/demand (Cascetta, 2013). The Figure 1 shows a simplified scheme useful to frame the problem. Given a territory, it is possible to distinguish a transport system and a system of activities (socio-economic) that interact mutually. Within the transport system it is still possible to distinguish two macro-components, supply and demand; the interaction between these two components results in traffic flows on the transport network and in network performance (service levels, transport quality, external impacts). The activity system influences the transport demand and, in turn, undergoes the influence of the transport system structure, through accessibility. Indeed, a good transport system improves accessibility to the territory and reduces the negative impacts as pollution and energy consumption.
Figure 1. Transport/Land use interactions
An important element in mobility modelling is the transportation network, which includes the alternative routes from the different origin/destination couples. The construction of the network is usually divided into two steps:
− the drawing of a graph G (N, L) through the identification of nodes and road branches;
− the attribution to nodes and branches of specific cost functions (CF), typically functions able to represent the dependence of flows from congestion levels. You can therefore assume: N (N, L, CF).
The network is also important because it can be associated with the nodes and branches of the graph Performance Functions (PF) such as polluting emissions and energy consumption. Various models useful for estimating these social cost components are now available in the specialist literature. In the following we focus on the models of energy consumption.
3.2. Models of energy consumption
Several experimental models are proposed in the literature that express fuel consumption according to other measurable or calculable quantities; these can be: the vehicles-km travelled, the number of stops per unit of time, the total delay of vehicles per unit of time, the speed, etc. The most widespread fuel consumption patterns are those that express speed dependency; they are divided into instant models (which establish a ratio between consumption and instantaneous speed variations) and average speed models (which link consumption at average speed on a route).
Two variants are the basic driving models (D.M.E.M. = Drive-Mode Elemental Models) and the models of average speed (A.S.M = Average Speed Models).
The basic driving model (D.M.E.M.) groups the elements that contribute to the fuel consumption in relation to the vehicle's driving characteristics: acceleration phase, regime phase, slowdown phase. The running elements are assumed mutually independent, so that the total consumption is carried out as the sum of the consumption relative to the individual elements. The simplest form of D.M.E.M is the following (Torrieri, 1990):
(1) with:
C = fuel consumed by a vehicle; D = length of the trunk;
Tα = stop time (time delay due to stops);
N = number of stops;
k1 = fuel consumption rate per unit of distance at normal speed;
k3 = over-consumption of fuel during acceleration up to speed and deceleration
until stopping.
For distances greater than 1 km, a good correlation between fuel consumption and a single variable [18], the average speed v, on a given path is obtained:
per 10 ≤ ≤ 60 km/h (2) with:
C = fuel consumed by a vehicle per unit of distance (in lt/km);
=average speed measured on a given distance, also taking into account arrests and phases of various motion;
k1 = coefficient associated with the fuel consumed to overcome the rolling
resistance, and approximately proportional to the mass of the vehicle; k2 = coefficient associated with the duration of the trip.
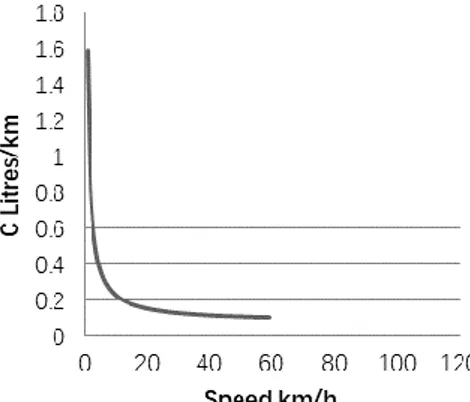
This model explains 70% of the variance in fuel consumption. However, it is limited to the speed range not exceeding 60 km/h (Figure 2). For higher values of speed the influence of aerodynamic drag begins to increase in importance.
Figure 2. Energy consumption versus average urban runoff speed (k1 = 0,085 lt/km; k2 = 1,5 lt/h)
The validity of the model has been extended (particularly in extra-urban areas) at higher speeds, according to the following specification (Luca, 1996):
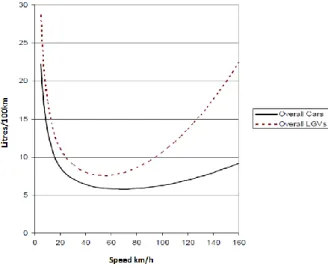
Figure 3 shows how fuel consumption varies with speed for Cars and LGVs (Large Goods Vehicle), using this kind of function.
Figure 3. Energy consumption versus average outflow speed (k1 = 0,438 lt/km; k2 = 0,06 lt/h; k3 = -0,0005 lt h/km2; k4 = 4,1·10-6 lt h2/km3)
Speed fluctuations can have a significant influence on consumption. The model can be further clarified with the introduction of a term that takes into account the various accelerated phases of motion:
(4) with:
= acceleration; = average speed;
(t) = instantaneous speed; = length of the route; = travel time.
For difficulty in measuring accelerations, the fourth rate can be expressed as a summation of the positive changes in kinetic energy:
(5) In Italy, the CNR (Department for Transport, 2014) has proposed a model still used today in practical applications. The model assumes (in terms of first
approximation) the variable energy consumption on a road trunk of unit length with the speed and slope according to the expression:
in lt/km (6) with:
p = road slope in%;
= average travel speed in km/h.
The (6) can also be rewritten in the form:
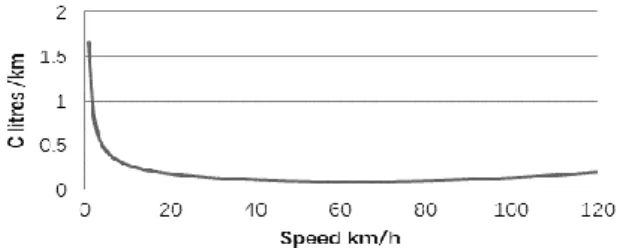
(7) Figure 4 shows the typical symmetrical parabolic trend, with a minimum consumption when = 60 km/h, having taken a flat road ( = 0).
Figure 4. Energy consumption versus average outflow speed (CNR model, k1 = 0,169 lt/km; k3 = - 0,0034 lt h/km2; k4 = 3·10-5 lt h2/km3)
Figure 5. Energy consumption versus average outflow speed (LM - Logica Model, k1 = 0,166 lt/km; k2 = 1,5 lt/h; k3 = -0,0034 lt h/km2; k4 = 3·10-5 lt h2/km3)
Finally, is proposed a model of energy consumption developed at LOGICA Laboratory of Mediterranea University of Reggio Calabria (Dep DIIES). The model assumes the additive expression (3), but it appears, in relation to the parameters, as an average expression among the previous functions.
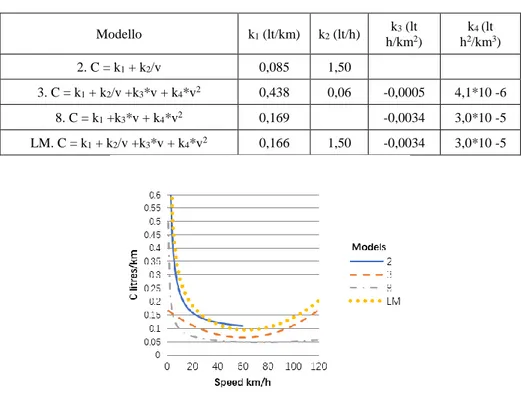
Table 1. Energy consumption estimation models
Modello k1 (lt/km) k2 (lt/h) k3 (lt h/km2) k4 (lt h2/km3) 2. C = k1 + k2/v 0,085 1,50 3. C = k1 + k2/v +k3*v + k4*v2 0,438 0,06 -0,0005 4,1*10 -6 8. C = k1 +k3*v + k4*v2 0,169 -0,0034 3,0*10 -5 LM. C = k1 + k2/v +k3*v + k4*v2 0,166 1,50 -0,0034 3,0*10 -5
Figure 6. Energy consumption versus traffic flow average speed by different models
Table 1 shows a synoptic overview of the proposed energy consumption estimation models. The estimation refers to a unit value of distance (1 km) and a single vehicle; on the network the calculation of consumption is carried out in relation to the lengths of the individual branches of traffic and of the vehicular flows in transit on the same by time bands. Flows that, of course, will depend on the offer model or the infrastructural endowment and the organization of the circulation. A comparison with the trend of the different functions is shown in Figure 6.
4. An environmental requalification and soft mobility proposal
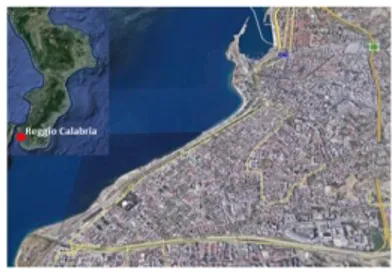
The modelling approach has been applied to a representative urban context, in particular to the urban centre of the city of Reggio Calabria, in Italy (Figure 5). The
city is located on the eastern shore of the Strait of Messina and has about 180 thousand inhabitants.
Figure 7. Reggio Calabria city center
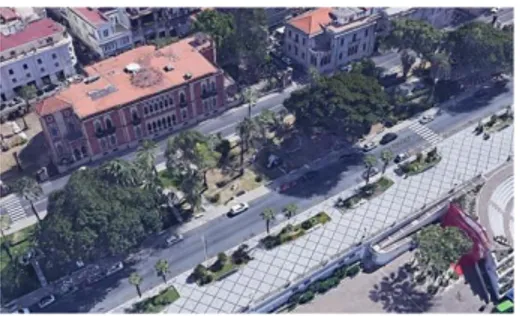
Figure 8. Reggio Calabria Lungomare (waterfront)
The advanced hypothesis is an environmental regeneration of the seafront, an important two-way road about 1.8 km long (called Lungomare; Figures 7 and 8) through a reorganization of the transport offer both in terms of infrastructure and technology and services, in order to also affect the demand for travel. The basic objective of this action is to expand the opportunities for the soft mobility components, minimizing the presence of private motorized vehicles and, at the same time, the harmful emissions of vehicles and energy costs.
Three types of measures are planned:
A. Closure of access to motorized vehicles and controlled access to service vehicles;
B. Specific accesses and internal routes for pedestrians, cycles, electric means of public transport, with particular attention to People with Reduced Mobility (PMR);
C. Advanced technologies (Intelligent Transportation Systems) according to Smart City advanced standards.
Figure 9. A stretch of the waterfront (via Marina)
Naturally, the new organizational structure of mobility in the area will be reflected on the rest of the City and, more particularly on the marginal areas, given that traditionally usable routes of North-South and Mare-Monti crossings by motorized vehicles will be inhibited. In particular, it will be necessary to estimate, in a logic of the plan, the exchangeable car parks at the extremes, also provided for in some municipal planning documents (Porto, Piazza del Popolo, areas adjacent to the railway stations), able to drain the vehicular traffic coming from the suburbs, favouring interchange with public or low-impact vehicles.
It should be noted that the demand for mobility will be subject to a substantial change in its characteristics, especially in terms of spatial and modal distribution.
4.1. Closure of access to motorized vehicles and provision of controlled access systems for service vehicles
In correspondence to various arteries, artificial barriers will be set up to prevent the transit of motorized private vehicles; the barriers will be of 2 types:
− Permanent rigid barriers;
− Removable barriers (Figure 8) by remote control, to allow access to particular categories of vehicles such as public transport shuttles, ambulances, service vehicles, law enforcement, garbage collection vehicles).
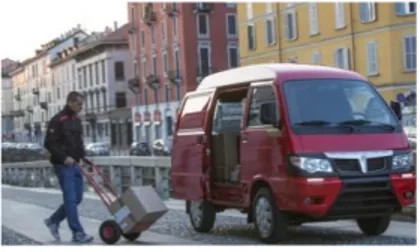
The goods distribution and pick-up service at the shops located at the edge of the area can only take place through manual-guided carriages (Figure 9); parking spaces reserved for goods vehicles on the adjacent road will be set up, and parking of the same vehicles within the area will not be allowed; the vehicles will be able to circulate only on pre-established routes and on limited time windows (for example in the early morning hours).
Figure 11. Freight distribution system
Also for taxi services, car sharing or tourist buses, special areas will be set up in the margins, the use of which will be appropriately regulated. The very short duration (for passenger loading / unloading) and that of vehicles with a lower environmental impact will be privileged.
At the entrances, bike-sharing parking lots will be set up (Figure 10) and solar-powered battery charging stations for electric vehicles (bikes, shuttle buses, service vehicles). The regulation of use will be aimed at favouring the frequent turnover of the means among the users and a rewarding combination for those who leave the car in the parking lots of interchange (reduced parking rate + ecological vehicle).
Figure 12. Bike sharing
4.2. Specific accesses and internal routes for soft mobility The routes inside the area are divided into two types:
A. a marginal viability for use by public transport and service vehicles, consisting of the lane adjacent to the buildings of the current viale Matteotti and the lane of long coastline for the use of service vehicles authorized. On the first the vehicles will be able to transit in the South-North direction,
facilitating the operations of contact with the activities on the margins, in safety; an extension of the sidewalk is foreseen in order to make the circulation of substantial and bidirectional pedestrian flows possible, but also the stationing of people in correspondence with buildings or public services; on the long coast route, only the occasional circulation of service vehicles, in the North-South direction, will be allowed;
B. an internal road system dedicated to the various components of soft mobility, largely surrounded by greenery: bi-directional cycle path; paths for running or running; pedestrian promenade, equipped and reserved paths for children, green paths for slow walking, "tourist" routes for the protected visit to prestigious places and / or botanical observation. Adjacent to the paths will be distributed themed pitches (areas with sunny benches in the shade, social and cultural meeting areas, squares for art exhibitions / shows / games, widgets with fountains, toilets, kiosks, totems and information panels, silent areas for reading, study, internet connection, sports activities and outdoor gym, etc.). The basic model is the Valencia City Park, the Jardì de Turia. Grassy paths will be preferred, in clay or pavement in light pavement, and the green surfaces will be far dominant. The routes will be equipped with appropriate information signs, appropriately distributed.
4.3. ITS technologies, according to smart city standards
In order to encourage the use of the spaces of the new urban Park and absorb the effects induced by the foreclosure to circulation by motorized private vehicles, some specific measures are envisaged, partly technological and partly organizational. Among the new technologies, are included:
− a pair of medium-capacity ecological buses that will shuttle between the South and North terminals, along the lanes dedicated to service vehicles; the lap times will be contained in half an hour thus ensuring a good frequency (4 trips / hour);
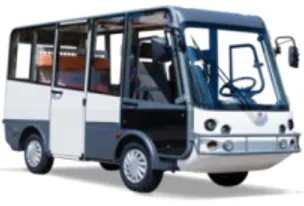
− a dozen environmentally friendly vehicles for transporting people and goods and for additional services (Figure 6);
− 4 bike-sharing stations on the edge of the area, with the commitment of 120 pedal assisted bikes with related management accessories;
− access control systems (fixed, mobile, concealed bollards, video surveillance systems and sensors);
− Wi-Fi network with sensors installed on light poles, in order to guarantee network coverage over the entire area;
− totems and intelligent information panels, which can also be used by blind people, who are also able to communicate with transport operators, assistance and rescue centres.
Figure 13. Ecological vehicles for local service
The impacts of the project on the mobility system will be multiple; positive effects are expected, in particular:
− on soft mobility (pedestrians, people with disabilities, cyclists, children, tourists), in terms of facilities and opportunities for moving and enjoying urban spaces;
− on the environment, with the reduction of atmospheric and acoustic pollution on a large urban area (with consequent contraction of related negative health effects such as allergies, dermatoses, respiratory diseases, etc.) and in terms of widening green spaces for public use;
− on road safety, with a significant reduction in the risk of accidents caused by motorized vehicles;
− on safety in terms of civil protection against catastrophic natural or anthropic events, being able to assume the area as a host function in case of rapid people evacuation need;
− on the quality of social life, with new opportunities for relationships and expression by citizens;
− on the image of the area, with a strong ecological, cultural, recreational and tourist impact;
− on the urban economy, with positive effects in terms of tourist flows recalled, associated cultural and commercial activities, employment opportunities;
− on energy costs, saving urban economic costs.
5. Scenario simulations and impact assessment on energy consumption
Some evaluations about effects on energy consumption related to the mobility system have been deduced, through a simulation model (Figure 14), in relation to the knowledge of traffic volumes and stops, the structure of the road network in the current and future scenario, and experiences consolidated in other urban contexts.
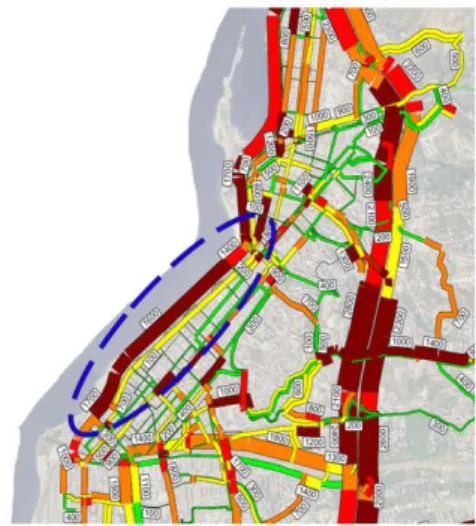
The analysis concerns the city center. The dotted area corresponds to the new urban park (waterfront) of the city.
There is no doubt that, compared to the current State in the Project Scenario, the availability of approximately 3.2 km of roads, about 500 parking stalls, and the possibility of transit on the North-South route will be blocked for motorized citizens. as well as that of penetration from the west into the city centre, on the sea-mount route. Considering an average time to stop the order of 2 hours on the sea network, in the morning rush hour (8:00-12:00), it is estimated that about one thousand accesses to the parking lot should be less. The most intense traffic flows are today on the via Marina Bassa (Lungomare Falcomatà, two-lane) route in the North-South direction, which reach peaks of 1600 veh/h between 7:30 am and 8:30 am; in the opposite direction (via Marina Alta, or viale Matteotti), with only one lane of transit, traffic volumes are less consistent, reaching around 1500 veh/h. It is worth noting that traffic flows in via Marina account for 70% of the exchange flows between the centre and peripheral areas and only 30% is represented by crossing traffic.
Figure 14. Reggio Calabria city centre, urban flows(vehicles/h). Modelling example of traffic
However, the functional reorganization of the project area will not result in a simple transfer of flows and parking to other arterial roads, given the limited amount of road and residual capacity; if this is the case, unwanted congestive effects or traffic crisis phenomena may occur in the city centre. Instead, after a transition phase, a new balance of traffic flows is predictable, determined by behavioural changes induced on drivers. In fact, we expect a broad use of intermodal mobility, or the spread of Dial & Ride mobility; users coming from the suburbs in the car should leave their vehicle in an interchange car park and continue the journey to the centre
by public transport, by bike or on foot. The distances to be covered are few hundred meters, which in the big European cities are usual. Naturally, it is necessary to have adequate interchange parking spaces both in terms of space distribution and capacity; the parking facilities, in relation to projects in advanced stages of definition, appear to be sufficient. Dial& Ride parking and parking-bike sharing fares are considered in order to facilitate and encourage modal interchange.
The analysis was carried out through a calculation of energy consumption on the primary road network, adopting the Logica (LM) model, in particular a set of roads able to compose alternative routes to the waterfront roads; some urban roads and longer but less congested routes through the urban belt (Via Libertà, Tangenziale, Calopinace). Consumption was calculated on the three representative hours of an ordinary day: a rush hour (Chp), an off-peak hour (Chd), a night hour Chn). The total
daily consumption on the analysed network was carried out, assuming 6 rush hours, 10 off-peak hours and 8 hours at night:
Table 2-4 show the results of simulations and derived consumption.
Table 2. Simulation of rush hour
Scenario v (km/h) F (cars eq/h) L (km) C (lt/km) Ctot (lt)
Via Aschenez Present 20 800 1,89 0,19 279,0
Future 15 1100 0,22 445,8 Via Torrione Present 20 600 1,79 0,19 198,1 Future 15 900 0,22 356,2
Viale Matteotti Present 20 1500 1,61 0,19 446,2
Future - - - - Lungomare Falcomatà Present 20 1600 1,60 0,19 473,6 Future - - - - Tangenziale A3 S-N Present 60 2400 2,56 0,10 584,1 Future 50 2650 0,10 685,7 Tangenziale A3 N-S Present 60 2100 2,56 0,10 510,3 Future 50 2350 0,10 607,1 Viale della Libertà E-W Present 30 800 0,69 0,14 77,8 Future 30 1050 0,14 102,2
Libertà W-E Future 30 1050 0,14 102,2 Lungo Argine Calopinace SX Present 50 1200 1,82 0,10 220,6 Future 40 1450 0,12 304,8 Lungo Argine Calopinace DX Present 50 1200 1,82 0,10 220,6 Future 40 1450 0,12 304,8
It can be observed that:
− the overall energy consumption decreases, even slightly (-3,0 %);
− the substantial before/after equivalence is due to the fact that a part of the eliminated traffic from the waterfront, net of new soft mobility, is drained by alternative routes, reducing service levels, and average flow speeds; − other external effects (accident rate, pollution and noise, landscape impact)
are reasonably positive;
− the new waterfront set-up is therefore a positive choice, revealing a prestigious urban park on a corridor about 1.6 km long and about 75 m wide, connected to other green spaces such as the Villa Comunale.
Table 3. Simulation of off-peak hour
Scenario v (km/h) F (cars eq/h) L (km) C (lt/km) Ctot (lt) Via Aschenez Present 35 320 1,89 0,13 76,4 Future 25 520 0,16 156,6 Via Torrione Present 35 240 1,79 0,13 54,2 Future 25 440 0,16 125,5 Viale Matteotti Present 35 600 1,61 0,13 122,2 Future - - - - Lungomare Falcomatà Present 35 640 1,60 0,13 129,6 Future - - - - Tangenziale A3 S-N Present 80 960 2,56 0,11 257,6 Future 60 1060 0,10 258,0 Tangenziale A3 N-S Present 80 840 2,56 0,11 225,1 Future 60 940 0,10 228,4
Libertà E-W Future 40 675 0,12 53,8 Viale della Libertà W-E Present 40 500 0,69 0,12 39,8 Future 40 675 0,12 53,8 Lungo Argine Calopinace SX Present 60 700 1,82 0,10 121,0 Future 55 920 0,10 162,5 Lungo Argine Calopinace DX Present 60 720 1,82 0,10 124,5 Future 55 930 0,10 164,2
Table 4. Simulation night hour
Scenario v (km/h) F (cars eq/h) L (km) C (lt/km) Ctot (lt) Via Aschenez Present 40 80 1,89 0,12 17,4 Future 40 123 0,12 26,8
Via Torrione Present 40 60 1,79 0,12 12,4
Future 40 113 0,12 23,3
Viale Matteotti Present 50 150 1,61 0,10 24,4
Future 0 0 0,00 0,0 Lungomare Falcomatà Present 50 160 1,60 0,10 25,9 Future 0 0 0,00 0,0 Tangenziale A3 S-N Present 90 240 2,56 0,12 73,6 Future 80 265 0,10 71,1 Tangenziale A3 N-S Present 90 210 2,56 0,12 64,3 Future 80 235 0,10 63,0 Viale della Libertà E-W Present 50 300 0,69 0,10 20,9 Future 50 350 0,10 24,4 Viale della Libertà W-E Present 50 300 0,69 0,10 20,9 Future 30 345 0,14 33,6 Lungo Argine Calopinace SX Present 70 180 1,82 0,10 31,6 Future 70 240 0,10 42,1 Lungo Argine Calopinace DX Present 70 180 1,82 0,10 31,6 Future 70 240 0,10 42,1
6. Conclusions
The analysis of integrated policies of urban regeneration and soft mobility planning can be a useful approach to the study concerning new urban spaces design. The focus of the paper is the estimation of traffic energy consumption following an environmental requalification and soft mobility project in the context of an urban centre; some models are proposed, related to transport supply models.
Vehicle mobility in cities is often one of the factors that most affect energy consumption. It may therefore be interesting to combine urban regeneration actions with measures limiting energy consumption from vehicular traffic, in particular soft mobility. These policies can contribute to improve environmental quality and public economy: reduction of polluting emissions and noise, social inclusion, accessibility to people having disabilities, green expansion, energy savings. Through a modelling approach, the impacts resulting from a regeneration project of the Reggio Calabria waterfront are simulated and the effects on energy consumption are estimated. The results are finally analysed and commented.
References
Agenzia europea ambiente. (2016). I trasporti in Europa: statistiche e tendenze.
Borchiellini R., Corgnati S. P., Becchio C., Delmastro C., Bottero M. C., Dell’Anna F., Acquaviva A., Bottaccioli L., Patti E., Bompard E., Pons E., Estebsari A., Verda V., Santarelli M., Leone P., Lanzini A. (2017). The energy center initiative at politecnico di torino: Practical experiences on energy efficiency measures in the municipality of Torino.
International Journal of Heat and Technology, Vol. 35, Special Issue 1, pp. S196-S204.
https://doi.org/10.18280/ijht.35Sp0128
Bruttomesso R. (1993). Waterfronts: A new frontier for cities on Water. Venice.
Busacca P. Il racconto del territorio. Gangemi Editori, Roma, 2000. ISBN13: 9788849201093 C. E. C. (1999). European spatial development perspective ESDP. Towards balanced and sustainable development of the territory of the European Union, Office for official publications of the European Communities, Luxembourg.
Carta M. (2007). Città Creative: un Manifesto Per L'azione Progettuale. Creative City. Dynamics, Innovations, Actions, Barcelona, List.
Cascetta E. (2013). Transportation Systems Engineering: Theory and Methods. Springer US, London. https://doi.org/10.1007/978-1-4757-6873-2
Cheba K., Kiba-Janiak M., Saniuk S., Witkowski K. (2015). Modelling transportation preferences of urban residents: The case of Poland. 1st International Summit on Internet
of Things, Vol. 151, pp. 78-83. https://doi.org/10.1007/978-3-319-19743-2_12
Department for Transport. Values of Time and Vehicle Operating Costs. Unit 3.5.6, Transport Analysis Guidance TAG, 2014.
Fallanca C., Critelli G., Taccone A., Umbro M. (2011). Mobility and sustainable urban redevelopment, sustainability, quality and safety in transport and logistics systems. Franco Angeli, Milan.
Faludi A. (1973). Planning theory. Pergamon Press, Oxford. https://doi.org/10.1016/C2009-0-10937-6
Gulotta T. M., Guarino F., Mistretta M., Cellura M., Lorenzini G. (2018). Introducing exergy analysis in life cycle assessment: A case study. Mathematical Modelling of Engineering
Problems, Vol. 5, No. 3, pp. 139-145. https://doi.org/10.18280/mmep.050302
Healey P. (2013). City regions and place development. The Futures of the City Region, pp. 43-56. https://doi.org/10.4324/9781315874968
Herrero L. M. J. (2011). Transport and mobility: The keys to sustainability. Lychnos, Vol. 4, No. 4, pp. 40-45.
Luca D. M. (1996). Tecnica ed Economia dei Trasporti. Ed. CUEN, Napoli, 1989. ISBN: 8871461029.
Martinelli F., Barillà S., Sarlo A. (2014). Daycare services in the municipality of Reggio Calabria the impact of the crisis on a long-standing deficit. Cost Action IS1102, 7, pp. 9-22. https://doi.org/10.12833/COSTIS1102WP07
Moulaert F., Martinelli F., Swyngedouw E., Gonzalez S. (2005). Towards alternative model(s) of local innovation. Urban Studies, Vol. 42, No. 11, pp. 1969-1990. https://doi.org/10.1080=00420980500279893
Mutani G., Manuela Fontanive M., Arboit M. E. (2018). Energy-use modelling for residential buildings in the metropolitan area of gran Mendoza (AR). Italian Journal of Engineering
Science: Tecnica Italiana, Vol. 61+1, No. 2, pp. 74-82. https://doi.org/10.18280/IJES.620104
Panuccio P., Amodeo L., D’Agostino P., Lamari D. (2015). Urban regeneration and smart city according to EU strategies: An urban distribution center in city logistics. Urban Transport
XXI, pp 313-324. https://doi.org/10.2495/UT150251
Roberts P., Sykes H., Granger R. (2017). Urban regeneration. SAGE.
http://dx.doi.org/10.4135/9781473921788