SAPIENZA UNIVERSITY OF ROME
SCHOOL OF BIOLOGY AND MOLECULAR MEDICINE
PhD THESIS
“NEXT GENERATION SEQUENCING APPROACHES IN RARE DISEASES:
THE STUDY OF FOUR DIFFERENT FAMILIES”
Human Biology and Medical Genetics PhD course
Medical Genetics curriculum
XXXI cycle
Coordinator: Prof. Antonio Pizzuti
Tutor: Dr. Viviana Caputo
Candidate: Maria Luce Genovesi
Academic Year 2017-2018
INDEX
ABSTRACT
p. 3
1. INTRODUCTION p. 4
1.1 Mendelian disorders and genetic tests p. 4 1.2 Next generation sequencing (NGS) technology p. 6 1.3 Bioinformatic pipeline p. 10 1.4 Gene identification approaches p. 12
1.5 NGS approaches p. 13
1.5.1 Targeted sequencing (TS) p. 13 1.5.2 Clinical exome sequencing (CES) p. 15 1.5.3 Whole exome sequencing (WES) p. 15 1.5.4 Whole genome sequencing (WGS) p. 18 1.6 NGS approaches and their diagnostic rate p. 19
1.7 NGS guidelines p. 20
1.7.1 The American College of Medical Genetics and Genomics (ACMG) guidelines p. 20 1.7.2 The Italian Society of Human Genetics (SIGU) guidelines p. 22
2. AIM OF THE STUDY p. 25
3. MATERIALS AND METHODS p. 26
3.1 Subjects selection p. 26
3.2 DNA extraction p. 27
3.3 NGS techniques: whole exome and clinical exome sequencing p. 28
3.4 Data analysis p. 29
3.5 Selection of candidate variants (filtering and prioritization) p. 31
3.6 Variants validation p. 32
4. RESULTS p. 35
4.1 Family A p. 35
4.2 Family B p. 41
4.3 Family C p. 45
4.4 Family D p. 49
4.4.1 Modeling of the nucleotidyltransferase domain of FKTN p. 52
5. DISCUSSION p. 55 5.1 Family A p. 56 5.2 Family B p. 60 5.3 Families C and D p. 63 6. CONCLUSIONS p. 70 BIBLIOGRAPHY p. 71 SITOGRAPHY p. 84
ABSTRACT
The main purpose of this PhD project was to study the molecular bases of rare Mendelian diseases with Next Generation Sequencing approaches.
To this aim, we enrolled at Umberto I General Hospital and Sapienza University of Rome four different families with a phenotype with a supposed genetic cause, in order to find the causative gene/genes. Clinical exome sequencing or whole exome sequencing was performed on selected subjects of each family. The supposed mode of inheritance defined the selection and the number of individuals to sequence, as well as the analytical approach to use. Sequencing data were analysed through a dedicated bioinformatic pipeline; variants were then filtered and prioritized according to several parameters, specific for each case.
The selected variant/variants were validated through Sanger sequencing on the proband and on the other family members, to study their segregation in the family.
The functional link between the candidate variant/variants and the phenotype was investigated, retrieving information from literature and online resources.
In the four studied families the different approaches allowed us to identify the molecular causes of each disorder, with consequences on diagnosis, prognosis and genetic counselling.
1. INTRODUCTION
1.1 Mendelian disorders and genetic tests
Mendelian or monogenic diseases are caused by mutation in one gene. For this kind of disorders alternative genotypes fall into distinct and discrete phenotypes (Antonarakis and Beckmann, 2006). They are usually inherited in one of several patterns, depending on the location of the gene and whether one or two normal copies of the gene are needed for the disease phenotype to manifest: the expression of the mutated allele with respect to the normal one can be dominant, co-dominant or recessive; the five basic modes of inheritance for single-gene diseases are autosomal dominant, autosomal recessive, X-linked dominant, X-linked recessive and mitochondrial. To date, Mendelian diseases are estimated to be about 7,000 (Boycott et al., 2017). Clinically recognized Mendelian phenotypes compose a substantial fraction (~0.4% of live births) of known human diseases. If all congenital anomalies are included, ~8% of live births have a genetic disorder recognizable by early adulthood (Chong et al., 2015).
Of approximately ~19,000 protein-coding genes predicted to exist in the human genome: variants causing Mendelian phenotypes have been identified in ~2,937 (~15.5%); genes underlying ~643 Mendelian phenotypes (~3.38%) have been mapped but not yet identified; loss of function variants in up to ~30% of genes (~5,960) could result in embryonic lethality in humans; for a minimum of ~52% of genes (~10,330), the impact in humans has not yet been determined. Collectively, ~16,063 genes remain candidates for Mendelian phenotypes (Chong et al., 2015; Figure 1).
Figure 1. Relationship between human protein-coding genes and Mendelian phenotypes (Chong et al., 2015).
Causative genetic variants can range in size from substitution, deletion or duplication of a single base pair to structural variants and to altered copy numbers of an entire chromosome (aneuploidy); in some cases, the penetrance of the disorder can be incomplete and the expressivity of individual
features can be variable. A proportion of variability in genetic diseases can also be attributed to locus heterogeneity and allelic heterogeneity; other important sources of variability include genetic variants at one or more other loci (modifiers) and environmental factors (Wright et al., 2018). In the past, the identification of Mendelian disease genes was carried out by linkage mapping and Sanger sequencing of candidate genes, which were selected because they reminded of genes associated with similar diseases, because the predicted protein function seemed relevant to the physiology of the disease or because a positional mapping approach pointed to these genes in a genomic region (Gilissen et al., 2012).
Traditionally, there are two kinds of clinical genetic tests: high-resolution molecular single gene tests by Sanger sequencing and low-resolution genome-wide cytogenetic tests. The first ones are useful for the diagnosis of that conditions caused by just one or few genes, as cystic fibrosis or Duchenne muscular dystrophy; the second kind of tests can be used to diagnose aneuploidies and chromosome rearrangements (G-banded karyotype) or smaller structural variants (microarray) (Wright et al., 2018).
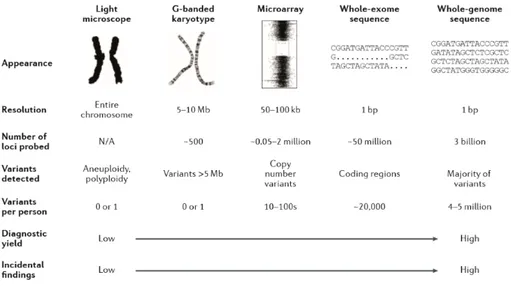
Next generation sequencing (NGS) has revolutionized medical genetics through the high-throughput massively parallel sequencing (Figure 2): it is accelerating the research about rare-genetic diseases and it is facilitating clinical diagnosis and personalized medicine. In the last decade the capacity of NGS technology has increased, leading a throughput several orders of magnitude higher than Sanger sequencing (Goodwin et al., 2016), and its costs have come down considerably, facilitating the translation of sequencing from a research technology to a clinical tool.
Figure 2. Genome-wide assays used in clinical genetics: from traditional methods to whole genome sequencing.
As the resolution of the test increases, the number of detectable variants, the diagnostic yield and likelihood of detecting incidental findings and variants of uncertain clinical significance increase too (Wright et al., 2018).
For a long time, a clinician first exhausted a battery of medical tests and then he turned to genetic testing only if the previous ones did not yield a definitive diagnosis or if there was a need to assess recurrence risk. Even positive genetic test results did not often change management of the patients. However, the introduction of NGS technology in the clinics and the increased knowledge in genetics let the clinicians begin altering the placement of genetic testing in the evaluation of their patients, saving time and money in identifying an aetiology.
1.2 Next generation sequencing (NGS) technology
Traditionally, NGS experiments have been performed using short-read sequencing (SRS) that produces reads from 100 to 400 bp in length, depending on the technology. SRS is based on library preparation by random fragmentation of input DNA, adapter ligation, amplification and massively parallel sequencing of adapter-ligated fragments (Caspar et al., 2018).
There are two categories of short-read sequencing approaches: sequencing by ligation (SBL) and sequencing by synthesis (SBS). In SBL approaches (SOLiD and Complete Genomics), a labelled probe and anchor sequences hybridize to a DNA fragment and are ligated to an adjacent oligonucleotide through a DNA ligase. After ligation, the template is imaged and the emission spectrum of the fluorophore indicates which base or bases are complementary to a specific position inside the probe. The removal of the anchor–probe complex allows to regenerate the ligation site: a new cycle can begin (Goodwin et al., 2016; Figure 3).
SBS approaches can be classified either as cyclic reversible termination (CRT) or as single-nucleotide addition (SNA). In these approaches a polymerase incorporates a single-nucleotide into an elongating strand producing a signal, such as a fluorophore or a change in ionic concentration. CRT approaches (Illumina, Qiagen; Figure 4) use similar terminator molecules to those used in Sanger sequencing, in which the ribose 3ʹ -OH group is blocked, preventing elongation. These molecules are individually labelled. After the incorporation of a single dNTP, unbound dNTPs are removed and the surface is imaged to identify which dNTP was incorporated at each cluster. The fluorophore and blocking group can then be removed and a new cycle can begin (Goodwin et al., 2016).
Figure 4. Sequencing by synthesis (cyclic reversible termination approaches): Illumina (a) and Qiagen (b) (Goodwin et al., 2016).
The Illumina technology reaches its maximum throughput with the HiSeq X Ten System, a set of 10 HiSeq X platforms, which generates tens of thousands of high-quality and high-coverage genome sequences, breaking the $1000 barrier for 30× coverage of a human genome.
SNA approaches (454, Ion Torrent; Figure 5) rely on a single signal to mark the incorporation of a dNTP into an elongating strand. For this reason, each nucleotide has to be added individually. The 454 technology is based on pyrosequencing: when a dNTP is incorporated, an enzymatic cascade occurs, resulting in a bioluminescence signal; the Ion Torrent platform detects a change in pH: when a dNTP is incorporated, H+ ions are released (Goodwin et al., 2016).
Figure 5. Sequencing by synthesis (single-nucleotide addition approaches): 454 pyrosequencing (a) and Ion Torrent (b) (Goodwin et al., 2016).
In both SBL and SBS approaches DNA is clonally amplified on a solid surface: thousands of identical copies of a DNA fragment in a defined area allow the signal to be distinguished from background noise. Different strategies can be used to generate clonal template populations: emulsion PCR [454 (Roche), SOLiD (Thermo Fisher), GeneReader (Qiagen), Ion Torrent (Thermo Fisher)], solid-phase bridge amplification (Illumina), in-solution DNA nanoball generation [Complete Genomics (BGI)]. Millions of individual SBL or SBS reaction centres are created, each with its own clonal DNA template and, in this way, millions of DNA molecules are sequenced in parallel (Goodwin et al., 2016).
The main advantages of SRS are high-throughput, low per base cost and low raw-read error rate; the main disadvantage is the short-read length, which leads to reads alignment difficulties, that can cause misalignments, false-positive and false-negative variant calling (Caspar et al., 2018).
These limitations can be overcome using long-read sequencing (LRS) or third-generation sequencing, which is a single-molecule sequencing PCR-free: the long reads facilitate unambiguous alignment to a reference genome through their increased ability to span large, complex, repetitive or homologous regions. However, LRS is not yet routinely applied due to its significantly lower throughput and higher per sample sequencing cost; furthermore, it has a high raw error rate of ~10%. These errors can be minimized by increasing read depth and reading the template multiple times (Caspar et al., 2018).
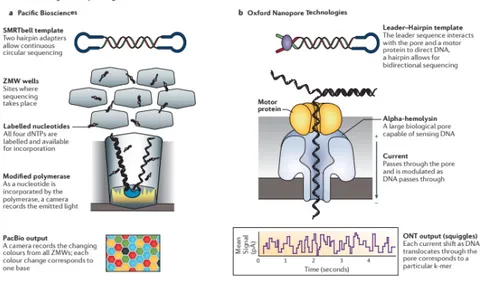
There are two main long-read technologies: single-molecule real-time sequencing approaches [PacBio and Oxford Nanopore Technologies (ONT); Figure 6] and synthetic approaches (Illumina synthetic long-read sequencing platform, 10X Genomics emulsion-based system; Figure 7), that
construct in silico long reads based on short-read technologies. Pacific Biosciences (PacBio) instrument has a flow cell with thousands of picolitre wells with transparent bottoms, called zero-mode waveguides (ZMW), in which there is the DNA polymerase. There is a single circular molecule template per well and when the labelled nucleotide momentarily pauses during incorporation at the bottom of the ZMW, dNTP incorporation is continuously visualized with a laser and a camera system that records the colour and duration of emitted light. Each template is sequenced multiple times as a function of its length as the polymerase repeatedly traverses the circular molecule. Oxford Nanopore sequencers directly detect the DNA composition of a native single strand DNA molecule, which passes through a protein pore modifying the current that passes through the pore. These sequencers have flow cells with thousands of pores (Goodwin et al., 2016).
Figure 6. Real-time long-read sequencing approaches: Single-molecule real-time (SMRT) sequencing from Pacific Biosciences (PacBio; a) and Oxford Nanopore Technologies (ONT; b) (Goodwin et al., 2016).
Synthetic long-read technology is based on a system of barcoding to associate fragments sequenced on existing short-read sequencers. The Illumina system partitions DNA into a microtitre plate and does not require specialized instrumentation; the 10X Genomics instruments use emulsion to partition DNA and require the use of a microfluidic instrument to perform pre-sequencing reactions (Goodwin et al., 2016).
Figure 7. Synthetic long-read sequencing approaches: Illumina (a) and 10X Genomics’emulsion-based sequencing (b) (Goodwin et al., 2016).
1.3 Bioinformatic pipeline
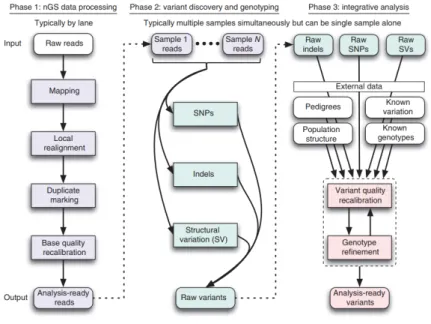
Figure 8. Framework for variant discovery and genotyping from next-generation sequencing data (DePristo et al., 2011).
After completing the sequencing run, raw reads data (FASTQ files) have to be processed (Figure 8): the first analysis step is to evaluate the quality of raw reads and to remove, trim or correct reads that do not meet the defined standards. During this step also adaptor sequences are removed (DePristo et al., 2011). The second step consists in the alignment of the reads to the reference genome, which is given in a FASTA format. Currently, there are two main sources for the human reference genome assembly: the University of Santa Cruz (UCSC) and the Genome Reference Consortium (GRC).
Both provide several versions of the human genome, at the moment versions hg19 and hg38 for the UCSC assembly and GRCh37 and GRCh38 for the GRC one. Both human assemblies are identical but differ with regards to their nomenclature (Pabinger et al., 2014). After the alignment, the duplicate reads are removed: indeed, during library amplification and sequencing process the same DNA molecules can be sequenced several times and the multiple reads can interfere with variant calling statistics. The output is a SAM (sequence alignment/map) file containing all retained reads (Pabinger et al., 2014). This format is commonly used to store next-generation sequencing alignments. SAM files can be easily converted to the BAM (binary alignment/map) format, that is a binary representation of the SAM. Initial alignments are refined by local realignment and then there is the step of base recalibration that assigns a well-calibrated probability to each base call (Pabinger et al., 2014).
Two important parameters to evaluate a NGS experiment are coverage and depth: the empirical per-base coverage represents the exact number of times that a per-base in the reference genome is covered by a high-quality aligned read from a given sequencing experiment; redundancy of coverage is also called the depth or the depth of coverage (Sims et al., 2014).
The following step is variant calling, which consists in the identification of the DNA sequence variations relative to the reference genome. Variations that can be recognized are single-nucleotide variants (SNVs) and small insertion-deletions (Indels). The output file of this analysis is a Variant Calling File (VCF) (Van der Auwera et al., 2013). Then there is the functional annotation of the variants and the genes that harbour them (Pabinger et al., 2014), a process that places mutations identified by the variant calling step into their biological context (Salgado et al., 2016). The main objective of the annotation step is to gather substantial information at the variant and at the gene levels. At the variant level it includes data quality, genomic position, genotype, frequency in the general population, impact at the mRNA and protein levels, conservation of the affected protein residues among species, variant pathogenicity prediction and reported associations with diseases. At the gene level it includes the function of the gene, tissue expression pattern, involvement in pathways and in phenotypes/diseases (Salgado et al., 2016). Accurate annotation of variants is important to understand their functional effects and to select the most promising candidate pathogenic mutations. Accurate annotation of genes is critical to understand the functional associations of the genes with pathways in normal and disease states (Chakravorty and Hegde, 2017). Finally, the variants are filtered based on quality criteria and prioritized, according to the specific disease, on the basis of pedigree information and the mode of inheritance, the localization of the variant, the mutation type, the frequency of the variant, the predicted impact of the variant on protein function and structure, the functional evidences and the evolutionary conservation of variant
nucleotide (Salgado et al., 2016). The aim of these two last steps is to combine different criteria to identify potentially candidate variants (Salgado et al., 2016). There are two options to proceed with the prioritization of the variants: one is to employ a semiautomatic prioritization system, which is a useful approach for example when the phenotype is clearly described using the proper phenotype ontology such as the Human Phenotype Ontology (HPO terms); the second one is to adopt a manual prioritization procedure based on expert knowledge about disease phenotype and gene functions. This approach can be greatly facilitated by the use of filtration tools (Salgado et al., 2016).
1.4 Gene identification approaches
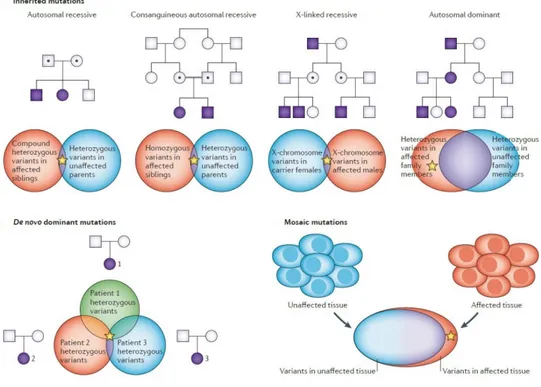
When a rare phenotype is recurring in a family, the likelihood of a monogenic rare disease is high. The mode of inheritance influences the selection and the number of individuals to sequence, as well as the analytical approach to use (Boycott et al., 2013; Figure 9).
Figure 9. Gene identification approaches for different categories of rare diseases (Boycott et al., 2013).
For autosomal recessive disorders, sib pair analysis is often needed to reduce the number of gene variants to one or few candidates. For this kind of diseases, compound heterozygous or homozygous variants should be searched in affected siblings and heterozygous variants in their unaffected parents. For X-linked recessive diseases, the favoured strategy is to analyse the two most remotely related male family members, looking for X-chromosome variants in carrier females and
in affected males. For autosomal dominant disorders, the approach is to analyse the two most remotely related family members, looking for shared heterozygous variants, which are absent in unaffected family members. Analysis of whole-exome sequencing data from unaffected parents and the affected child (trio analysis) is extremely useful for de novo variants, which are in a heterozygous state in the proband and absent in unaffected parents; comparison of these heterozygous variants between different families in which the probands have the same phenotype generally reduces these variants to a single candidate gene. The comparison of sequence data from a patient’s affected and unaffected tissues is frequently sufficient to identify mosaic disease-causing mutations (Boycott et al., 2013).
1.5 NGS approaches
The NGS technology allows to sequence a specific subset of genes (targeted sequencing, TS; clinical exome sequencing, CES), the exome (whole exome sequencing, WES) or the entire genome (whole genome sequencing, WGS) in a matter of hours to days, depending on the protocol and the platform used.
The management of NGS data, the lack of understanding of the impact of most genetic variants on human health and disease and the amount of secondary findings which can be found during a genetic test are some of the parameters that a clinician has to consider before assigning a NGS test to patients.
1.5.1 Targeted sequencing (TS)
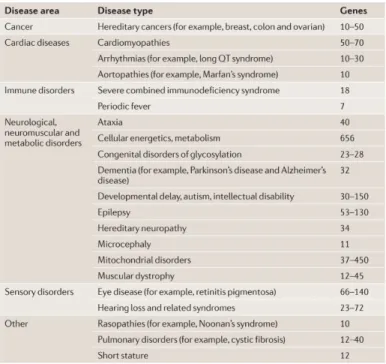
Targeted sequencing (TS) or gene panel sequencing allows to enrich only the coding regions of genes of interest for a specific disease or a diagnostic category (Table 1).
Table 1. Clinically available disease-targeted tests (Rehm, 2013).
This strategy has some advantages: • it is cheaper than the other ones;
• panels can have a much higher or often complete coverage of the genes they contain, because the gaps can be filled with supplemental Sanger sequencing and other complementary technologies (Rehm, 2013);
• a targeted approach also allows for a deeper coverage of all phenotype-specific genes, providing a greater confidence in the variants detection (Jamuar and Tan, 2015). In order to use TS for clinical diagnostics, high-quality data are essential, i.e. not the mean on-target depth, but ideally all nucleotides are seen at a minimal read depth of 20x–40x (Weiss et al., 2013). For this reason, a targeted approach is more efficient to reveal mosaic mutations than WES;
• panels usually are used in laboratories with an extensive clinical experience with a particular disease and its causative genes, so these laboratories may be better able to prioritize variants in those genes and to understand their clinical significance (Rehm, 2013);
• targeted sequencing minimizes the problems of incidental findings (Rehm, 2013);
• depending on the enrichment strategy and the platform used, several hundred target genes can be sequenced for multiple patients in the same run. Data can also be analysed within a relatively short processing time (de Koning et al., 2015);
• the size of the data files generated by panels is small and it is possible to store not only the variant files but also the FASTQ files for longer periods (Weiss et al., 2013).
However, this strategy has also some disadvantages:
• as the other NGS approaches, it is prone to sequencing artefacts and Sanger sequencing of candidate variants is always recommended (Jamuar and Tan, 2015);
• panels have to be continuously updated when new genes are identified (Jamuar and Tan, 2015).
For these reasons many laboratories have now shifted to performing WES and limiting the analysis to genes associated with phenotype and filling up the gaps with Sanger sequencing (in silico gene panels). Although this strategy is more expensive, it allows for re-analyse the data when new genes are discovered (Jamuar and Tan, 2015).
1.5.2 Clinical exome sequencing (CES)
Clinical exome sequencing is a technology that allows to sequence all the genes associated with diseases and it is being applied to a wide range of clinical presentations that require a broad search for causal variants across the spectrum of genetically heterogeneous Mendelian disorders (Lee H et al., 2014).
The TruSight One Sequencing Panel (2014) provides comprehensive coverage of about 4,800 disease-associated genes, while the TruSight One Expanded Sequencing Panel (2017) targets ~1,900 additional genes with recent disease associations in the scientific literature (https://www.illumina.com/products/by-type/clinical-research-products/trusight-one.html).
The analysis can be initially limited to only those genes that are relevant to the patient’s phenotype, but then it can be extended to a much broader gene set or even to the entire disease-associated exome (Rehm, 2013). This approach is simple as a disease-targeted test and it enables the laboratory to minimize test development and validation efforts (Rehm, 2013).
1.5.3 Whole exome sequencing (WES)
Whole exome sequencing is currently the most used approach for the discovery of those rare-disease-causing genes that conventional approaches have failed to identify. It is estimated, in fact, that 85% of the disease-causing mutations is located in coding and functional regions of the genome. For this reason, sequencing of the complete coding regions (exome) can uncover the causes of a large number of rare genetic disorders as well as predisposing variants of common diseases and cancers.
genes responsible for the dominant Freeman–Sheldon syndrome (OMIM #193700; Ng et al., 2009), recessive Miller syndrome (OMIM #263750; Ng et al., 2010) and dominant Schinzel–Giedion syndrome (OMIM #269150; Hoischen et al., 2010), respectively MYH3, DHODH and SETBP1. Then the discovery of disease-causing genes using WES has increased rapidly (Boycott et al., 2013; Figure 10).
Figure 10. Rate of discovery of novel rare-disease-causing genes using whole-exome sequencing (Boycott et al., 2013).
WES has been also used to identify the causative variants in several heterogeneous conditions, such as hearing loss, intellectual disabilities, autism spectrum disorders and retinitis pigmentosa (Rabbani et al., 2014). WES has been successfully deployed in the clinics too, appearing as the most cost-effective NGS approach (Jamuar and Tan, 2015). It is probably the most efficient technique for identifying de novo mutations in a parents-patient trio approach for heterogeneous disorders with very large numbers of putative causative genes (de Koning et al., 2015).
Although WES is supposed to cover all the protein-coding regions of the genome, the overall coverage depends on the enrichment strategy used and it tends to be between 85-95% only. The reasons include poorly performing capture probes due to high GC content, sequence homology and repetitive sequences (Jamuar and Tan, 2015). Coverage is also heterogeneous probably because of the hybridization/capture and PCR-amplification steps required for the preparation of sequencing libraries for WES (Kebschull and Zador, 2015).
Coverage of almost each nucleotide of interest is of major importance for the application of NGS technology in clinical diagnostics and sequence depth is, therefore, an important quality parameter in NGS applications. At a mean on-target read depth of 20x, which is commonly used in WES studies for diagnosing rare disorders for instance, one would miss 5–15% of the heterozygous and 1–4% of the homozygous single nucleotide variants in the targeted regions (Meynert et al., 2013). An exome approach produces terabytes of data that demand major storage capacity (Weiss et al.,
2013). On average, ~60,000 to 100,000 variants are detected during a WES experiment. These variants can be classified into pathogenic, benign and variants of uncertain significance (VUS). Pathogenic variants are those that adversely alter protein function and have either been reported previously in other affected individuals or have been shown to affect protein function in cellular or animal models. Benign variants or polymorphisms exist in a significant proportion of the population and account for the majority of the variants detected through NGS testing. VUS are variants that could possibly affect protein function based on in silico prediction, but they either have not been described in other individuals (affected or unaffected) or do not have any functional analysis in other model systems (Jamuar and Tan, 2015).
Using WES, a single pathogenic variant can be detected about 20–36% of the time; in other cases, it is possible to either find multiple candidate variants or no candidate variant. If multiple candidate variants were detected, segregation analysis and/or functional analysis would help to determine the molecular aetiology. If no variants were detected, it would be possible that the causal variant is in a poorly covered region or outside protein-coding regions (Jamuar and Tan, 2015). WES is prone to sequencing artefacts and Sanger sequencing of candidate variants is always recommended (Jamuar and Tan, 2015).
WES is not a useful approach for the identification of copy number variants (CNVs), due to the non-contiguous nature of the captured exons and to the extension of most CNVs beyond the regions covered by the exome kit (Belkadi et al., 2015). However, numerous methods have been developed to detect CNVs from exome sequencing data, like ExomeDepth (Plagnol et al., 2012), ExomeCopy (Love et al., 2011), XHMM (Fromer et al., 2012), cn.MOPS (Klambauer et al., 2012), ExomeCNV (Sathirapongsasuti et al., 2011), CoNVEX (Amarasinghe et al., 2013), EXCAVATOR (Magi et al., 2013), CoNIFER (Krumm et al., 2012), CANOES (Backenroth et al., 2014), CODEX (Jiang et al., 2015) and many others. Now there are also kits able to enrich for CNVs: one example is OneSeq Target Enrichment (Agilent, Santa Clara, USA), which consists of baits designed to detect CNVs and Loss of Heterozygosity (LOH) genome-wide down to 1 Mb and 10 Mb resolution, respectively. In addition, OneSeq includes user-defined baits for any Agilent exome, gene or custom panel or custom regions for Single Nucleotide Variants and Indels calling.
Furthermore, during a WES experiment, secondary or incidental findings (IFs) could be detected. They can be defined as pathogenic or likely pathogenic alterations in genes that are not apparently relevant to the diagnostic indication for which the sequencing test was ordered. Different guidelines about incidental findings are followed in different countries. In the United States, for example, patients have always to be advised before the test that secondary findings may be detected and laboratories should report on incidental findings detected in a minimum set of 56 genes, selected by
the American College of Medical Genetics and Genomics (ACMG) (Green et al., 2013).
1.5.4 Whole genome sequencing (WGS)
Whole genome sequencing allows the most continuous sequence coverage and it permits to identify sequence variants throughout the genome. Because of the complexity and the greater cost of WGS, WES is currently the most used approach, even though WGS has a better diagnostic yield based on overall variant calling sensitivity and efficiency (lower coverage depth required for similar sensitivity), lack of bias and uniformity of coverage, features that have a great importance in a clinical setting where reliability and reproducibility of results are crucial (Lelieveld et al., 2015). Furthermore, a higher coverage increases the sensitivity for detecting copy number variants (Medvedev et al., 2010; Szatkiewicz et al., 2013) and the lack of allele biases improves the detection of somatic variations (Lelieveld et al., 2015).
WGS is also slightly but significantly more powerful than WES for detecting variants in the regions covered by the exome kit, particularly for SNVs. WGS is prone to sequence artefacts too and Sanger sequencing of candidate variants is always recommended (Jamuar and Tan, 2015). In addition, WGS is certainly more appropriate for detecting CNVs because it covers all breakpoints and detects variations in RNA- and protein-coding exome regions not covered by the exome (Belkadi et al., 2015).
However, the costs (WGS currently costs two to three times as much as WES, but most of the costs of WGS are directly related to sequencing whereas WES costs are mainly due to the capture kit; Belkadi et al., 2015) and analysis time (4 million variants are identified) still seriously limit implementation in routine diagnostics (Sun et al., 2015), as the problems related to incidental findings and data storage.
To date, intronic, intergenic and regulatory sequence variants are difficult or impossible to interpret, but in the future they will add a superior value to WGS data and probably in silico WGS-based gene panels will be used in routine diagnostics.
1.6 NGS approaches and their diagnostic rate
Figure 11. Balance between the diagnostic potential of a sequencing strategy and its feasibility and cost (Wright et al., 2018).
There is a balance between the diagnostic potential of a sequencing strategy and its feasibility and cost (Figure 11). Trio-based WGS is the approach with the highest diagnostic yield, but it is also the most demanding and expensive one regarding the informatics approach. Since 85% of the disease-causing mutations is located in coding and functional regions of the genome, the use of WES approach only slightly lowers the diagnostic yield (for example in severe intellectual disability from ~42% for WGS to ~40% for WES), but hugely reduces the cost. Moreover, although moving from a family trio-based approach to a proband-only approach reduces costs and practical problems, it substantially reduces also the diagnostic yield (to ~28%), because de novo status or phase can not be directly assigned to determine from which parent the variants were inherited. Gene panels and single genes sequencing are the most common approaches, but the rate of diagnosis varies considerably depending on the patient’s phenotype (Wright et al., 2018).
Testing a single gene or a small number of genes may be preferable when the disease is phenotypically and/or genetically homogeneous; for phenotypically and/or genetically heterogeneous conditions, many hundreds of genes may need to be tested through NGS technologies. Genetic heterogeneity, in fact, increases as phenotypic specificity decreases: the less specific the phenotype associated with a disease is, the more likely it is to be caused by variants in many different genes (Wright et al., 2018; Figure 12).
Figure 12. Genetic heterogeneity increases as phenotypic specificity decreases (Wright et al., 2018).
1.7 NGS guidelines
1.7.1 The American College of Medical Genetics and Genomics (ACMG) guidelines
ACMG recommends that the terms “mutation” and “polymorphism”, which have been used widely leading to confusion because of the incorrect assumption of their pathogenic and benign effect respectively, should be replaced by the term “variant” with the following modifiers:
- pathogenic (class V): the sequence variation has been previously reported and recognized as causative of the disorder;
- likely pathogenic (class IV): the sequence variation has not been previously reported, but it is inside a known disease gene;
- uncertain significance (VUS; class III): the sequence variation is unknown or expected to be related to a clinical presentation;
- likely benign (class II): the sequence variation has not been previously reported, but it is probably not causative of the pathology;
- benign (class I): the sequence variation has been already reported and documented as neutral variant (Di Resta et al., 2018).
For a given variant, the user has to select criteria based on the evidence observed; then the criteria are combined according to some scoring rules that allow to classify the variant (Table 2). When a variant does not fulfill criteria or the evidence for benign and pathogenic is conflicting, it defaults to uncertain significance (Richards et al., 2015).
Table 2. The criteria that allow to classify the variants are organized by the type of evidence as well as their strength for a benign (left side) or a pathogenic (right side) assertion (Richards et al., 2015).
When a laboratory finds a variant in a gene without a validated association to the patient’s phenotype, it is a gene of uncertain significance (GUS). It can occur when a gene has never been associated with any patient phenotype or when the gene has been associated with a different phenotype from that under consideration. Additional evidence would be required to support the association of the gene to the disease (Richards et al., 2015).
The standard gene variant nomenclature maintained and versioned by the Human Genome Variation Society (HGVS) should be used. Laboratories should note the version used in their test methods; clinical reports should include sequence references to ensure unambiguous naming of the variant at the DNA, RNA and protein levels. Only specific exceptions to the HGVS nomenclature are supported (Richards et al., 2015).
ACMG recommends also to clinicians to report incidental findings in some relevant genes associated with a set of disorders, on the bases of clinical validity and utility. No technology can be
used to measure the size of tandem repeats accurately: for this reason, some disorders are not included. The laboratories have to actively look for the specified kinds of variant in the genes listed in the recommendations. Clinicians have to contextualize any incidental finding for the patient in light of personal and family history, physical examination and other relevant findings. The variants that have to be reported are those fitting two categories: “sequence variation is previously reported and is a recognized cause of the disorder” (Known Pathogenic, KP), “sequence variation is previously unreported and is of the type which is expected to cause the disorder” (Expected Pathogenic, EP). Laboratories should not ensure a depth of coverage for these genes equivalent to molecular testing for primary indication (Green et al., 2013).
Incidental variants should be reported for any clinical sequencing conducted on a constitutional (but not tumor) tissue and incidental variants should be reported regardless of the age of the patient (Green et al., 2013).
The clinician has to provide a comprehensive pre- and post-test counselling to the patient (Green et al., 2013). Whenever clinical sequencing is ordered, the clinician should discuss with the patient the possibility of incidental findings and the laboratory should report incidental findings in the genes listed in the recommendations without reference to patient’s preferences. However, the patient has the right to decline clinical sequencing if he judges the risks of eventual incidental findings to outweigh the benefits of the test (Green et al., 2013).
1.7.2 The Italian Society of Human Genetics (SIGU) guidelines
Patient’s phenotypic characterization is crucial for the choice of the molecular test and for the analysis of the identified variants. The Italian Society of Human Genetics (SIGU) recommends that different approaches should be applied in different situations (Documento Commissione SIGU-NGS, 2016; www.sigu.net):
- in case of phenotype characterized by a low genetic heterogeneity and caused by small genes, it is better to use conventional molecular methods;
- in case of phenotype characterized by a high genetic heterogeneity or caused by very long genes, it is suggested to use NGS platforms, in order to decrease time and costs; - in case of phenotype characterized by a high genetic heterogeneity, but caused in most cases by mutations in the same genes, targeted sequencing (gene panels) is suggested;
- targeted sequencing is also recommended in case of mosaic mutations;
- in case of phenotype characterized by an increasing genetic heterogeneity, it is suggested to perform WES and limit the analysis to genes associated with phenotype (in silico gene panels);
- when a diagnostic hypothesis can not be formulated it is suggested to perform WES, looking for known or new genes.
Genetic counselling is always recommended before and after the test (Documento Commissione SIGU-NGS, 2016; www.sigu.net):
- before the test, the proband has to subscribe an informed consent, which explains exhaustively what kind of results he can obtain from the test (IFs, VUS, information about parents) and allows him to decide which results he agrees to know. IFs can be: deleterious variants, which have an immediate clinical utility; known or presumed-deleterious variants, that, despite being reliably associated with a disease or relevant trait, are not medically actionable; variants which have no known medical relevance and do not have a clinical utility (Berg et al., 2011). The proband has to be supported in the decision to wether receive or not information about the variants of the first two categories; variants of the third category should not be communicated;
- a post-test counselling is necessary for the communication of the results and eventually of the IFs. Only those incidental findings decided by the patient should be communicated. However, sometimes the patient’s right to decide on his own could not coincide with the principles of medical deontology. It can happen when IFs are related to diseases for which it is possible to realize therapeutic or preventive measures or in the case of a disease involving also relatives. At this stage, the clinician can also propose further investigations, if it deemed necessary;
- in the case of oncological test, the possibility to find variants associated with cancer predisposition has to be discussed during the counselling and a specific informed consent is used.
Quality requirements are specified (Documento Commissione SIGU-NGS, 2016; www.sigu.net): - it is important to use a standardized terminology to describe the patient’s phenotype
(HPO terms) as it allows to share information accurately;
- it is important to standardize parameters and minimum requirements for each test within different laboratories;
- the medical report should be composed of only one page, with some technical attachments;
- if the test is an in silico panel, one attachment should include the analysed gene subset with the average coverage of each gene; the limits of the panel and the bioinformatic pipeline have to be specified together with any supplementary technique used;
- positive results have to be confirmed with Sanger sequencing and it is necessary to verify the coverage of the region through a specific browser, like Integrative Genomics Viewer (IGV);
- minimum parameters of coverage have to be established.
The big amount of data produced by NGS techniques causes a lot of storage problems. However, laboratories should conserve for a long time at least the most important files of the NGS workflow: the FASTQ file, which contains the reads produced by the sequencer; the BAM file, which contains the reads aligned to the reference genome; the VCF file, which contains the variants compared to the reference sequence. An important feature of NGS tests, in fact, is the temporary nature of their results, related to the development of the scientific knowledge: for this reason, they should be re-evaluated periodically (Documento Commissione SIGU-NGS, 2016; www.sigu.net).
2. AIM OF THE STUDY
The main purpose of this PhD project was to study Mendelian diseases with different Next Generation Sequencing approaches, selecting the most appropriate NGS technology and analysis workflow to investigate the molecular bases of four different genetic disorders, in order to improve their diagnosis and prognosis and to support genetic counselling.
3. MATERIALS AND METHODS
3.1 Subjects selectionIn this work we enrolled at Umberto I General Hospital and Sapienza University of Rome four different families in which a phenotype with a supposed genetic cause was recurrent, in order to identify the causative gene/genes with the most appropriate NGS technology and data analysis approach. Informed consents for DNA storage and genetic analyses were obtained for each subject or his parents; permission to publish photographs was given for all subjects reported in this work.
Family A: the index patient (III:6) was a 16-year-old girl from a small town in central Italy, who
was referred to the Department of Oral and Maxillo Facial Sciences of Sapienza University of Rome. The patient showed a bilateral absence of permanent maxillary canines and anamnestic analysis suggested the presence of several family members also affected by canine anomalies. Clinical standardized assessment, including panoramic radiographs, oral photographs and anamnestic data, was performed on fourteen members of the family by a trained orthodontist. Exome enrichment and massively parallel sequencing were performed on the genomic DNA of subjects III:1, III:4 and III:6 (pedigree in Figure 13).
Family B: the proband (III:2) was a 5-year-old boy affected by an isolated form of brachydactyly
with features of type A1 (OMIM #112500) and type C (OMIM #113100), as his maternal grandfather (I:1), while his mother (II:2) showed a very mild phenotype. The proband was also referred to the medical geneticist because of his short stature. Detailed information on pedigree, anamnesis, clinical assessment and radiographs were collected for all subjects. Exome enrichment and massively parallel sequencing were performed on the genomic DNA of subjects I:1 and III:2 (pedigree in Figure 21).
Family C: the proband (II:3) was a 4-year-old girl affected by corpus callosum hypoplasia,
daughter of a healthy Italian mother and a healthy Chinese father. The mother underwent amniocentesis and CGH-array during prenatal period, with negative results. The proband had a healthy sister (II:1). We analysed also the fetal DNA from a previously interrupted pregnancy: the fetus (II:2) was a female and showed corpus callosum agenesis and other severe malformations. Before the voluntary interruption of pregnancy, a CGH-array was performed identifying a de novo
microduplication 17q12 (31,635,490-33,323,002) x3 of uncertain significance.
Clinical exome sequencing was performed on the genomic DNA of the trio, I:1, I:2 and II:3 (pedigree in Figure 30).
Family D: the proband (II:2) was a fetus with corpus callosum agenesis and other severe
malformations. SNP-array was performed before the voluntary interruption of pregnancy and revealed a degree of homozygosity of 1% in the fetus, excluding parental consanguinity. A previous pregnancy was interrupted because of a male fetus (II:1) with the Dandy-Walker syndrome (OMIM %220200) and hydrocephalous. Exome enrichment and massively parallel sequencing were performed on the genomic DNA of II:2 (pedigree in Figure 36).
3.2 DNA extraction
The DNA was extracted from circulating leukocytes, saliva, buccal mucosa cells or hair bulbs using the Gentra Puregene Blood Kit (Qiagen, Hilden, Germany).
To extract DNA from circulating leukocytes the protocol “DNA purification from whole blood or bone marrow using the Gentra Puregene Blood Kit” was used. Erythrocytes were lysed and discarded; then, leukocytes were lysed with an anionic detergent in the presence of a DNA stabilizer, to limit the activity of DNases. RNA was then removed by treatment with a RNA digesting enzyme. Other contaminants, such as proteins, were removed by salt precipitation. The genomic DNA was then recovered by precipitation with isopropanol and the pellet washed using 70% ethanol. Finally, the genomic DNA was dissolved in hydration solution (1 mM EDTA, 10 mM Tris·CI pH 7.5).
To extract DNA from saliva the protocol “DNA purification from body fluid using the Gentra Puregene Blood Kit” was used. The cells were lysed with an anionic detergent in the presence of a DNA stabilizer, to limit the activity of DNases. Puregene Proteinase K was added in order to digest contaminating proteins. RNA was then removed by treatment with a RNA digesting enzyme. Other contaminants, such as proteins, were removed by salt precipitation. The genomic DNA was then recovered by precipitation with isopropanol and the pellet washed using 70% ethanol. Finally, the genomic DNA was dissolved in hydration solution (1 mM EDTA, 10 mM Tris·CI pH 7.5).
purification from a buccal brush using the Gentra Puregene Blood Kit” was used. The buccal brush was placed inside an anionic detergent in the presence of a DNA stabilizer, to limit the activity of DNases. Puregene Proteinase K was added in order to digest contaminating proteins. The brush was removed and the solution was centrifugated to recover as much liquid as possible. RNA was then removed by treatment with a RNA digesting enzyme. Other contaminants, such as proteins, were removed by salt precipitation. The genomic DNA was then recovered by precipitation with isopropanol and the pellet washed using 70% ethanol. Finally, the genomic DNA was dissolved in hydration solution (1 mM EDTA, 10 mM Tris·CI pH 7.5).
To extract DNA from hair, the hair bulbs were cut and dissolved in an anionic detergent in the presence of a DNA stabilizer, to limit the activity of DNases. Puregene Proteinase K was added in order to digest contaminating proteins. RNA was then removed by treatment with a RNA digesting enzyme. Other contaminants, such as proteins, were removed by salt precipitation. The genomic DNA was then recovered by precipitation with isopropanol and the pellet washed using 70% ethanol. Finally, the genomic DNA was dissolved in hydration solution (1 mM EDTA, 10 mM Tris·CI pH 7.5).
To accurately assess sample quantity and quality, the extracted DNA was quantified through the NanoDrop spectrophotometer. A 260/280 ratio of ~ 1.8 is generally accepted as “pure” for DNA; if the ratio is appreciably lower, it may indicate the presence of protein, phenol or other contaminants that absorb strongly at or near 280 nm. The 260/230 value for a “pure” DNA is often higher than the respective 260/280 value and is commonly in the range of 1.8 – 2.2; if the ratio is appreciably lower, it may indicate the presence of contaminants which absorb at 230 nm, as EDTA, carbohydrates and phenol.
3.3 NGS techniques: whole exome and clinical exome sequencing
The extracted genomic DNA was processed for the sequencing experiment through different steps: - library preparation: the genomic DNA was enzymatically or physically
fragmented and an in vitro shotgun library was constructed through the ligation with adaptors to the ends of the fragments and amplified;
- targeted enrichment: targeted enrichment was performed by an hybridization capture approach: the fragments were hybridized to biotinylated baits in the presence of blocking oligonucleotides that were complementary to the adaptors; the hybridized fragments were recovered by biotin-streptavidin-based pulldown;
- indexing and pooling: the targeted enrichment was followed by an adapter ligation with specific barcodes; all the samples were pooled together and the libraries were sequenced in parallel.
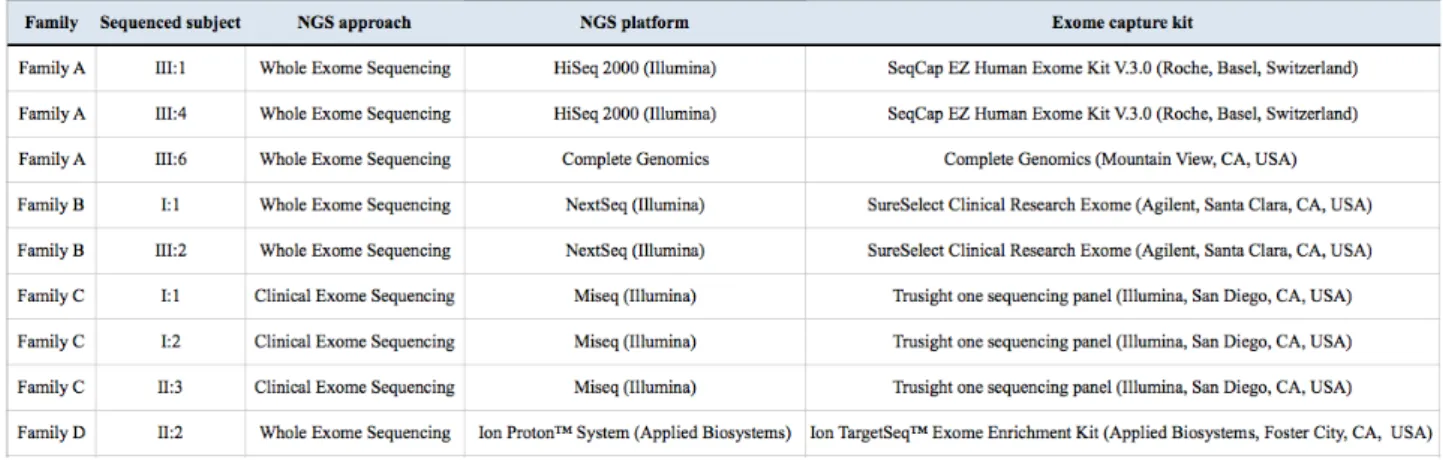
The whole exome or the clinical exome of the selected subjects were sequenced using different technologies and kits for the targeted enrichment:
Table 3. NGS platforms and kits for the targeted enrichment used for whole exome or clinical exome sequencing.
The whole exome sequencing of III:1 and III:4 of the family A was carried out by BGI (Shenzen, China) and the exome of III:6 by Complete Genomics (Mountain View, CA, United States), on DNA extracted from circulating leukocytes; the whole exome sequencing of I:1 and III:2 of the family B was performed at Casa Sollievo della Sofferenza Hospital (Foggia, Italy) on DNA extracted from circulating leukocytes; the clinical exome sequencing of I:1, I:2 and II:3 of the family C was performed at the CSS-Mendel Institute (Rome, Italy) on DNA extracted from circulating leukocytes; the whole exome sequencing of II:2 of the family D was performed at CRIBI (Centro di Ricerca Interdipartimentale per le Biotecnologie Innovative) Genomics (Padua, Italy) on DNA extracted from amniotic fluid cells (technical details about sequencing in Table 3).
3.4 Data analysis
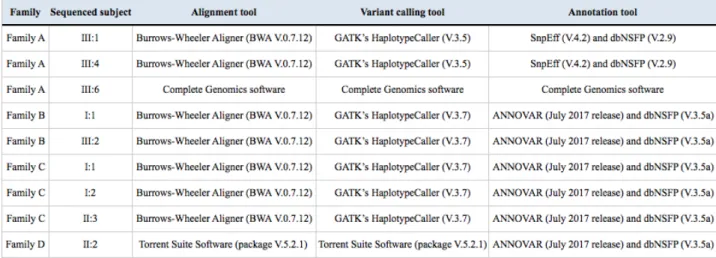
Sequencing data were processed through several steps: at first the removal of the sequences of the adaptors and the alignment of the reads to the reference genome (UCSC GRCh37/hg19) were performed through the Burrows-Wheeler Aligner (Li and Durbin, 2009), a software package for mapping low-divergent sequences against a large reference genome, in order to determine the exact position of each read on the human genome. As a following step, the duplicate reads were labelled through Picard's MarkDuplicates (http://broadinstitute.github.io/picard). Duplicates arose from
artefacts during PCR amplification (PCR duplicates) or resulted from a single amplification cluster, incorrectly detected as multiple clusters by the optical sensor of the sequencing instrument (optical duplicates). Because all the duplicate reads were sampled from the same DNA molecule, they gave an uneven representation of that molecule compared to the others and they biased the SNV calling. Picard's MarkDuplicates identified duplicates as reads that mapped with identical coordinates and orientations. After the removal of duplicate reads, Genome Analysis Toolkit (GATK) (McKenna et al., 2010), a collection of command-line tools for analysing high-throughput sequencing data, performed at first the base recalibration step through GATK Base Recalibrator, which assigned an error to each base. After that, GATK HaplotypeCaller performed the variant calling, which consisted in the identification of the DNA sequence variations relative to the reference genome (Single Nucleotide Variations or SNVs and small Indels). Finally, functional annotation of variants was performed using ANNOVAR (Wang K et al., 2010) and SNPEff (Cingolani et al., 2012) tools, to annotate SNVs and small Indels and to analyse their functional consequence on transcripts and proteins and their frequency in population database (1000 Genomes Project, dbSNP, ExAC, gnomAD). As a transcript reference dataset we used RefSeq. We added further information from different online resources on variants and genes, related to clinical information (ClinVar, OMIM),
in-silico pathogenicity predictions (e.g., Eigen, CADD, DANN, PolyPhen-2, SIFT), conservation
(e.g., PhyloP and PhastCons), functional descriptions of genes, gene expression and gene interaction information (e.g., Gene Ontology, KEGG pathways, tissue specific gene expression and Variation Intolerance Score).
Sequencing data were analysed depending on the NGS technology used; different versions of the tools were used:
3.5 Selection of candidate variants (filtering and prioritization)
At first, the variants were filtered based on quality criteria and their effect: only high-quality variants and those with an effect on the coding sequence and splice site regions were retained. Then variants were prioritized, according to the specific disease, on the basis of pedigree information and the mode of inheritance, the localization of the variant, the mutation type, the frequency of the variant, the predicted impact of the variant on protein function and structure, the functional evidences, the evolutionary conservation of variant nucleotide and the annotation in databases. Different parameters and thresholds were used for each phenotype:
Family A: we prioritized variants using a public database (ExAC V.0.3.1) to retain novel and
annotated changes with an unknown frequency or having a minor allele frequency (MAF) ≤ 5% and occurring with a frequency ≤ 10% in an in-house database, which includes approximately 600 exomes. Then we analysed the functional impact of variants by Combined Annotation Dependent Depletion (CADD) (V.1.3), a tool for scoring the deleteriousness of DNA variants, using as threshold a value of 10 (Kircher et al., 2014). We drew up a list of known genes for isolated and syndromic phenotypes characterized by hypodontia and/or related dental anomalies. We used search terms such as “hypodontia”, “primary failure of tooth eruption”, “selective tooth agenesis”, “oligodontia”, “anodontia” and “agenesis of permanent teeth” to retrieve information from literature (PubMed), mutation database (HGMD-Human Genome Mutation Database, http://www.hgmd.cf.ac.uk/ac/) and phenotype databases (OMIM-Online Mendelian Inheritance in Man, https://www.omim.org; HPO-Human Phenotype Ontology, http://human-phenotype-ontology.github.io). Then, we analysed the WES data in order to identify and prioritize variants segregating according to different inheritance patterns, and matching at least one of the following criteria: known causative variants, variants in known genes, variants in genes functionally related to teeth development and variants predicted deleterious using CADD scoring system. Finally, we analysed the potentially causative variants in terms of gene function, gene expression, animal models, and phenotype, retrieving information from several databases, i.e. OMIM-Online Mendelian Inheritance in Man (https://www.omim.org), HPO-Human Phenotype Ontology (http://human-phenotype-ontology.github.io), MGI-Mouse Genome Informatics (http://www.informatics.jax.org), ZFIN-Zebrafish Information Network (https://zfin.org), and literature (PubMed).
database (V.2.0) and with a CADD (V.1.3) score ≥ 10 (Kircher et al., 2014), predicted to have a high functional impact on the protein. We drew up a list of known genes for isolated and syndromic brachydactylies; then, we prioritized the variants hypothesising an X-linked transmission or an autosomal dominant transmission with variable expressivity and matching at least one of the following criteria: known causative variants, variants in known genes and variants predicted deleterious using CADD scoring system.
Family C: we prioritized the variants to retain only those with a frequency ≤ 3% in gnomAD
database (V.2.0) and those with a CADD score (V.1.3) ≥ 10 (Kircher et al., 2014). We drew up a list of known genes for corpus callosum dysgenesis; then we prioritized the variants, looking for a
de novo heterozygous variant or homozygous/compound heterozygous variants and variants
matching at least one of the following criteria: known causative variants, variants in known genes, variants in genes functionally related to brain development and variants predicted deleterious using CADD scoring system. We further analysed potentially causative variants on the basis of different parameters, as gene function and gene expression.
Family D: we prioritized the variants to retain only those with a frequency ≤ 3% in gnomAD
database (V.2.0) and those with a CADD score (V.1.3) ≥ 10 (Kircher et al., 2014). We drew up a list of known genes for corpus callosum dysgenesis; then, we prioritized the variants, looking for an autosomal recessive or a X-linked variant and variants matching at least one of the following criteria: known causative variants, variants in known genes, variants in genes functionally related to brain development and variants predicted deleterious using CADD scoring system. We further analysed potentially causative variants on the basis of different parameters, as gene function and gene expression.
3.6 Variants validation
Sanger sequencing was used to validate selected candidate variants and to perform segregation analyses.
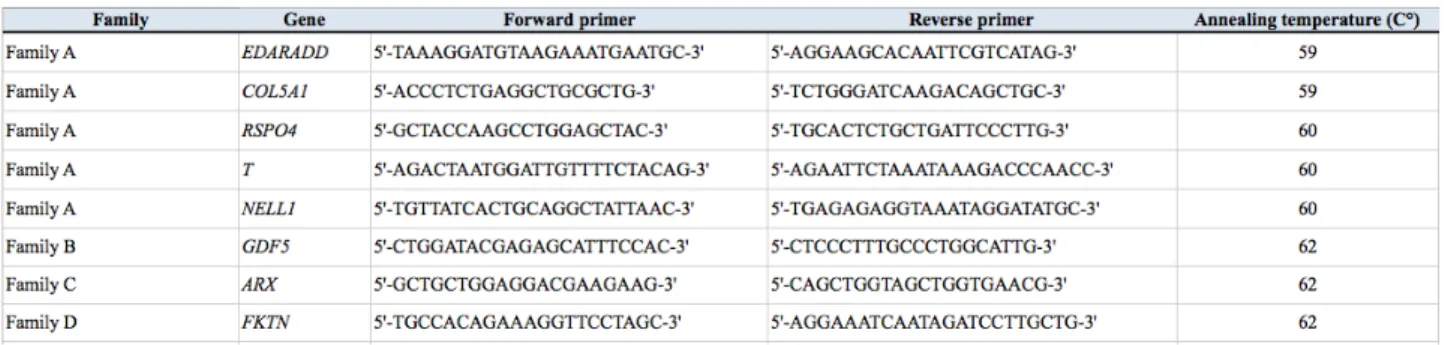
Variants were PCR-amplified by using GoTaq G2 Flexi DNA polymerase (Promega, Madison, WI, USA) and custom primers (Tables 5, 6 and 7).
Table 5. Primers used to amplify selected variants.
Table 6. PCR protocol with GoTaq G2 Flexi DNA polymerase.
Table 7. PCR cycling parameters.
The amplicons were checked through 2% agarose gel electrophoresis and purified using MSB Spin PCRapace (Stratec Molecular, Berlin, Germany).
Sanger sequencing was performed by using the ABI BigDye Terminator Sequencing Kit (V.3.1) (Applied Biosystems, Foster City, CA, USA) as per the manufacturer's protocol (Tables 8 and 9).
Table 9. Sequencing reaction cycling parameters.
Dye removal from cycle-sequencing reactions was carried on with MSB Spin PCRapace (Stratec Molecular, Berlin, Germany). Sanger sequencing was performed with automated capillary sequencers: the ABI Prism 3500 Genetic Analyzers (Applied Biosystems, Foster City, CA, USA) or the 3130/3130xl Genetic Analyzers (Applied Biosystems, Foster City, CA, USA).
Sequence electropherograms were analysed by using ChromasPro (V.1.7.5; Technelysium Pty Ltd, Brisbane, Australia).
3.7 Modeling of the nucleotidyltransferase domain of FKTN (family D)
The in silico modeling of the nucleotidyltransferase domain of human FKTN (hFKTN) protein (NP_001073270.1) was made through the Phyre software, in collaboration with Professor Alessandro Paiardini, Sapienza University of Rome.
4. RESULTS
4.1 Family AThe family was composed of three generations (Figure 13): the index patient (III:6) showed a bilateral absence of permanent maxillary canines; the other members of the family showed different maxillary canine anomalies, including canine agenesis, either monolateral or bilateral, canine impaction and canine ectopic eruption, phenotypes that seem to be different manifestations of the same disorder (Figure 14).
We performed WES of three cousins of the third generation, one for each branch of the family.
Figure 13. Pedigree of the family with canine anomalies; black lines indicate individuals for whom DNA was available for the molecular analyses; the arrows indicate individuals who underwent whole exome sequencing (WES).
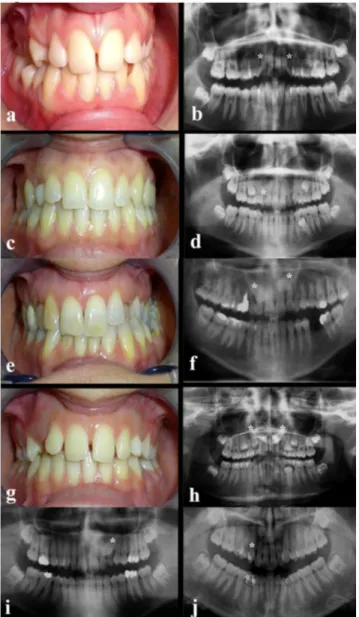
Figure 14. Clinical photographs and panoramic radiographs of dentitions of six affected family members. Subject III:6 (a-b): the index patient shows congenital absence of 1.3 and 2.3 and the persistence of the left upper deciduous canine. Panoramic radiograph shows the agenesis of permanent maxillary canines and root resorption of left deciduous canine. All third molars are present. Subject III:5 (c-d): agenesis of 1.3. Panoramic radiograph
shows the persistence of the right upper deciduous canine with root resorption; 3.5 anomalous radicular distal tip is observed. Subject II:6 (e-f): palatal bilateral maxillary impacted canines and persistence of the upper deciduous canines are observed. Subject III:7 (g-h): palatal bilateral maxillary impacted canines and persistence of the upper deciduous canines are observed. Subject III:1 (i): impacted canine 2.3; persistence of the left
upper deciduous canine and 1.2 microdontic lateral incisor are shown. Subject III:4 (j): ectopic eruption 1.3. Panoramic radiograph shows the orthodontic treatment. Mild crowding of maxillary arch can also be observed. The asterisks indicate the missing, impacted or ectopically erupting
permanent maxillary canines (Barbato et al., 2018).
We obtained the following whole exome sequencing data output:
We assumed that the phenotype in this family fit an autosomal dominant segregation model with incomplete penetrance in males and variable expressivity in the first two branches; we supposed a more complex segregation pattern in the third branch, due to a possible contribution of both paternal and maternal origin.
After bioinformatic analysis of WES data, we obtained 64,852, 66,389 and 103,815 total variants in III:1, III:4 and III:6, respectively.
Then, we filtered the exome variants using several criteria (see Material and Methods section) and we obtained: 13,144, 13,213 and 12,494 non synonymous/frameshift/splicing (-8/+3) variants in III:1, III:4 and III:6, respectively; 1,735, 1,708 and 2,345 variants with unknown ExAC frequency or MAF ≤ 5% in III:1, III:4 and III:6, respectively; 1,119, 1,071 and 2,061 variants with a frequency ≤ 10% (58/587) in the in-house database in III:1, III:4 and III:6, respectively; 648, 680 and 1,234 variants with combined annotation dependent depletion (CADD) score ≥10 in III:1, III:4 and III:6, respectively.
Variants, either shared or not by the three affected cousins, were filtered and prioritized. To this aim, as a first step, we created a list of 96 genes involved in dental anomalies, using information from several databases (OMIM-Online Mendelian Inheritance in Man, HGMD-Human Genome Mutation Database, HPO-Human Phenotype Ontology, PubMed) and we analysed single WES data looking for candidate variants in genes previously associated with dental anomalies; in a second step of the analysis, we prioritized candidate genes on the basis of their involvement in teeth development and the sharing among the three cousins.
Using the previous described criteria we selected the following variants:
Table 11. Candidate variants identified through WES approach.
The first step of the analysis led to the identification in subject III:6 (bilateral canine agenesis) of two missense variants in EDARADD and COL5A1, previously associated with tooth agenesis and a syndromic phenotype including dental anomalies, respectively.
The EDARADD variant (NM_145861.2: c.308C>T; NP_665860.2: p.Ser103Phe; rs114632254) was found also in her sister (III:5; monolateral canine agenesis) and her mother (II:6; bilateral canine maxillary inclusion) (Figures 15 and 20).
Figure 15. Electropherograms showing genotypes of patients and unaffected individuals for EDARADD variant (Barbato et al., 2018).
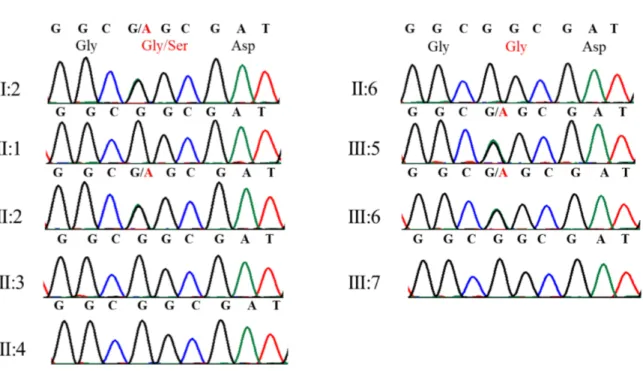
The COL5A1 variant (NM_000093.4: c.1588G>A; NP_000084.3: p.Gly530Ser; rs61735045) was found in subjects III:5 (monolateral canine agenesis), III:6 (bilateral canine agenesis) and III:2 (unaffected); it segregated from the paternal grandmother (I:2; monolateral upper left palatal impacted canine) (Figure 16 and 20).
The second step of the analysis didn’t lead to the identification of interesting variants in genes functionally related to teeth development, shared by subjects III:1, III:4 and III:6. We therefore focused on variants shared by subjects III:1 (monolateral upper left palatal impacted maxillary canine and right lateral incisor microdontia) and III:4 (monolateral upper right ectopic labial eruption of maxillary canine) and we found three missense variants in RSPO4 (NM_001029871.3: c.317G>A; NP_001025042.2: p.Arg106Gln; rs6140807), T (NM_003181.3: c.1013C>T; NP_003172.1: p.Ala338Val; rs117097130) and NELL1 (NM_001288713.1: c.1244G>A; NP_001275642.1: p.Arg415His; rs141323787) genes.
The RSPO4 variant was found in subjects III:1 (monolateral upper left palatal impacted canine), III:4 (monolateral upper right ectopic labial eruption of canine), I:2 (monolateral upper left palatal impacted canine) and III:3 (unaffected) (Figures 17 and 20).
Figure 17. Electropherograms showing genotypes of patients and unaffected individuals for RSPO4 variant (Barbato et al., 2018).
The T variant was found in subjects III:1 (monolateral upper left palatal impacted canine), III:4 (monolateral upper right ectopic labial eruption of canine), I:2 (monolateral upper left palatal impacted canine), III:2 (unaffected) and III:3 (unaffected) (Figures 18 and 20).
Figure 18. Electropherograms showing genotypes of patients and unaffected individuals for T variant (Barbato et al., 2018).
The NELL1 variant was found in subjects III:1 (monolateral upper left palatal impacted canine), III:4 (monolateral upper right ectopic labial eruption of canine), I:2 (monolateral upper left palatal impacted canine), III:2 (unaffected) and III:3 (unaffected) (Figures 19 and 20).
Segregation analysis of all the analysed variants was summarized in the following genealogic tree:
Figure 20. Variants identified in EDARADD, COL5A1, RSPO4, T and NELL1 genes in analysed family members; aminoacidic substitutions are reported for all tested variants; “wt” indicates wild type allele; “ND” indicates genotypes that have not been experimentally determined.
4.2 Family B
The family was composed of three generations (Figure 21): a proband (III:2) affected by an isolated form of brachydactyly with features of type A1 (OMIM #112500) and type C (OMIM #113100) (Figures 22 and 23), as his maternal grandfather (Figures 24 and 25), and his mother with a very mild phenotype of the hands (Figures 26 and 27).