TUSCIA UNIVERSITY - VITERBO
DEPARTMENT OF SCIENCES AND TECHNOLOGIES FOR AGRICULTURE, FORESTRY, NATURE AND ENERGY
-DAFNE-
PhD IN PLANT PROTECTION
XXVII CYCLE S.S.D. AGR/12
MULTILOCUS VNTR ANALYSIS DISCLOSES AN UNEXPECTED
INTRAPATHOVAR VARIABILITY OF PSEUDOMONAS SYRINGAE PV.
ACTINIDIAE WORLDWIDE
PhD dissertation of Dr.ssa Serena Ciarroni
Tutor
Dr. Giorgio Mariano Balestra
Coordinator Prof. Leonardo Varvaro
2
SUMMARY
1.
ABSTRACT ... 4
2.
INTRODUCTION ... 6
2.1
Bacterial canker of Kiwifruit: history, symptoms and defense strategies ... 6
2.2
Pseudomonas syringae pv. actinidiae ... 10
2.3
MultiLocus Variable Number Tandem Repeat Analysis ... 15
3.
AIM OF WORK ... 18
4.
MATERIALS & METHODS ... 19
4.1
In silico search of candidate VNTRs and primers design ... 19
4.2
Bacterial culture conditions ... 20
4.3
Genomic DNA extraction ... 20
4.4
Amplification by Polymerase Chain Reaction (PCR) ... 20
4.5
Amplicons analysis using capillary electrophoresis ... 21
4.6
Statistical elaboration of data ... 22
4.7
In vitro stability test ... 23
5.
RESULTS ... 30
5.1
In silico search of candidate VNTRs ... 30
5.2
PCR and capillary electrophoresis ... 30
5.3
General characteristics of MLVA panel ... 31
5.4
Elaboration by “diversity panel” ... 32
3
5.6
In vitro stability test ... 36
6.
DISCUSSION & CONCLUSIONS ... 52
4
1. ABSTRACT
Nowadays, kiwifruit bacterial canker is a worldwide spread disease affecting all the major producer countries; Pseudomonas syringae pv. actinidiae (Psa) is well-known to be its etiological agent: nonetheless so far a definitive cure doesn’t exist.
Traditionally Psa has been thought to be made up of 4 populations, according to macroareas of isolation and virulence degrees. Scientific community has come to this classification using several, often laborious and expensive, methodologies such as genome-wide SNPs analysis, whole genome sequencing and MultiLocus Sequence Analysis (MLSA). However the source of the pandemy begun in 2008 has not been yet definitely determined.
To understand more in depth population structure, epidemiology and mode of transmission of Psa, a MultiLocus Variable Number Tandem Repeats (VNTR) Analysis (MLVA) was set up and validated on a large collection of Psa strains, as much as possible representative of worldwide population. MLVA scheme has been made up of two different panels, comprising a total of 13 VNTR loci: the “diversity panel”, including 6 loci, has been used to perform the preliminary analysis providing results consistent with previous 4 populations-model; the whole 13 loci panel showed to be very useful to deeply clarify Psa population structure at high resolution level.
Two several types of elaboration, MST and UPGMA, were carried out to check the reliability of the established MLVA system, both showing similar and consistent results.
The analyzed collection was found to correspond to 11 clonal complexes plus 5 singletons, revealing a genetic variability never imagined before. The most diversified group resulted to be the Chinese one encompassing 6 different clonal complexes, one of these shared with all the strains related to 2008 outbreak, constituting a very homogeneous group: these data strongly suggest that the recent pandemy has been originated from this area. South Korea and Japan populations showed to be a very variegated cluster with at least two different and chronologically separated populations and surprisingly the only Turkish strain included in the study belonged to one of the Korean clonal complexes. Moreover, as proposed by some scientists and as deducted by MLVA, Psa-LV should be reassign to a new pathovar, since it shares with all the other Psa-V a common profile for only 2 on 13 loci.
5
Key words: Pseudomonas syringae pv. actinidiae, Variable Number Tandem Repeats, MultiLocus
6
2. INTRODUCTION
2.1 Bacterial canker of Kiwifruit: history, symptoms and defense strategies
Kiwifruit (Actinidia spp.) is native to Southern China where it has been cultivated since at least 700 years for its fruits and for ornamental aim too. At the beginning of the Nineteenth century it came to England, and in the Twentieth century it spread through intensive farming in New Zealand, where it found a quite favorable environment. At the end of the Twentieth century it spread in Europe and especially in Italy, where Bollettini from San Benedetto del Tronto exported the fruit first (http://www.zipmec.com/kiwi-storia-produzione-commercio-guide-frutta.html).
According to the data of FAOSTAT, except for China for which no official data are available about the real volumes of the installations and productions, nowadays in the world the surface dedicated to the culture of kiwi in 2012 was close to 99.000 hectares, whereas it was of 54.000 at the end of the Nineties. Chinese production turns around 450.000 tons.
Regarding to production surface, among the Northern hemisphere countries, Italy stands out (24.800 ha in 2014), followed by Greece (7.300 ha in 2012), and France (3.952 ha). In the Southern countries the culture is concentrated in New Zealand (12.757 ha) and in Chile (11.000 ha). Italy, with 408.800 tons for 2013/2014 and 419.000 tons estimated for 2014/2015 years, produces 65% of kiwi in the Northern hemisphere, affirming its world leader position. According to the forecasts of the CSO and IKO the 2014/2015 production should increase by 3% compared to the former season, but on the other hand drop on the average of the 2009/2012. An increase in the production is also planned for Greece which is the second producer of Europe exporting 80% of its supply because of the reduced internal market demand. Greece will increase of +32% (125.000 tons), France +7% (60.000 tons), and Spain +12% (12.500 tons). A fall of production is planned for Portugal (-25%, 16 tons), California (-10%, 21.400 tons) and South Korea (-15%, 11.500 tons). In general, the estimated production is in the average of the last 5 years, registering an increase of 6% compared to the previous year. According to FAOSTAT, in the Northern hemisphere there is a strong increase in the Turkish production which passed from 26.554 tons in 2010 to 36.781 in 2012. Surprisingly, Iran increased its production with an average of 32.000 tons in 2012, compared to the 20.000 tons in the
7
first years of 2000. The production of Iran is concentrated in the North of the country, with a total production of 99% in the Hayward zone. The production increased especially in 2013 when the government removed export restrictions enabling a competitive market with lower economic kiwi prices compared to New Zealand and Chile.
On a worldwide level, New Zealand is the country which exports the most of its kiwifruit production, with 90% followed by Europe with 80% of exports. Italy exports 70% (+1%) compared to 2013, and France its 33%. The Far East exports 50%, while Chile underwent a fall of 49% compared to the previous years (source: www.areflh.org).
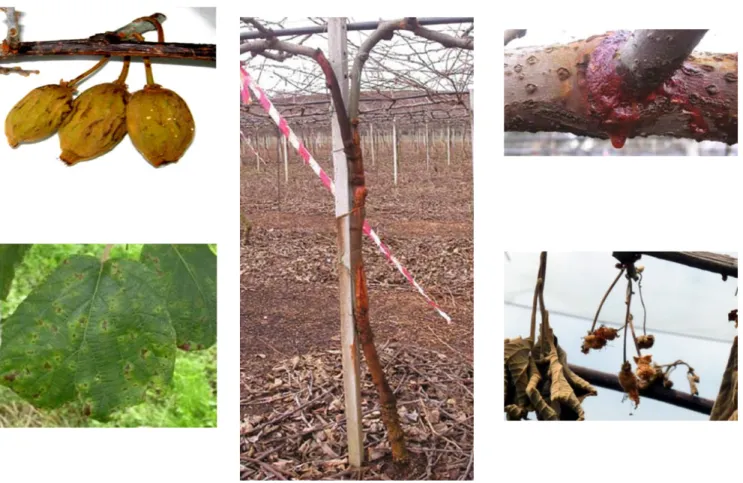
Probably the most harmful and lethal pathology of kiwifruit is the bacterial canker: it is a severe disease leading as final result to plant death by wilting and characterized by symptoms becoming firstly visible in spring/early summer, as foliar brown necrosis surrounded by yellow chlorotic haloes, collapsed fruits and flowers, brown coloration of buds (Fig. 1); during the summer the disease seems to slow down. The most typical and characteristic sign appears in the final stage of the disease in late winter and it is represented by whitish to reddish exudates which ooze from branches and trunks: now it is well-known that the exudates are one of the strategies that Psa exploits to rapidly spread between plants and orchards (Koh, 2010; Scortichini, 2012). Both most commercially relevant species of kiwifruit, Actinidia deliciosa and A. chinensis, are targeted by this pathology, together with less known species and variety, particularly present in China of which kiwifruit is native of (Vanneste, 2014).
Etiological agent of bacterial canker of kiwifruit was firstly isolated in Japan and named
Pseudomonas syringae pv. actinidiae in 1989 (Serizawa, 1989; Takikawa, 1989), even if one case
was previously reported in the Chinese province of Hunan in 1984 (Fang, 1990); subsequently, the same disease was observed also in South Korea (Koh, 1994). A few years later, in 1992 the same symptoms on kiwifruit appeared in Italy (Scortichini, 1994), where a new and stronger outbreak of bacterial canker occurred on Actinidia chinensis (Balestra, 2008): hence, the disease spread very rapidly in Turkey (Bastas, 2012), France (Vanneste, 2011a), Portugal (Balestra, 2010) and New Zealand (Everett, 2010) in 2010; then in 2011, kiwifruit orchards in Switzerland (Service ER, 2011), Spain (Balestra, 2011), Australia (Australia B., 2011) and Chile (Anonymous, 2011) were affected by bacterial canker. The latest countries to be hit were Slovenia (EPPO Reporting Service, 2014) and Germany in 2013, even if here the contagion was delimited just within two areas (EPPO Reporting Service, 2013), and Greece in 2014 (Holeva, 2015) (Fig. 2).
8
So fast and wide diffusion of Psa reaching pandemy level in a few years, leaves to infer how little was initially known about vectors, modes and routes of transmission; in the last decade, many studies have focused on this side aiming to successfully prevent the pathogen overflowing. Besides asymptomatic vegetative material (Deflorian, 2009), also pollen was found to be a possible carrier for Psa as it can survive on it for a quite long time (Vanneste, 2011b; Tontou, 2014); fruits too were thought to be potential responsible for transmission, but deep investigations on epyphitic pathogen survival on them made refuse the hypothesis (Balestra, 2014a).
Nowadays, there is not yet a definitive and infallible cure to kiwifruit bacterial canker and the awareness that the only way to face the problem is the coexistence with Psa is becoming stronger and stronger. However, besides correct agronomic and culture practices, such as disinfection of pruning tools, closing of natural or artificial wounds by mastic or natural waxes, burning of pruning remains and infected plant portions, which help to contain infected zones, years-lasting researches have shaded light on several and important aspects of pathogen and so on the possible strategies to manage it.
Antibiotics use is forbidden in agriculture within European Community, whilst in other countries they are regularly distributed on orchards. New Zealand has been tried to face Psa by using essentially kasugamycin- and streptomycin-based pesticides (respectively Kasumin® and KeyStrepto™) but with no satisfactory results, since on April 30th 2015 87% of New Zealander kiwifruit cultivations, corresponding to 2.724 orchards and 12.009 hectares, were recorded to be infected by Psa (source: www.kvh.org.nz). Similar critical situations could be observed in Japan, Korea and Chile. In addition to the lack of clear advantages in field conditions, it has already been ascertained that Psa is able to acquired antibiotics resistance (Han, 2003; 2004).
Copper and copper-based compounds have traditionally been used against bacterial crop pathogens since their broad-spectrum antimicrobial properties (Balestra, 2006). Nevertheless, European Community is trying to reduce the use of chemicals, including copper, in agriculture management, searching for more human health- and eco-friendly defense strategies. In the case of Psa, copper is recommended in many kiwifruit protection plans, but, as for streptomycin, there are clear evidences of potential resistance of Psa to it, already expressed in some Japanese strains isolated in the late Eighties (Nakajima, 2002). By virtue of these aspects, many efforts have been addressed to the research of biocontrol agents (BCAs) useful to contain and to manage kiwifruit bacterial canker pathogen (Mathre, 1999). Interesting results were pointed out by studies involving natural extracts
9
(Monchiero, 2015), selective bacteriophages (Di Lallo, 2014) and antagonistic microorganisms; among them, Bacillus amyloliquefaciens subsp. plantarum D747 was proven to be very effective in competing with Psa (Biondi, 2012); in the field it showed a good preventive activity. At the moment it is registered specifically for Psa management under the commercial name of Amylo-X® (Balestra, 2014b).
Fig.1 Symptoms of bacterial canker on kiwifruit. A) collapsed fruits; B) brown leaf spots with chlorotic
10
Fig. 2 Current distribution of bacterial canker of kiwifruit worldwide.
2.2 Pseudomonas syringae pv. actinidiae
Pseudomonas syringae “sensu latu” represents one of the most articulated bacterial species
complex that includes 9 recognized plant pathogenic species, which are P. cannabina, P. avellanae,
P. amygdali, P. ficuserectae, P. savastanoi, P. tremae, P. meliae, P. caricapapayae and P. syringae
(ISPP Taxonomy of Plant Pathogenic Bacteria Committee, http://www.isppweb.org/names; Young, 1978).
Concerning last species P. syringae, it represents in turns another wide and heterogeneous complex of different taxa, among which several are dangerous pathogens, named pathovars, in relation to their preferences in attacking specific hosts. More than 60 are actually recognized (Young, 2010), whilst many other strains genetically referable to P. syringae are merely environmental bacteria.
P. syringae is responsible for many diseases on crop, forest and ornamental plants, whose typical
11
Due to its extent, P. syringae is characterized by great heterogeneity for as regards molecular aspects (Gardan, 1992; Sawada, 2002). The most recent and commonly recognized intraspecies classification is mainly based on sequences of housekeeping genes, components of “core genome” and not so inclined to horizontal transfer: they reveal that P. syringae, despite “flexible genome” complexity, shows to be highly clonal referring to genes essential for bacterial survival, which result poorly related to host plant, that is to pathovar (Fig. 3) (Sarkar, 2004).
Psa is one of the pathogenic group belonging to P. syringae complex inside genomospecies 8, responsible for bacterial canker of kiwifruit; it is a Gram negative, aerobic, non-sporing, rod-shaped and motile with one to three polar flagella bacterium (Takikawa, 1989). It can enter its host through natural openings, such as stomata and lenticels, and through wounds caused by atmospheric agents (Ferrante, 2014) or anthropic interventions: once inside the plant, Psa tends to migrate towards crown to cause the damages above described; it has been also demonstrated that Psa can invade and destroy both phloem and xylem, where it induces tyloses formation and that it can overwinter in root apparatus, making useless tree topping practice (Renzi, 2012).
Until recently, according to virulence degree on host and pathogenicity tests, recognition of two different populations of Psa has been broadly accepted: Psa-V (Virulent) has been considered the true etiological agent of kiwifruit canker causing all of the symptoms described in the previous paragraph, whilst Psa-LV (Low Virulent) induces the appearance of just foliar spots with chlorotic haloes but not the other signs, so it doesn’t lead plants to death. Right now, the LV population is present in Australia, France and New Zealand, where it coexist together with the V population (Vanneste, 2013). Founding on biochemical, pathogenicity and genetic characteristics, it has been recently proposed to assign LV population to a different new pathovar (Butler, 2013; Cunty, 2014; Ferrante, 2015).
At this moment, many DNA-based protocols for Psa detection even on asymptomatic samples are available. The first attempt to get a reliable detection method was set up by Koh and Nou and was founded on the amplification of a pathovar-specific genomic DNA sequence giving a 492 bp single amplicon (Koh, 2001), although it revealed some specificity problems (Scortichini, 2002). 16S-23S rDNA intertranscribed spacer region was targeted too for early and accurate diagnosis of Psa, but the greatest limit was maybe represented by low sensitivity, which drew attention to the need of a preliminary process such as an enrichment or isolation step (Rees-George, 2010). Low specificity and sensitivity difficulties were ridden over by studying and validating a duplex-PCR test based on
12
Koh-Nou marker and an amplicon located on avrD1 gene: the protocol not only showed to differentiate between Psa and the most similar groups P. syringae pv. theae, P. avellanae and P. s. pv. tomato, but also to be efficient working on spiky matrices, such as plant tissues and pollen (Gallelli, 2011). A further improvement was reached in 2012 when a multiplex PCR assay was established: four primer pairs, named Psa, Europe, China and Japan/Korea, could be simultaneously used in one reaction of amplification, allowing to distinguish Psa from closest related Pseudomonads and at the same time correctly assign recognized Psa to haplotype, and so to its geographic origin (Balestra, 2012). Recently, also Real Time PCR protocol based on hrpW gene was used to detect and to quantify Psa-V presence in whatever matrices (Gallelli, 2014).
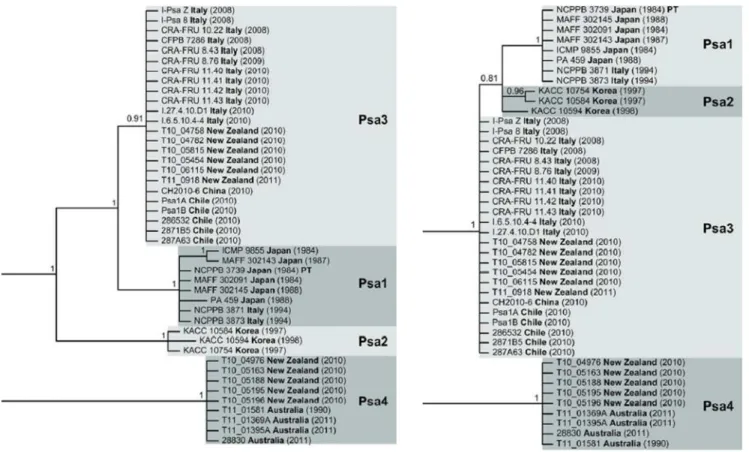
Since the beginning of the last massive and harmful epidemic, different types of DNA-based analysis were carried out attempting to characterize genetically the populations of Psa (Lee, 2005). One of the first attempts in such sense was the repetitive PCR (rep-PCR) analysis, based on the use of primers BOX, ERIC and REP, which gives specific banding patterns according to species or even strains, providing information about genomic rearrangement (Louws, 1994; Ferrante, 2010; Mazzaglia, 2011). The first indications obtained in these researches were about differences between the groups of European, Korean and Japanese strains. Then, one of the most popular technique for phylogenetic studies of bacterial population, the MultiLocus Sequence Typing (MLST) was repeatedly applied to study Psa. As example, Chapman and his group amplified, sequenced and analyzed seven housekeeping genes (acn, rpoD, gapA, cts, pgi, pfk, gyrB), eleven putative effector genes and phytotoxin genes and resulted able to allocate different Psa strains into 4 MLST groups: Psa-1 for strains from Japan and the Italian strain obtained in 1992 report; Psa-2 for Korean strains; Psa-3 for New Zealander, Chinese, Chilean and Italian (after 2008) strains; Psa-4 for LV population (Fig. 4) (Chapman, 2012). Then, since 2011, some research groups have started approaching genetic analysis of Psa by genome analysis. Three main papers figured out a more detailed picture of the genetic variability present in Psa populations worldwide. In a first paper, Mazzaglia and colleagues sequenced 9 strains of Psa and 1 of the pathovar theae, known to be the genetically closest to Psa. Interestingly, an almost complete correspondence was found between the 3 Chinese strains, isolated from Shaanxi province in 2010, and European strains, separated each other by only 6 SNPs, but with some noteworthy differences in a particular genomic island (PPHGI-like). The genomic analysis confirmed that these strains are clearly distinct from Japanese and Korean strains. A derived PCR approach, in the same paper, indicates that also the virulent strains from New
13
Zealand belong to the Chinese/European group (Mazzaglia, 2012). In 2013, Butler and colleagues investigated the genome of 23 Psa strains and, focusing mainly on the analysis of genomic islands (Integrative Conjugative Elements - ICE), they shed light on a plausible, independent Chinese origin for each European, New Zealander and Chilean outbreaks; this research also suggests that low virulent strains are merely not true Psa (Butler, 2013). The most recent paper on Psa genomes, taking in account 34 Psa draft genomes and 2 complete circular genomes, confirms the existence of 4 different Psa lineages, debates in deep the significance of these differences, again mainly related to pathogenicity islands, and suggests a common, recent ancestor for these lineages (McCann, 2013). The last year, a new MLSA group named biovar 5 was isolated and identified in Japan (Sawada, 2014).
14
Fig. 3 P. syringae complex as obtained by 7-genes MLST; Psa is indicated as PanFTRS_L1 in
15
Fig. 4 The 4 haplotypes recognized within Psa population according to MLSA on housekeeping (A) and
effector (B) genes (Chapman, 2012).
2.3 MultiLocus Variable Number Tandem Repeat Analysis
In the last years, the value of repeated sequences markers (mini satellites, microsatellites, etc.) in highlighting coherent differences between individuals of a same taxa has been clearly demonstrated. In particular, the chance to identify different clonal populations within strictly delimited taxa of several human bacterial pathogens was attained by means of a molecular technique named MLVA (Multiple Locus VNTR Analysis) (Linstedt, 2005). This technique relies on the detection of length variations of specific DNA sequences; the differences are ascribable to
16
variations in the number of copies of well-defined repeated units: these sequences are known as Variable Number of Tandem Repeats (VNTR) (Fig. 5a). The amplicons, obtained by standard PCR using primers designed on both the flanking regions of the Tandem Repeat (TR), are analyzed by high resolution electrophoresis techniques (i.e. capillary electrophoresis) or by high resolution melting curve analysis (HRMA) (Ciammaruconi, 2009). The VNTRs originate from DNA polymerase slippage or from recombination events during DNA duplication and are subjected to a different selective pressure depending on whether they lie within coding or non-coding regions and depending on repeat unit size; so, different (for position and size) types of VNTR can provide different variability rates (Pourcel, 2011a). Once a panel of proper VNTRs is defined for a specific organism (Fig. 5b), the MLVA provides many advantages, such as being faster, cheaper and less time- and labor-consuming in comparison to other comparable techniques, like PFGE or AFLP (Sawada, 2002); moreover, combining MLVA with capillary electrophoresis provides very high resolution data.
The first approach to this method was carried out by Andersen and colleagues, that found a sequence of twelve base pairs, differing in number of repeats, able to distinguish Bacillus anthracis from the closely related species B. cereus and B. mycoides (Andersen, 1996); on the same bacterium another VNTR sequence that permitted to differentiate strains into 5 allelic types with strict connection to their geographical origin was later discovered (Jackson, 1997). More recently, optimized HRMA was applied on 6 of 25 loci tested for MLVA feasibility on Bacillus anthracis, improving the speed and reproducibility of analysis (Fortini, 2007). Then, VNTR-based approach was applied to other bacteria of clinical interest: serotypes of the food-borne bacterium Listeria
monocytogenes was subtyped using this new method, as part of a routine surveillance program
(Murphy, 2007); in addition to SNPs method, it was used to classify Yersinia pestis in Madagascar, identifying patterns relative to geographically separated subpopulations and helping to assess long distance transfer of the pathogen using humans as vehicle (Vogler, 2011). VNTR-based method was then applied successfully on many other noteworthy human bacterial pathogen such as
Brucella spp. (De Santis, 2009; Garofolo, 2013), Pseudomonas aeruginosa (Naze, 2010; Sobral,
2012) and Mycobacterium tubercolosis (Frothingham, 1998; Supply, 2006; De Beer, 2012). So far, just few cases of MLVA application on phytopathological bacteria are known.
Della Filho and his group studied VNTRs on Xylella fastidiosa genome (Della Coletta-Filho, 200); on Xanthomonas citri pv. citri, it was moreover demonstrated that MLVA has an
17
higher resolution degree than AFLP or IS-LM-PCR (Insertion Sequence-Ligation Mediated-PCR; Bui Thi Ngoc, 2009); also in the case of Xanthomonas arboricola pv. pruni, MLVA revealed to be much more effective than the other most known typing methods, as AFLP or rep-PCR (Bergsma-Vlami, 2012); Zhao and colleagues have developed a VNTR-based protocol to study the rice pathogen Xanthomonas oryzae pv. oryzicola, thus managing to discriminate between Asian and African strains (Zhao, 2012); also on Ralstonia solanacearum, the causal agent bacterial wilt on many crops, was successfully approached MLVA aiming to distinguish populations related to different hosts (N’Guessan, 2013). Pseudomonas syringae pv. maculicola was in depth analyzed in relation to P. s. pv. tomato, using both sequencing of housekeeping genes and eight variable number TRs, with highly consistent results between them (Gironde, 2012). Another example of application of MLVA technique on phytopathogenic bacteria concerns Clavibacter michiganensis subsp. michiganensis, and its effectiveness was demonstrated in deciphering differences between strains from recent Belgium outbreaks in 2010-2012, and others worldwide collected (Zaluga, 2013): also in this case, the MLVA method showed to be the most efficient in comparison to other techniques.
Fig. 5 Single VNTR differing for repetition number (a) and several VNTRs dispersed in the
genome, generating a hypothetical MLVA panel (b).
18
3. AIM OF WORK
The approaches described into introduction have given a lot of new detailed evidences on populations of Psa, but the lack of a congruous number of strains from China, the main area of origin of Actinidia species, probably jeopardizes the chance to acquire additional information on where this pernicious pandemic comes from.
So, further researches are needed to unravel what still remain unclear, most of all about the possible diversities among Psa populations in the enormous area of Actinidia cultivation in China, where there is also the natural presence of hundreds of wild Actinidia species.
Another topic that can deserve further attention is directly related to the WGS analysis; as a matter of fact, for its own methodology that assume the overlapping of small reads ends, the WGS sequences reconstruction inexorably fails to give almost any evidence about a known powerful source of differential information, as the repeated sequences are.
In this study possible differences between strains of different geographical origins, isolation dates, host species and virulence were investigated, in order to individuate clearly and promptly the sources of infection and to break out immediately any further diffusion. In such sense, the successful history of the MLVA technique reported above has incentivized the search for an incisive VNTRs panel for Psa and to test it on a truly exhaustive collection of Psa strains, coming from nearly all the worldwide areas where the pathogen is already established, aiming to assess so far unknown information about Psa intrapathovar relationships, and attempting to trace their origin and routes of transmission.
19
4. MATERIALS & METHODS
4.1 In silico search of candidate VNTRs and primers design
3 WGS genomes of Psa, differing for geographic origin and isolation year, were selected and downloaded as FASTA files from NCBI (https://www.ncbi.nlm.nih.gov). They were converted into concatenated form and submitted to Tandem Repeat Database by Gelfand and colleagues (https://tandem.bu.edu/cgi-bin/trdb/trdb.exe; Gelfand, 2007) to search Tandem Repeats (TRs) applying Tandem Repeat Finder (TRF) algorithm (Benson, 1991); the following parameters were set up:
- Minimal alignment score: 50 - Match, mismatch, indels: 2, 7, 7 - Maximal period dimension: 500
So-found TRs were later compared by means of Position Comparison Tool on the same site, aiming to point out those sequences occupying the same position on two genomes but repeated a different number of times: at this point good VNTR candidates were selected. Right and left flanking regions of 100 bp were individuated and blasted against NCBI databank to check whether they were present in all of the deposited WGS Psa genomes; subsequently they were used to design primers pairs (http://www.bioinformatics.nl/cgi-qbin/primer3plus/primer3plus.cgi) to amplify each candidate VNTR and they were aligned again by Primer-BLAST (http://www.ncbi.nlm.nih.gov/tools/primer-blast/) on NCBI to ensure a single PCR product.
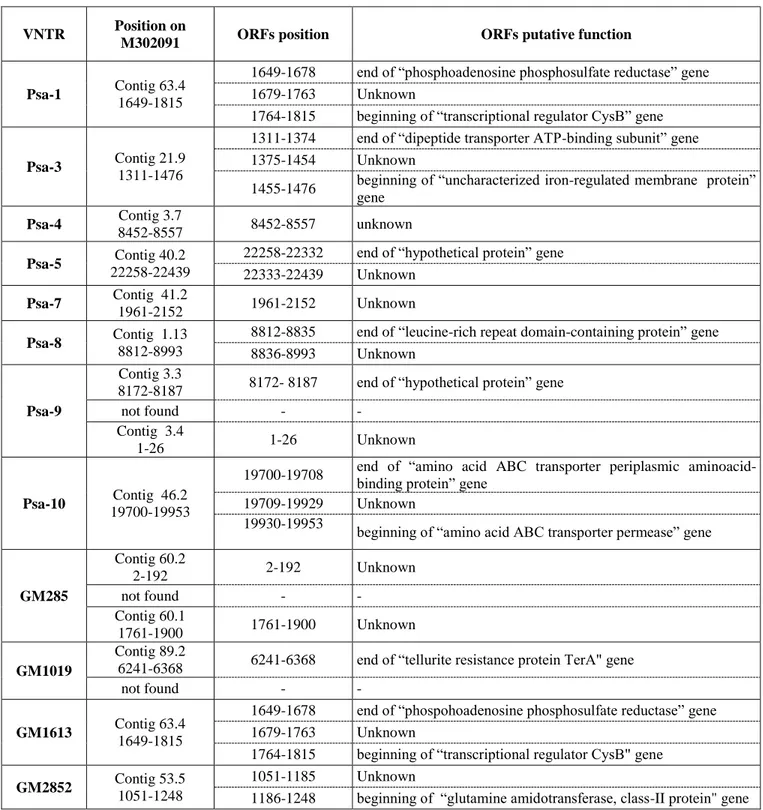
Once the MLVA panel was composed, each VNTR locus was searched on WGS reference genome of M302091 strain (NCBI WGS Project AEAL01) to locate the position and to define the putative function of associated open reading frames (ORFs).
20
4.2 Bacterial culture conditions
Selected Psa strains were retrieved from -80°C freezer, streaked on King B plates (peptone 20 g; glycerol 10 ml; K2HPO4 1.5 g; MgSO4·7H2O 1.5 g; technical agar 15 g; deionized water 1 l) and let
grow at 28°C for 48 hours; then from each plate genomic DNA was extracted. The whole set of isolates involved in the study is listed in table 2; their identification was preliminarily confirmed by Koh (Koh, 2001) and Rees-George (Rees-George, 2010) specific PCR. The 10 isolates marked with
† constituted the screening group of Psa, since they are characterized by different site and date of
isolation: PSA_7286, Italy 2008; PSA_830, Spain 2011; PSA_832, Portugal 2011; PSA_2F, France 2010; PSA_K2T, Turkey 2011; PSA_18875, New Zealand 2011; PSA_23664, South Korea 1989; PSA_K2, South Korea 1997; PSA_CH2010-6, China 2010; PSA_JILO4, China 2012.
4.3 Genomic DNA extraction
Once grown, genomic DNA was extracted from every plated Psa isolate by DNeasy Plant Mini kit (QIAGEN, Milan, Italy). DNA samples were quantified using Qubit™ Fluorometer (Invitrogen, Life Technologies Italia, Monza, Italy), then dilution buffer was added to reach for each sample 40 ng/µl concentration. So-prepared samples were kept at -20°C until they were used.
4.4 Amplification by Polymerase Chain Reaction (PCR)
VNTRs candidates selected to be tested on Psa screening isolates (marked by † in table 2) are listed in table 1. Beside sequences found by analysis on TRDB site, 10 VNTRs coming from Gironde & Manceau work (Gironde, 2012) were included in MLVA panel to evaluate their potentiality for Psa intrapathovar analysis: they are named GMxxx in table 1; in this case, primer pairs reported in the paper were used. All the primers couples were ordered and bought from Macrogen (Macrogen Europe, Amsterdam, the Netherlands). Amplification protocols were set up on a C1000 thermal cycler (Biorad Laboratories Inc., CA, USA) with the following steps: initial denaturation at 94°C
21
for 5 minutes; then 30 cycles made up of denaturation at 94°C for 30 seconds, annealing temperature depending on specific primers pair (Tab. 1), elongation at 72°C for 45 seconds; final elongation at 72°C for 7 minutes. Every reaction mix was prepared as follows: 12.5 µl of GoTaq Colorless Master Mix 2X (Promega Corporation, Madison, WI, USA) containing GoTaq® DNA Polymerase, 400 µM of each dNTP, 3mM MgCl2; 1 µl of genomic DNA sample (40 ng); 1 µl of
forward primer and 1 µl of reverse one corresponding to 10 µM concentration each; 9.5 µl of nuclease-free water to reach the final volume of 25 µl. The reactions were prepared on the same way for VNTRs amplification passing the screening phase on the remaining Psa isolates.
All of the experiments were performed twice.
4.5 Amplicons analysis using capillary electrophoresis
PCR products were analyzed by capillary electrophoresis apparatus QIAxcel (QIAGEN, Milan, Italy) to find out their accurate dimensions; default method OM700 of High Resolution Cartridge was chosen and thus the following parameters were applied: injection phase at 5 KV for 10 seconds; separation phase at 3 KV for 700 seconds. Only amplicons coming from Psa-9 amplification, characterized by a greater dimension, were run using OM500 default method, comprising a separation phase of 5 KV for 500 seconds. OM700 parameters allow to discriminate PCR products differing for only 3-5 bp. Results were analyzed by Screengel software (QIAGEN), which gave accurate values for both size and concentration of the amplicons. During the screening phase, primers giving a PCR product of identical length for all the strains were discarded and not involved in the subsequent procedure of the entire Psa collection analysis.
All the process was repeated twice.
The whole set of PCR products belonging to three representative Psa strains (CFBP 7286 Italy, CH2010-6 China, KW11 Japan) were sequenced, together with the ones difficult to assign because of a poorly clear repetition number or discrepancies in WGS alignment.
22
4.6 Statistical elaboration of data
Once the accurate dimension of amplicons of the 168 Psa strains for every VNTR was found out, associated TR repetitions number was calculated for each of them, applying the following formula (all the variable are expressed in bp):
𝒏 =𝐱 − (𝐚 + 𝐛 + 𝐩𝐓) 𝐓
Where:
n is the repetition number of TR;
x is the amplicon dimension as obtained from capillary electrophoresis; a and b are the dimensions of respectively right and left flanking regions; pT is the dimension of the latest repetition (often it is truncated);
T is the repeated unit length.
Repetition number, if the latest repetition is truncated, was conventionally rounded up to the upper integer number, whilst the lack of amplification was codified as -1. The final outcome of the process is constitute by a MLVA profile, that is a numerical string, specific for every considered Psa strain. For the subsequent elaboration, VNTR loci were grouped into two panels characterized by differential variability degrees and consecutively applied for the analysis of the whole Psa set: the first one made up of loci giving low number of haplotypes, named “diversity panel”, and the second one composed by the entire set of 13 VNTR loci.
Simpson’s (Simpson, 1949) and Hunter-Gaston’s (Hunter, 1988) diversity indices were calculated for every single VNTR locus by means of online tool V-DICE (http://www.hpa-bioinformatics.org.uk/cgi-bin/DICI/DICI.pl).
The VNTR alleles were then analyzed as “character” data using Bionumerics 7.1 (Applied Maths NV. http://www.applied-maths.com.); the data, inserted as “categorical” data matrix and given an equal weight to all the VNTRs, were used to build Minimum Spanning Tree (MST) and Unweighted Pair Group Method with Arithmetic means (UPGMA) graphics.
MST allows to draw a clear scheme of the evolutionary relatedness between haplotypes by comparison of allelic profiles. The criterion of 33% of differences on the total number of VNTR loci (2 mismatches on 6 loci) for analysis with “diversity panel” and of 23% (corresponding to 3
23
mismatches on 13 loci) for the whole MLVA panel were established to group haplotypes into clonal complexes (CC). Clonal complexes are each other related according to the increasing number of mismatches between haplotypes.
Furthermore, a similarity matrix was elaborated to build UPGMA dendrogram where the percentages reflect the percentage of homology between specific markers, for each macrogroup.
4.7 In vitro stability test
PSA_7286 was chosen as standard strain to validate in vitro stability of all the analyzed VNTRs. The selected isolate was grown on KB plates for 20 subsequent generations and for each of them genomic DNA was obtained by thermal denaturation: some bacteria, taken from 24 hours plate, were dissolved into molecular biology sterile water, mixed by vortexing and let incubate at 95°C for 10 minutes; then cells debris were pelleted by centrifugation (8.000 g for 3 minutes), DNA was retrieved as supernatant and stored at -20°C until use. The whole MLVA panel was applied to DNA from each generation and processed as described before to check any variation in repetition numbers of every single VNTRs.
24
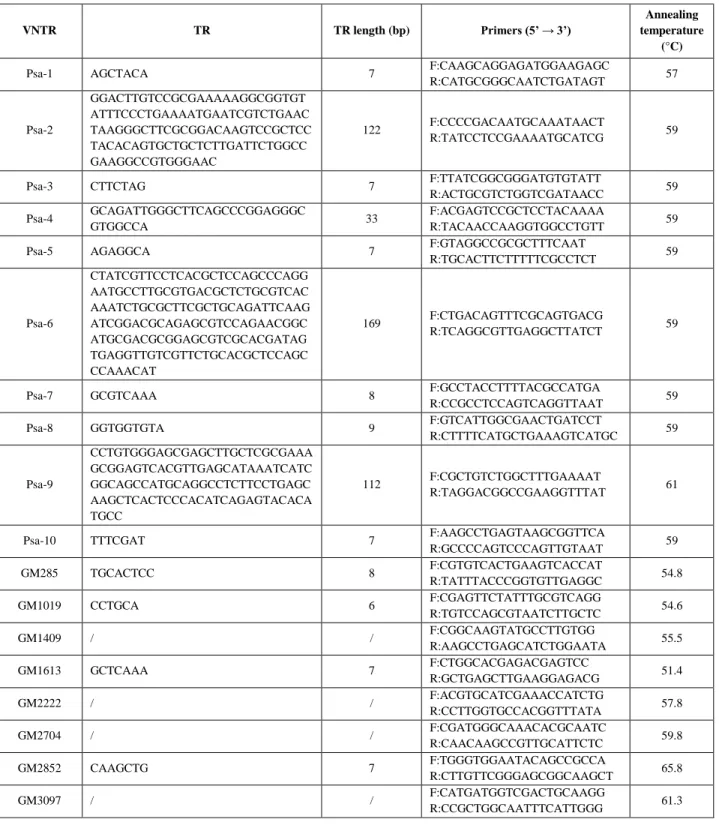
Tab. 1. Characteristics of VNTRs initially selected: name of VNTR locus, TR sequence and
length, sequences of forward and reverse primers and the corresponding annealing temperature. Sequences named as GMxxx come from Gironde & Manceau work (2012): TRs length and sequence in their paper were not reported, so these characteristics are known just for loci passing screening phase and so used in large scale analysis because of sequencing of amplicons.
VNTR TR TR length (bp) Primers (5’ → 3’)
Annealing temperature
(°C)
Psa-1 AGCTACA 7 F:CAAGCAGGAGATGGAAGAGC
R:CATGCGGGCAATCTGATAGT 57 Psa-2 GGACTTGTCCGCGAAAAAGGCGGTGT ATTTCCCTGAAAATGAATCGTCTGAAC TAAGGGCTTCGCGGACAAGTCCGCTCC TACACAGTGCTGCTCTTGATTCTGGCC GAAGGCCGTGGGAAC 122 F:CCCCGACAATGCAAATAACT R:TATCCTCCGAAAATGCATCG 59
Psa-3 CTTCTAG 7 F:TTATCGGCGGGATGTGTATT
R:ACTGCGTCTGGTCGATAACC 59 Psa-4 GCAGATTGGGCTTCAGCCCGGAGGGC
GTGGCCA 33
F:ACGAGTCCGCTCCTACAAAA
R:TACAACCAAGGTGGCCTGTT 59
Psa-5 AGAGGCA 7 F:GTAGGCCGCGCTTTCAAT
R:TGCACTTCTTTTTCGCCTCT 59 Psa-6 CTATCGTTCCTCACGCTCCAGCCCAGG AATGCCTTGCGTGACGCTCTGCGTCAC AAATCTGCGCTTCGCTGCAGATTCAAG ATCGGACGCAGAGCGTCCAGAACGGC ATGCGACGCGGAGCGTCGCACGATAG TGAGGTTGTCGTTCTGCACGCTCCAGC CCAAACAT 169 F:CTGACAGTTTCGCAGTGACG R:TCAGGCGTTGAGGCTTATCT 59
Psa-7 GCGTCAAA 8 F:GCCTACCTTTTACGCCATGA
R:CCGCCTCCAGTCAGGTTAAT 59
Psa-8 GGTGGTGTA 9 F:GTCATTGGCGAACTGATCCT
R:CTTTTCATGCTGAAAGTCATGC 59 Psa-9 CCTGTGGGAGCGAGCTTGCTCGCGAAA GCGGAGTCACGTTGAGCATAAATCATC GGCAGCCATGCAGGCCTCTTCCTGAGC AAGCTCACTCCCACATCAGAGTACACA TGCC 112 F:CGCTGTCTGGCTTTGAAAAT R:TAGGACGGCCGAAGGTTTAT 61
Psa-10 TTTCGAT 7 F:AAGCCTGAGTAAGCGGTTCA
R:GCCCCAGTCCCAGTTGTAAT 59 GM285 TGCACTCC 8 F:CGTGTCACTGAAGTCACCAT R:TATTTACCCGGTGTTGAGGC 54.8 GM1019 CCTGCA 6 F:CGAGTTCTATTTGCGTCAGG R:TGTCCAGCGTAATCTTGCTC 54.6 GM1409 / / F:CGGCAAGTATGCCTTGTGG R:AAGCCTGAGCATCTGGAATA 55.5 GM1613 GCTCAAA 7 F:CTGGCACGAGACGAGTCC R:GCTGAGCTTGAAGGAGACG 51.4 GM2222 / / F:ACGTGCATCGAAACCATCTG R:CCTTGGTGCCACGGTTTATA 57.8 GM2704 / / F:CGATGGGCAAACACGCAATC R:CAACAAGCCGTTGCATTCTC 59.8 GM2852 CAAGCTG 7 F:TGGGTGGAATACAGCCGCCA R:CTTGTTCGGGAGCGGCAAGCT 65.8 GM3097 / / F:CATGATGGTCGACTGCAAGG R:CCGCTGGCAATTTCATTGGG 61.3
25
Tab. 2. Whole set of Psa strains involved in MultiLocus VNTR Analysis. Those marked by †
made up the initial screening group; the strains marked by * have been completely sequenced and
are available as draft genomes on NCBI databank.
Name Source Year Continent Country Region Locality Host species Cultivar
PSA_7285 CFBP 2008 Europe Italy Veneto Treviso A. chinensis Jin Tao
PSA_7286*† CFBP 2008 Europe Italy Latium Latina A. chinensis Hort-16A
PSA_7287 CFBP 2008 Europe Italy Latium Latina A. deliciosa Hayward
PSA_829 UNITUS 2011 Europe Spain Galicia Borguiera
Tomino
A. chinensis Jin Tao
PSA_830† UNITUS 2011 Europe Spain Galicia Borguiera
Tomino
A. chinensis Jin Tao
PSA_822 UNITUS 2011 Europe Portugal Viana do Castelo Valença A. deliciosa Bo.Erica
PSA_832† UNITUS 2011 Europe Portugal Aveiro S.ta Maria da
Feira
A. deliciosa Hayward
PSA_834 UNITUS 2011 Europe Portugal Aveiro S.ta Maria da
Feira
A. deliciosa Hayward
PSA_2F† Anses 2010 Europe France Rhone Alpes - A. deliciosa Hayward
PSA_3F Anses 2010 Europe France Rhone Alpes - A. deliciosa Hayward
PSA_9F Anses 2011 Europe France Rhone Alpes - Actinidia sp. Unknown
PSA_LSV38-71
- 2011 Europe Switzerland - - Actinidia sp. Unknown
PSA_IT92* CRA-FRU 1992 Europe Italy Latium Latina A. deliciosa Hayward
PSA_2.34a
LTZ-Augustemberg
2013 Europe Germany Bavaria - A. chinensis Red
Sweetheart
PSA_2.34b
LTZ-Augustemberg
2013 Europe Germany Bavaria - A. chinensis
PSA_TEIC801 T.E.I. Crete 2014 Europe Greece Central Macedonia
Mylotopos Pellas A. deliciosa Hayward
PSA_TEIC805T.E.I. Crete 2014 Europe Greece Central Macedonia
Mylotopos Pellas A. deliciosa Hayward
PSA_TEIC806T.E.I. Crete 2014 Europe Greece Central Macedonia
Mylotopos Pellas A. deliciosa Hayward
PSA_TEIC807T.E.I. Crete 2014 Europe Greece Central Macedonia
Mylotopos Pellas A. deliciosa Hayward
PSA_TEIC819T.E.I. Crete 2014 Europe Greece Central Macedonia
Mylotopos Pellas A. deliciosa Hayward
PSA_TEIC823T.E.I. Crete 2014 Europe Greece Central Macedonia
Mylotopos Pellas A. deliciosa Hayward
PSA_TEIC824T.E.I. Crete 2014 Europe Greece Central Macedonia
Mylotopos Pellas A. deliciosa Hayward
PSA_TEIC826T.E.I. Crete 2014 Europe Greece Central Macedonia
Mylotopos Pellas A. deliciosa Hayward
PSA_K2T† Bastas K.K. 2011 Asia Turkey Rize - A. deliciosa Hayward
PSA_18804* ICMP 2010 Australasia New Zealand
Bay of Plenty Te Puke A. chinensis Hort 16A
PSA_18882 ICMP 2010 Australasia New Zealand
Nelson Motueka A. chinensis Hort 16A
PSA_19497 ICMP 2010 Australasia New Zealand
Bay of Plenty Te Puke A. chinensis Hort 16A
26
PSA_19486 ICMP 2013 Australasia Australia Western Australia - A. chinensis Unknown
PSA_19440 ICMP 2011 Australasia Australia Victoria - A. chinensis Unknown
PSA_18839 ICMP 2011 Australasia New Zealand
Bay of Plenty Te Puke A. deliciosa Hayward
PSA_18875† ICMP 2011 Australasia New Zealand
Bay of Plenty Te Puke A. deliciosa Hayward
PSA_19200 ICMP 2011 Australasia New Zealand
Auckland - Actinidia sp. Unknown
PSA_23663 KCTC 1989 Asia Korea Jeollanam-do Naju-si A. chinensis Unknown
PSA_23664† KCTC 1989 Asia Korea Jeollanam-do Naju-si A. chinensis Unknown
PSA_23665 KCTC 1989 Asia Korea Jeollanam-do Naju-si A. chinensis Unknown
PSA_K2† Koh Y.J. 1997 Asia Korea - - A. chinensis Unknown
PSA_K3 Koh Y.J 1999 Asia Korea Jeju-do Bukjeju-gun A. deliciosa Hayward
PSA_K4 Koh Y.J 1999 Asia Korea Jeollanam-do Wando-gun A. deliciosa Hayward
PSA_K5 Koh Y.J 2008 Asia Korea Jeju-do Nabeup-ri A. deliciosa Hayward
PSA_K6 Koh Y.J 2010 Asia Korea Jeju-do Tosan-ri A. chinensis Hort-16A
PSA_K7 Koh Y.J 2008 Asia Korea Jeju-do Tosan-ri A. chinensis Hort-16A
PSA_K8 Koh Y.J 2008 Asia Korea Jeju-do Sangmo-ri A. chinensis Hort-16A
PSA_K9 Koh Y.J 2008 Asia Korea Jeju-do Odeung-dong A. chinensis Hort-16A
PSA_K10 Koh Y.J 1999 Asia Korea Jeollanam-do Jindo-gun A. deliciosa Hayward
PSA_K11 Koh Y.J 2008 Asia Korea Jeollanam-do Wando-gun A. deliciosa Hayward
PSA_K12 Koh Y.J 2009 Asia Korea Jeju-do Tosan-ri A. chinensis Hort-16A
PSA_131WD Koh Y.J. 2013 Asia Korea Jeollanam-do Wando-eup A. chinensis Hong Yang PSA_132WD Koh Y.J. 2013 Asia Korea Jeollanam-do Wando-eup A. chinensis Hong Yang PSA_133WD Koh Y.J. 2013 Asia Korea Jeollanam-do Wando-eup A. chinensis unknown
new variety PSA_134WD Koh Y.J. 2013 Asia Korea Jeollanam-do Wando-eup A. chinensis unknown
new variety PSA_134KBS Koh Y.J. 2013 Asia Korea Jeollanam-do Yeongam-eup A. deliciosa Hayward
PSA_SYS1 Koh Y.J. 2011 Asia Korea Jeollanam-do Goheung-gun A. chinensis Unknown
PSA_SYS2 Koh Y.J. 2011 Asia Korea Jeollanam-do Goheung-gun A. chinensis Unknown
PSA_SYS4 Koh Y.J. 2011 Asia Korea Jeollanam-do Goheung-gun A. chinensis Unknown
PSA_KW1* Takikawa Y. 1984 Asia Japan Chūbu Shizuoka A. deliciosa Hayward
PSA_KW11* Takikawa Y. 1984 Asia Japan Chūbu Shizuoka A. deliciosa Hayward
PSA_KW30 CFBP 1984 Asia Japan Chūbu Shizuoka A. deliciosa Hayward
PSA_KW41* CFBP 1984 Asia Japan Chūbu Shizuoka A. deliciosa Hayward
PSA_PA429 CFBP 1987 Asia Japan - - A. chinensis Unknown
PSA_PA459* CFBP 1988 Asia Japan - - A. chinensis Unknown
PSA_2818 Takikawa Y. 2011 Asia Japan Chūbu Shizuoka A. chinensis Rainbow red
PSA_2819 Takikawa Y. 2011 Asia Japan Chūbu Shizuoka A. chinensis Rainbow red
PSA_2820 Takikawa Y. 2011 Asia Japan Shikoku Ehime A. deliciosa Hayward
PSA_2726 Takikawa Y. 2009 Asia Japan Chūbu Shizuoka A. deliciosa Unknown
PSA_CH2010-5
Huang L.L. 2010 Asia China Shaanxi Sheng
(Dangdong)
A. chinensis Hong Yang
PSA_CH2010-6*†
Huang L.L. 2010 Asia China Shaanxi Sheng
(Dangdong)
A. chinensis Hong Yang
PSA_CH2010-7
Huang L.L. 2010 Asia China Shaanxi Sheng
(Dangdong)
A. chinensis Hong Yang
PSA_M218 Zhao Z.B. 2010 Asia China Shaanxi Yangling
(Xianyang)
A. deliciosa Xi Xuan
PSA_M228 Zhao Z.B. 2010 Asia China Shaanxi Baoji (Mei
County)
A. chinensis Hong Yang
PSA_M23 Zhao Z.B. 2010 Asia China Shaanxi Baoji (Mei
County)
A. chinensis Hong Yang
PSA_M122 Zhao Z.B. 2010 Asia China Shaanxi Baoji (Mei
County)
A. chinensis Hong Yang
PSA_JILO4† UNITUS 2012 Asia China Anhui Yuexi A. chinensis JinFeng
PSA_JILO8 UNITUS 2012 Asia China Anhui Yuexi A. chinensis JinFeng
PSA_JILO16 UNITUS 2012 Asia China Anhui Yuexi A. chinensis JinFeng
27
PSA_JILO21 UNITUS 2012 Asia China Anhui Yuexi A. chinensis JinFeng
PSA_JILO22 UNITUS 2012 Asia China Anhui Yuexi A. chinensis JinFeng
PSA_JILO23 UNITUS 2012 Asia China Anhui Yuexi A. chinensis JinFeng
PSA_JILO24 UNITUS 2012 Asia China Anhui Yuexi A. chinensis JinFeng
PSA_JILO26 UNITUS 2012 Asia China Anhui Yuexi A. chinensis JinFeng
PSA_JILO27 UNITUS 2012 Asia China Anhui Yuexi A. chinensis JinFeng
PSA_JILO30 UNITUS 2012 Asia China Anhui Yuexi A. chinensis JinFeng
PSA_LOLO1 UNITUS 2012 Asia China Guizhou Xiu Wen A. deliciosa Guichang
PSA_LOLO3 UNITUS 2012 Asia China Guizhou Xiu Wen A. deliciosa Guichang
PSA_LOLO4 UNITUS 2012 Asia China Guizhou Xiu Wen A. deliciosa Guichang
PSA_LOLO5 UNITUS 2012 Asia China Guizhou Xiu Wen A. deliciosa Guichang
PSA_LOLO6 UNITUS 2012 Asia China Guizhou Xiu Wen A. deliciosa Guichang
PSA_LOLO12 UNITUS 2012 Asia China Guizhou Xiu Wen A. deliciosa Guichang
PSA_LOLO13 UNITUS 2012 Asia China Guizhou Xiu Wen A. deliciosa Guichang
PSA_LOLO14 UNITUS 2012 Asia China Guizhou Xiu Wen A. deliciosa Guichang
PSA_LOLO15 UNITUS 2012 Asia China Guizhou Xiu Wen A. deliciosa Guichang
PSA_LOLO16 UNITUS 2012 Asia China Guizhou Xiu Wen A. deliciosa Guichang
PSA_LOLO17 UNITUS 2012 Asia China Guizhou Xiu Wen A. deliciosa Guichang
PSA_LOLO18 UNITUS 2012 Asia China Guizhou Xiu Wen A. deliciosa Guichang
PSA_LOLO20 UNITUS 2012 Asia China Guizhou Xiu Wen A. deliciosa Guichang
PSA_LOLO21 UNITUS 2012 Asia China Guizhou Xiu Wen A. deliciosa Guichang
PSA_LOLO26 UNITUS 2012 Asia China Guizhou Xiu Wen A. deliciosa Guichang
PSA_LOLO27 UNITUS 2012 Asia China Guizhou Xiu Wen A. deliciosa Guichang
PSA_LOLO28 UNITUS 2012 Asia China Guizhou Xiu Wen A. deliciosa Guichang
PSA_LOLO29 UNITUS 2012 Asia China Guizhou Xiu Wen A. deliciosa Guichang
PSA_LOLO31 UNITUS 2012 Asia China Guizhou Xiu Wen A. deliciosa Guichang
PSA_LOLO32 UNITUS 2012 Asia China Guizhou Xiu Wen A. deliciosa Guichang
PSA_LOLO37 UNITUS 2012 Asia China Guizhou Xiu Wen A. deliciosa Guichang
PSA_LOLO38 UNITUS 2012 Asia China Guizhou Xiu Wen A. deliciosa Guichang
PSA_LOLO39 UNITUS 2012 Asia China Guizhou Xiu Wen A. deliciosa Guichang
PSA_LOLO40 UNITUS 2012 Asia China Guizhou Xiu Wen A. deliciosa Guichang
PSA_LOLO41 UNITUS 2012 Asia China Guizhou Xiu Wen A. deliciosa Guichang
PSA_LOLO42 UNITUS 2012 Asia China Guizhou Xiu Wen A. deliciosa Guichang
PSA_INS UNITUS 2012 Asia China Anhui Yuexi Insect (Cicadellidae)
PSA_HAXA1 UNITUS 2012 Asia China Shaanxi Xi’an A. deliciosa Hayward
PSA_HAXA2 UNITUS 2012 Asia China Shaanxi Xi’an A. deliciosa Hayward
PSA_HAXA3 UNITUS 2012 Asia China Shaanxi Xi’an A. deliciosa Hayward
PSA_HAXA4 UNITUS 2012 Asia China Shaanxi Xi’an A. deliciosa Hayward
PSA_HAXA5 UNITUS 2012 Asia China Shaanxi Xi’an A. deliciosa Hayward
PSA_HAXA6 UNITUS 2012 Asia China Shaanxi Xi’an A. deliciosa Hayward
PSA_HAXA7 UNITUS 2012 Asia China Shaanxi Xi’an A. deliciosa Hayward
PSA_HAXA8 UNITUS 2012 Asia China Shaanxi Xi’an A. deliciosa Hayward
PSA_HYM1 UNITUS 2012 Asia China Sichuan Mian Yang A. chinensis Hong Yang
PSA_HYM2 UNITUS 2012 Asia China Sichuan Mian Yang A. chinensis Hong Yang
PSA_HYM3 UNITUS 2012 Asia China Sichuan Mian Yang A. chinensis Hong Yang
PSA_HYM4 UNITUS 2012 Asia China Sichuan Mian Yang A. chinensis Hong Yang
PSA_MC1 Zhu L.W. 2013 Asia China Anhui Jinzhai Setaira viridis
(L.) Beauv.
-
PSA_MC2 Zhu L.W. 2013 Asia China Anhui Jinzhai Setaira viridis
(L.) Beauv.
-PSA_HWD3 Zhu L.W. 2012 Asia China Shaanxi Xi’an A. deliciosa
-PSA_HWD4 Zhu L.W. 2012 Asia China Shaanxi Xi’an A. deliciosa
-PSA_HWD5 Zhu L.W. 2012 Asia China Shaanxi Xi’an A. deliciosa
-PSA_AHPP5 Zhu L.W. 2013 Asia China Anhui Yuexi Philagra
quadrimaculata Schmidt
-28
PSA_AHPP7 Zhu L.W. 2013 Asia China Anhui Yuexi Philagra
quadrimaculata Schmidt
-PSA_GMC3 Zhu L.W. 2013 Asia China Anhui Jinzhai Alternanthera
philoxeroides (Mart.) Griseb.
-PSA_GMC2 Zhu L.W. 2013 Asia China Anhui Jinzhai Alternanthera
philoxeroides (Mart.) Griseb.
-PSA_JZHY7 Zhu L.W. 2013 Asia China Anhui Jinzhai A. deliciosa
-PSA_JZZM11 Zhu L.W. 2013 Asia China Anhui Jinzhai A. deliciosa
-PSA_WT1 Zhu L.W. 2013 Asia China Anhui Yuexi Pauwlonia
fortunei (Seem.) Hemsl.
-PSA_SH5 Zhu L.W. 2013 Asia China Shanghai Jiading A. deliciosa
-PSA_WT2 Zhu L.W. 2013 Asia China Anhui Yuexi Pauwlonia
fortunei (Seem.) Hemsl
-PSA_SCHY24 Zhu L.W. 2013 Asia China Sichuan Pengzhou A. deliciosa
-PSA_SCHY25 Zhu L.W. 2013 Asia China Sichuan Pengzhou A. deliciosa
-PSA_SH28 Zhu L.W. 2013 Asia China Shanghai Jiading A. deliciosa
-PSA_19439* ICMP 2011 South
America
Chile VII Region of Maule
- A. deliciosa unknown new variety
PSA_19457 ICMP 2010 South
America
Chile VII Region of Maule
- A. deliciosa unknown variety
PSA_19438 ICMP 2011 South
America
Chile VII Region of Maule
- A. deliciosa unknown new variety
PSA_19456 ICMP 2010 South
America
Chile VII Region of Maule
- A. chinensis unknown variety PSA_1_Chile SAG-Chile 2013 South
America
Chile VII Region of Maule
San Javier A. deliciosa Hayward
PSA_2_Chile SAG-Chile 2013 South America
Chile Bio Bio San Carlos A. deliciosa Hayward
PSA_3_Chile SAG-Chile 2013 South America
Chile VII Region of Maule
Longavi A. deliciosa Hayward
PSA_4_Chile SAG-Chile 2013 South America
Chile VII Region of Maule
Retiro A. deliciosa Hayward
PSA_5_Chile SAG-Chile 2013 South America
Chile Bio Bio San Carlos A. deliciosa Hayward
PSA_6_Chile SAG-Chile 2013 South America
Chile VII Region of Maule
Talca A. deliciosa Hayward
PSA_7_Chile SAG-Chile 2013 South America
Chile VII Region of Maule
Longavi A. chinensis Kis Y374
PSA_8_Chile SAG-Chile 2013 South America
Chile VII Region of Maule
29
PSA_9_Chile SAG-Chile 2013 South America
Chile Bio Bio San Ignacio A. deliciosa Hayward
PSA_10_Chile SAG-Chile 2013 South America
Chile VII Region of Maule
Vila Alegre A. deliciosa Hayward
PSA_11_Chile SAG-Chile 2013 South America
Chile VII Region of Maule
San Javier A. deliciosa Hayward
PSA_12_Chile SAG-Chile 2013 South America
Chile Bio Bio Bulnes A. deliciosa Hayward
PSA_13_Chile SAG-Chile 2014 South America
Chile VII Region of Maule
Molina A. deliciosa Matua
PSA_14_Chile SAG-Chile 2013 South America
Chile Bio Bio San Ignacio A. deliciosa Hayward
PSA_15_Chile SAG-Chile 2013 South America
Chile VII Region of Maule
Retiro A. deliciosa Hayward
PSA_16_Chile SAG-Chile 2013 South America
Chile VII Region of Maule
Colbun A. deliciosa Hayward
PSA_17_Chile SAG-Chile 2013 South America
Chile Bio Bio San Ignacio A. deliciosa Hayward
PSA_18_Chile SAG-Chile 2013 South America
Chile Bio Bio Bulnes A. deliciosa Hayward
PSA_19_Chile SAG-Chile 2013 South America
Chile VII Region of Maule
Vila Alegre A. deliciosa Hayward
PSA_20_Chile SAG-Chile 2013 South America
Chile VII Region of Maule
Retiro A. deliciosa Hayward
PSA_21_Chile SAG-Chile 2013 South America
Chile Bio Bio Bulnes A. deliciosa Hayward
PSA_22_Chile SAG-Chile 2013 South America
Chile Bio Bio San Ignacio A. deliciosa Hayward
PSA_23_Chile SAG-Chile 2014 South America
Chile VII Region of Maule
Molina A. deliciosa Matua
PSA_24_Chile SAG-Chile 2013 South America
Chile VII Region of Maule
Yerbas Buenas A. deliciosa Hayward
PSA_25_Chile SAG-Chile 2013 South America
30
5. RESULTS
5.1 In silico search of candidate VNTRs
Each of the three genomes analyzed by TRDB gave one set of Tandem Repeats (TRs): in particular CFBP7286 turns out to have 157 TRs, CH2010-6 186 and M302091 104. These groups were then compared two by two by Position Comparison tool and primers were designed where possible, discarding TRs with lacking or too short sequenced flanking regions.
The main features of VNTR loci passing the screening phase, such as position on WGS sequence of the strain M302091 (NCBI WGS Project AEAL01) and putative function of open reading frames (ORFs) interested by VNTR amplicons are listed in table 3.
5.2 PCR and capillary electrophoresis
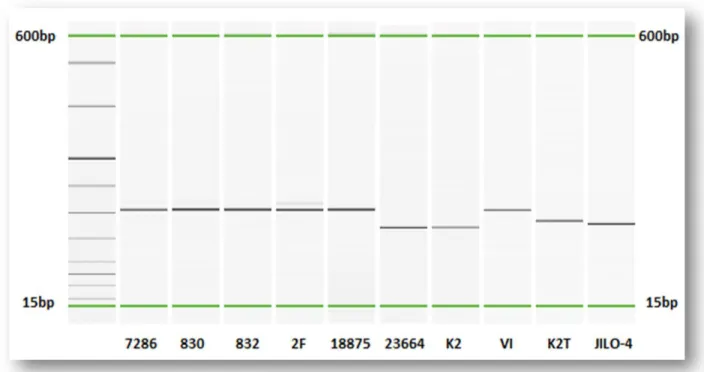
In the screening phase, all the VNTRs loci tested were properly amplified and produced a single clear amplicon of identical dimensions in reiterated experiments. The first screening of the whole panel of 18 VNTRs on 10 representative strains has led to the selection of 12 polymorphic VNTRs (Table 4) with adequate discriminatory power(Fig. 6), and to the exclusion of 6 loci (2 loci on 10 from our selection, and 4 on 8 from the panel from Gironde & Manceau) that have always produced indifferently the same amplicons among all the tested Psa strains.
The panel of the remaining 12 VNTRs (8 from this study and 4 from GM set) was then used to amplify 168 Psa in total whose identity was previously confirmed by other molecular assays (data not shown); some VNTRs showed a discrete discriminatory power even if considered singularly (Fig. 7), whilst others described a narrow number of allelic variation. 10 on 12 VNTR loci were successfully amplified with all the strains, whilst the locus Psa-9 failed to amplify all the 6 strains belonging to low virulent strains from New Zealand and Australia, and the 5 strains isolated in South Korea during 2013 in Wando-eup area (PSA_131WD-PSA_134KBS), and the locus GM285 failed to amplify again all the 6 strains belonging to Psa-4 haplotype. The missing amplification was coded as -1 in the matrix of repeat numbers to be used for the subsequent computational analysis.
31
In some cases, the number of TRs obtained from capillary analysis didn’t fit correctly with data obtained from those strains whose WGS sequences are deposited in NCBI; each ambiguous datum was definitely resolved by sequencing the corresponding amplicon and counting manually the entire and truncated repetitions (data not shown).
Only when the data for all the VNTR loci and all the 168 Psa strains were definitely validated by double repetition of the whole process (PCR and capillary electrophoresis), and by sequencing of amplicons of all the VNTR loci for 3 representative strains and of those loci in which the number of TRs resulted out of line with WGS data, any further elaboration was performed. Sequencing allowed also to find out the particular structure of Psa-7 locus: it is made up of a polymorphic repeated unit followed by a monomorphic region and again the same polymorphic repeated sequence. Within statistical elaboration, every TR was considered singularly as a VNTR locus, named Psa-7A and Psa-7B, leading the MLVA panel from 12 to 13 loci. Details for each VNTR locus about amplicons dimensions, length of the flanking regions, number of repeats, truncated repeats are reported in table 4.
5.3 General characteristics of MLVA panel
Among 168 Psa strains, 72 haplotypes were overall detected pooling the data from 13 VNTRs, and the number of alleles per locus varied from 3 (GM2852) to 13 (GM1019). The correlation between number of alleles and length of TR was evaluated (Fig. 8). The HGDI and Simpson’s diversity indexes were assessed for each VNTR locus and ranged respectively from 0,427 to 0,855, and from 0,423 to 0,847; the complete diversity indices results are reported in table 5.
Additional information of key significance for a correct interpretation of VNTR data were achieved by direct sequencing of a selection of VNTRs amplicons. In particular, apart the amplification failure of 2 on 12 VNTR loci, other anomalies were detected in Psa strains referable to the low virulent group (haplotype Psa-4): the VNTR Psa-1 usually has a right flanking region of 80 nucleotides, but the corresponding sequence of all the 6 low virulent strains tested lacks in 7 nucleotides at position 32-38 after the end of TRs, so that for the calculation of exact number of TRs for strains belonging to low virulent haplotype, 7 base pairs have to be previously detracted from the sum of flanking regions (136 bp instead of 143); similarly, in VNTR Psa-3, the left
32
flanking region of low virulent strains misses of 2 nucleotides in position 74-75 from the beginning of the amplicon; again, one additional nucleotide is retrievable in right flanking region of VNTR Psa-4 of low virulent strains. Furthermore, several single nucleotide polymorphisms can be detected in flanking regions of the same low virulent strains.
However, also in few other Psa strains discrepancies were found: the left flanking region of VNTR GM285 have different lengths according to the geographic origin of the strains: in fact, European, Chinese, Chilean and New Zealander virulent strains have a 133 bp left flanking region, whilst the correspondent region in Japanese and Korean strains have 125 bp.
5.4 Elaboration by “diversity panel”
Bionumerics elaboration was firstly carried out on the whole set of 168 Psa isolates considering only the 6 loci showing a haplotypes number equal to or up to 5 plus Psa-1 (6 haplotypes) inserted in the “diversity panel” (Psa-1, Psa-4, Psa-7B, Psa-9, GM1613, GM2852; Tab. 4 marked by *). Clonal complex (CC) was defined as similarity group including strains displaying not more than 2 differences on 6 loci of the MLVA profile or in other words dissimilar for less than approximately 33%.
UPGMA dendrogram and MST were generated and it was noticed that they were perfectly adaptable and consistent between them and in respect to previously determined division into 4 populations or haplotypes, obtained mostly from more expensive and time-consuming techniques such as genome-wide SNPs analysis (McCann, 2013) (Fig. 9) and MLSA (Chapman, 2012) (Fig. 10).
Overall categorical MST analysis provided 9 clonal complexes and 2 singletons (Fig. 10).
5.5 Elaboration by whole MLVA panel
The whole panel of 13 VNTR loci was applied to the entire collection of Psa to perform even in this case a categorical MST; however, because of the more congruous number of loci, cut-off value for determining clonal complexes was set at 3 differences on 13, corresponding to a percentage of dissimilarity of about 23%.
33
11 clonal complexes and 5 singletons resulted from the elaboration (Fig. 11).
The 3 macrogroups (Japan-Korea, China and Hypervirulent) were analyzed separately by applying the 13 loci MLVA panel to better elucidate subtle differences within every single group, with the exception of Psa-LV from Australia and New Zealand excluded from the subsequent elaboration as they shared only 2 loci on 13 with the nearest “China CC E”.
Japan and South Korea strains were analyzed together because of several interconnections between them: overall they were comprised into 5 CCs and 4 singletons (Fig. 12): “Japan CC A” and “Japan CC C” constituted exclusively by Japanese strains; “Japan-Korea CC B” grouping Korean, Japanese and the Italian strain of 1992 PSA_IT92; “Korea CC D” composed by most of the Korean strains and the Turkish PSA_K2T; “Korea CC E” made of Korean strains.
“Japan CC A” is formed by PSA_2818 and PSA_2819, both isolated in 2011 in Chūbu region (Shizuoka), whilst the remaining 4 strains from the same site but dated back to 1984 (PSA_KW1, PSA_KW11, PSA_KW30 and PSA_KW41) were included in “Japan-Korea CC B”, together with PSA_IT92 (Italy, 1992), PSA_23663 and PSA_23664, both from South Korea (Jeollanam, Naju-si) isolated in 1989. The two Japanese strains PSA_PA429 and PSA_459, isolated respectively in 1988 and 1989 from unknown locality, formed the “Japan CC C”. “Korea CC D” encompassed the most of the analyzed Korean strains characterized by various site and date of isolation: PSA_K3 (1993), PSA_K5 (2008), PSA_K6 (2010), PSA_K7 (2008), PSA_K8 (2008), PSA_K9 (2008), PSA_K12 (2009) coming from Jeju region but from different localities; PSA_K4 (1999), PSA_K10 (1999) PSA_K11 (2008), PSA_131WD (2013), PSA_132WD (2013), PSA_133WD (2013), PSA_134WD (2013) and PSA_134KBS (2013) all isolated from several zones of Jeollanam region. Moreover in the “Korea CC D” also the unique Turkish strain of the study was found out (PSA_K2T, Rize, 2011), suggesting an intercontinental contagion event. The last clonal complex, “Korea CC E” was made up of PSA_SYS1, PSA_SYS2 and PSA_SYS4, homogenous for year and site of isolation (Jeollanam, Goheung-gun, 2011). Japan-Korea group encompasses the greatest number of singletons, two from Korea and two from Japan, in respect to China and Hypervirulent ones: PSA_23665 (Korea, Jeollanam, Naju-si, 1989), PSA_2820 (Japan, Shikoku, Ehime, 2011), PSA_2726 (Japan, Chūbu, Shizuoka, 2009), PSA_K2 (Korea, unknown location, 1997).
China group resulted to be the most variegated and it was described by 6 clonal complexes, generally corresponding to geographic region of provenience (Fig. 13).
34
“China CC A” included all the strains isolated in 2012 in Guizhou region (Guiyang, district of Xiuwen): PSA_LOLO1, PSA_LOLO3, PSA_LOLO4, PSA_LOLO5, PSA_LOLO6, PSA_LOLO12, PSA_LOLO13, PSA_LOLO14, PSA_LOLO15, PSA_LOLO16, PSA_LOLO17, PSA_LOLO18, PSA_LOLO20, PSA_LOLO21, PSA_LOLO26, PSA_LOLO27, PSA_LOLO28, PSA_LOLO29, PSA_LOLO31, PSA_LOLO32, PSA_LOLO37, PSA_LOLO38, PSA_LOLO39, PSA_LOLO40, PSA_LOLO41, PSA_LOLO42). Moreover, PSA_HYM1 (Sichuan, Deyang, district of Mianzhu) and PSA_HAXA4 (Shaanxi, Xi’an, district of Huxian) both isolated in 2012 were found in this clonal complex. “China CC B” consisted of 5 strains coming from different locality in Shaanxi region in 2010: PSA_CH2010-5, PSA_CH2010-6, PSA_CH2010-7 (Sheng, district of Dangdong); PSA_M23, PSA_M122 (Baoji, district of Mei). In the initial 13 loci-elaboration on the whole set of Psa (Fig. 11) the “China CC B” was included in the same clonal complex of the Hypervirulent group, making suppose that Shaanxi province could be the start point of 2008 lethal outbreak. “China CC C” resulted to be formed by only 2 strains, PSA_SCHY24 and PSA_SCHY25, both isolated in Pengzhou in Sichuan region in 2013. All the strains belonging to “China CC D” were isolated in Jinzhai in the Anhui region in 2013, but the peculiarity is that they resided on several hosts, two of which different from Actinidia spp.: PSA_GMC3, PSA_GMC2 were isolated from Alternanthera philoxeroides, PSA_MC1 and PSA_MC2 from Setaira viridis and PSA_JZZM11 from Actinidia deliciosa. “China CC E” was a very heterogeneous group concerning especially area of isolation and hosts, including: all the strains of 2012 hailing from Anqing, district of Yuexi, Anhui region (PSA_JILO4, PSA_JILO8, PSA_JILO16, PSA_JILO17, PSA_JILO21, PSA_JILO22, PSA_JILO23, PSA_JILO24, PSA_JILO26, PSA_JILO27, PSA_JILO30); PSA_HAXA1, PSA_HAXA2, PSA_HAXA3, PSA_HAXA5, PSA_HAXA6, PSA_HAXA7, PSA_HAXA8 from Shaanxi region (Xi’an, district of Huxian) in 2012; PSA_HYM2, PSA_HYM3, PSA_HYM4 from Sichuan region (Deyang, Mianzhu) in 2012; PSA_INS isolated in 2012 from an insect belonging to Cicadellidae found in Anhui region (Anqing, district of Yuexi); PSA_AHPP5 and PSA_AHPP7 isolated in 2013 from Philagra
quadrimaculata in Anhui region (Anqing, district of Yuexi); PSA_HWD3, PSA_HWD4,
PSA_HWD5 isolated in 2012 from Xi’an in Shaanxi region; PSA_WT1 and PSA_WT2 found on
Pauwlonia fortunei in 2013 in Anhui region (Anqing, district of Yuexi); PSA_SH5 and PSA_SH28
isolated from Jiading in Shangai region in 2013. Furthermore, “China CC E” is the group most similar to the unique Hypervirulent singleton PSA_2.34b from Germany, with whom it shared 9