UNIVERSITY OF CATANIA
DEPARTMENT OF DRUG SCIENCESBIOCHEMISTRY SECTION
PhD in BASIC AND APPLIED BIOMEDICAL SCIENCES Coordinator: Prof. Massimo Libra
MARIA DOMENICA DI MAURO
BIOMOLECULES FROM OLIVE MILL WASTEWATER:
COSMECEUTICAL AND NUTRACEUTICAL APPLICATIONS
PhD Degree
SUPERVISOR
Prof. Marcella Renis
ASSISTANT SUPERVISORS
Dr. Nicola D’Antona Dr. Barbara Tomasello
2
INDEX
ABSTRACT 4
PREMISE 9
CHAPTER I – INTRODUCTION 11
1.1 Olive mill wastewater 11
1.2 Sugars and minerals for cosmeceutical application 14
1.3 Hydroxytyrosol and its biological effects 15
1.3.1 Effects on reactive oxygen species in cancer cells 16
1.3.2 Effects on cell cycle in cancer cells
19
1.3.3 Effects on apoptosis/necrosis in cancer cells 21
1.3.4 Epigenetic modulation 24
1.4 Cell lines 28
1.4.1 MRC-5 cell line 28
1.4.2 1321N1 cell line 29
CHAPTER II – AIMS 31
CHAPTER III – MATERIALS AND METHODS 32
3.1 Materials 32
3.2 Methods for chemical analysis of OMWW 32
3.2.1 OMWW pretreatment and physicochemical analysis 32
3.2.2 Total phenolic content
33
3.2.3 Total flavonoid content 33
3.2.4 HPLC-DAD analysis 34
3
3.2.6 Stability studies 35
3.3 Methods for cosmeceutical application 35
3.3.1 Preparation of sugars and minerals enriched fraction (SMEF) 35
3.3.2 Chemical characterization of SMEF lyophilized fraction 35
3.3.3 In vitro study 37
3.3.4 Formulation, metal analysis and long-term stability study 41
3.3.5 In vivo evaluation of moisturizing properties 42
3.4 Methods for nutraceutical application 43
3.4.1 Preparation of hydroxytyrosol-enriched fraction (H-EF) 43
3.4.2 In vitro study 43
3.5 Statistical analysis 48
CHAPTER IV – RESULTS 49
4.1 Chemical analysis of OMWW 49
4.2 Studies for cosmeceutical application of lyophilized SMEF 54
4.3 Studies for nutraceutical application of H-EF 61
CHAPTER V – DISCUSSION 71
5.1 Chemical analysis of OMWW 71
5.2 Studies for cosmeceutical application of lyophilized SMEF 73
5.3 Studies for nutraceutical application of H-EF 78
CHAPTER VI – CONCLUSIONS 84
REFERENCES 86
ADDITIONAL INFORMATIONS 95
4
ABSTRACT
Background
Green Chemistry is an emerging approach which aims at achieving sustainability at the molecular level in all industry sectors, by eliminating the use and generation of hazardous substances (Anastas and Warner, 2007; Anastas and Eghbali, 2010) and producing huge amounts of high added value by-products useful in different fields, such as pharmaceutical, nutraceutical, cosmetic and food (Ferri et al., 2016; Routray and Orsat, 2017, Schieber 2017). In this scenario, the project of the present research has been planned. We focusedon olive mill wastewater (OMWW), the main by-product of the olive oil extraction process, constituted by vegetable water of the fruit and the water used in different stages of oil extraction. Its composition is strictly dependent on olive cultivar, ripeness of the fruit, processing techniques, climate and storage conditions (Obied et al., 2008). OMWW contain water, sugars and mineral salts other than proteins, polyalcohols, organic acids, oil residues and polyphenols; among these the most abundant being hydroxytyrosol, a biophenol with a lot of beneficial effects on human health, as anticancer activities (Cabrera et al., 1996).
Aims of our research
Due to the importance of olive oil in the economy of Sicily, our group has beentrying to evaluate the nutraceutical properties of OMWW and, in particular, of the hydroxytyrosol component. Indeed, the aims of my doctorate project were to evaluate:
1) some possible differencesbetween the chemical composition of two OMWW generated from different Sicilian olive cultivar (Cerasuola and Nocellara etnea);
2) safety and the moisturizing properties of a sugars and minerals enriched fraction (SMEF), obtained from Cerasuola-OMWW, by in vitro and in vivo studies;
5
3) the chemotherapeutic activities in vitro exhibitedby hydroxytyrosol-enriched fraction (H-EF) obtained from Cerasuola-OMWW. As control, we used hydroxytyrosol commercial standard (HTyr).
Results
Chemical analysis of OMWW
Cerasuola-OMWW and Nocellara etnea-OMWW are similar for mildly acidic pH, high levels of COD, sugars, nitrogen and minerals, but total phenolic and flavonoid content is almost double in Cerasuola-OMWW with respect to Nocellara etnea-OMWW.
HPLC analysis evidenced that hydroxytyrosol and tyrosol were the most abundant biophenols present in both OMWW. The chromatograms highlighted a quantitative rather than a qualitative difference in the polyphenolic profiles of Cerasuola-OMWW and Nocellara etnea-OMWW. Both waters were able to quench the DPPH radical, in a dose dependent manner, and had a higher radical scavenging activity than the positive standard hydroxytyrosol, probably due to the synergistic effect of other phenolic compounds present in OMWW.
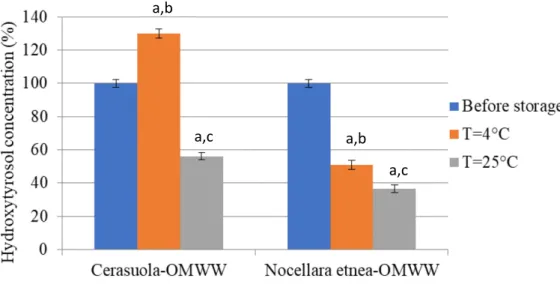
Storage condition of OMWW affected phenols and flavonoids stability and hydroxytyrosol concentration being both decreased, especially in Nocellara etnea-OMWW, in a temperature- and time-dependent manner, when stored at 4°C and 25°C for 45 days. Conversely, a slight increase was observed in Cerasuola-OMWW samples stored in the same way, probably due to the hydrolysis of oleuropein and verbascoside.
However, no significant changes were observed in total phenolic, flavonoid and hydroxytyrosol content in both OMWW samples whenstored at -20°C for 6 months.
6 Cosmeceutical application of lyophilized SMEF
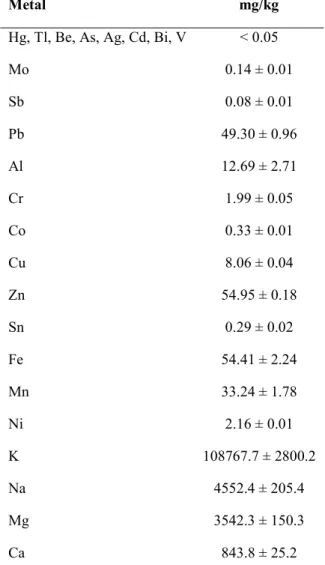
The lyophilized SMEF obtained from Cerasuola-OMWW was rich in sugars (around 43%) and potassium in accordance with literature data. In contrast, soluble polysaccharides were not identified probably because these compounds were highly diluted in OMWW or were hydrolyzed in their monosaccharide units due to the acidic pH of the sample.
The in vitro study performed on MRC-5 cells has evidenced that:
- the lowest concentrations of lyophilized SMEF (0.5% and 1% w/w) did not influence cell viability either after 6 or 24 hours of treatment. Conversely, the highest concentrations (2%, 5% and 10% w/w) determined a drastic decrease of cell viability in a dose- and time-dependent manner;
- the degree of apoptosis and intracellular ROS levels increased, in treated fibroblasts compared to untreated controls, in a dose- and time-dependent way, in particular from 2% concentration to 5% w/w;
- the DNA damage extent increased for the 2% and 5% SMEF treatment only in a concentration-dependent manner; this early SMEF-induced DNA injury may result from the hypertonicity of the culture medium, that increased from 0.278 Osm kg−1 for the
basic medium up to 0.579 Osm kg−1 for the medium supplemented with 5% of the SMEF,
or a low DNA repair capability by glucose genetic control as suggested by Pang et al.2012;
- the increase of ROS levels was well correlated to cell viability (r = 0.9661, p = 0.007), TUNEL+ cells (r = 0.9945, p = 0.005) and DNA fragmentation (r = 0.9540, p = 0.012) only at 24 hours as shown by Pearson test;
- the treatment with the highest concentrations of SMEF for 6h induced early alterations of cell morphology as shrunken cytoplasm and numerous blebs and ruffles on the cell surface. These morphological alterations, expression of the compromised cellular redox
7
status with the involvement of DNA damage, may be produced by the possible formation of inter/intramolecular hydrogen bonds and/or by the presence of pores in the multiple membranes.
Taking into account these data, 1% w/w of lyophilized SMEF was incorporated in an emulsion (F1) to formulate a body cream having a pH value weakly acidic (5.62 ± 0.02), compatible with the skin pH range (4.1-5.8). In addition, the results of ICP-MS analysis evidenced a heavy metals content below limits provided by Italy, German Federal Government and Canada (BfR 2006; Bocca et al., 2014; Health Canada-Santé Canada, 2012).
As obtained by stability studies, F1 emulsion, stored at 25°C±2°C with 60±5% R.H., did not show a significant change over time neither in pH nor in exterior aspect and showed only a minimal browning when stored at 40°C±2°C with 60±5% R.H. for 6 months. In addition, no significant changes in pH, phase separation and/or exterior aspect were observed in F1 samples with respect to base formulation (F0). The in vivo study showed that F1 containing lyophilized SMEF (1% w/w) determined an % increase of skin hydration (Group A:122.72%) with respect to F0 (Group B: 57.69%) after 7 days of body cream application and also with respect to day 0. These data are in accordancewith the results of other authors who have investigated different cosmetic formulations for their hydration properties (Fujioka et al., 2009; Wanitphakdeedecha et al., 2011).
Nutraceutical application of H-EF
H-EF added at different concentration in astrocytoma cells decreases cell viability, in a dose- and time-dependent manner, induced arrest in G1 phase and inhibited cell migration accordingly (Bassani et al., 2016). These data are in accordance with the observed time-dependent increase in DNA damage and the decrease in p53 and p21 expression, two
8
proteins considered to be guardians of the genoma. An increase in ROS level with a parallel decrease in GSH level seemed to be involved in the genotoxic effect-EF- induced in astrocytoma cells. In addition, by investigating some possible epigenetic effects exerted by our extract, we observed a modulation of global DNA methylation expressed as hypomethylation at lowest concentration (50 µM) and hypermethylation when the cell treatment was performed at 100 µM. The additional epigenetic parameters we studied, SIRT1 expression and nuclear sirtuins activities, were both decreased.
We observed different dose- and time-dependent effect for hydroxytyrosol (HTyr) 100 µM. The compound did not influence cell viability either after 24 or 48 hours of treatment but
induced an arrest in S phase at 24 h and in G1 phase only at 48 h. In addition, it increased p53 expression without inducing any change in p21 expression and, finally, it hypomethylated DNA and increased both SIRT 1 expression and nuclear sirtuins activity.
Conclusion
Our results encourage the use of OMWW from some Sicilian cultivars for the production of both H-EF and SMEF. In view of that, we demonstrated the safe use of SMEF in cosmeceutical field for the first time. Conversely, H-EF showed potentiality for the development of nutraceutical and/or dietary supplements, being potentially helpful in the prevention and/or integrative treatment of lifestyle-associated pathologies such as cancer. Still, considering also the extract capability in modulating oxidative status and epigenetic activity, it could find application in other diseases, as cardiovascular, metabolic and neurodegenerative. However, it is clear that its possible therapeutic use in humans requires additional studies on its action mechanism and synergic effect in vivo, other than applications in clinical trials.
9
PREMISE
Green Chemistry and valorization of food by-products
Green Chemistry, first defined at the beginning of 1990s as the “design of chemical products and processes to reduce or eliminate the use and generation of hazardous substances”, is not a new branch of science, but an emerging and different approach which aims at achieving sustainability at the molecular level, finding several applications in all industry sectors (Anastas and Warner, 2007, Anastas and Eghbali, 2010).
Green Chemistry works as an integrated cohesive system of principles or design criteria (Anastas and Eghbali, 2010). The Twelve Principles of Green Chemistry, introduced in 1998 by Paul Anastas and John Warner, are shown in Figure 1.
10
The first principle of Green Chemistry states it is better to prevent the formation of waste rather than to clean it up. However, when the production of wastes cannot be avoided, innovative solutions should be considered.
It is well known that food industries are responsible for the production of more than 25 billion ton CO2- eq. (Schmidt and Merciai, 2014) other than huge amounts of solid and liquid
wastes and by-products including fruit pomace, seeds, spent grain powders and liquid effluents (Ferri et al., 2016; Routray and Orsat, 2017). During these recent years, researchers and the industrial community have been attracted by food processing by-products since they contain high added value compounds, as polyphenols, vitamins, minerals and dietary fibers, which can be recovered and find useful applications in pharmaceutical, nutraceutical, cosmetic and food fields (Ferri et al., 2016; Schieber 2017).
Rodrigues et al. (2016) have evaluated the potential application of coffee silverskin extract in cosmetic formulations with antioxidant activity; Denis et al. (2013) have reported the beneficial effects of apple peel polyphenols on oxidative stress and inflammation; Aliakbarian et al. (2012) have demonstrated that polyphenols-enriched extract from olive pomace exerts an antioxidant activity which is able to modulate the response of endothelial cells to oxidative stress, representing a new strategy for the treatment and chemoprevention of endothelial dysfunction and vascular disease.
Literature data certainlyreport so many examples of recovery of bio-active compounds from different food by-products and their relative applications, but our interest has been focused on the valorization of olive mill wastewater, the main by-product of the olive oil extraction process.
11
CHAPTER I
INTRODUCTION
1.1 Olive mill wastewaterOlive mill wastewater (OMWW),which is composed of vegetable water of the fruit and the water used in different stages of oil extraction, represent the main by-product of olive oil industry (Roig et al., 2006). Huge amounts of OMWW, ranging from 7 to 30 million m3, are
produced annually in the world. However, the amount of OMWW produced depends on the method used for the olive oil extraction process. Traditional discontinuous pressing process adding a small amount of water, generates small volumes of OMWW (40 to 60 L/100 kg olives); differently from continuous three-phase decanter process producinghigher volumes of OMWW (80–120 L/100 kg olives), because of higher amounts of water used in the process (Dermeche et al., 2013).
12
OMWW are characterized by a dark color (Figure 2), a mildly acidic pH, high electrical
conductivity and high organic content (biochemical oxygen demand (BOD) of 35-132 g/L, chemical oxygen demand (COD) of 30-320 g/L) (Dermeche et al., 2013).
OMWW chemical composition is strictly related to different parameters such as olive cultivar, ripeness of the fruit, processing techniques, climate and storage conditions (Dermeche et al., 2013; Obied et al., 2008) but generally OMWW contain water (83-94%), organic matter (4-16%) and mineral salts (0.4-2.5%), potassium being the most abundant, followed by calcium, sodium and magnesium,alongside carbonates and phosphates.
The organic matter is mainly composed of sugars (13-53%), polyphenols (2-15%), proteins (8-16%), polyalcohols (3-10%), organic acids (3-10%) and oil residues (1-14%) (Cabrera et al., 1996).
In addition, concerning the carbohydrates fraction, OMWW contain highly diluted polysaccharides. Galanakis et al. (2010) have reported the sugar compositions of the insoluble and soluble fractions obtained from the alcohol-insoluble residue. The insoluble fraction is rich in rhamnose, glucose, galacturonic acid and xylose and is poor in galactose, arabinose and mannose; whereas the soluble fraction - the most abundant - is composed of galacturonic acid and arabinose, proving the occurrence of pectic polysaccharides.
Regarding the polyphenolic content, phenyl alcohols, phenolic acids, secoiridoids and flavonoids are commonly identified in OMWW (El-Abbassì et al., 2012; He et al., 2012). Structure of major polyphenols present in OMWW is shown in Figure 3.
13
Figure 3. Structure of major polyphenols in OMWW.
Bianco et al., (2003) have evaluated the polyphenolic profile of vegetation waters coming from Canino olives, reporting the presence of hydroxytyrosol, tyrosol, gallic acid, p-hydroxybenzoic acid, vanillic acid, caffeic acid, syringic acid, p-coumaric acid, ferulic acid and oleuropein. However, as previously reported, it is well known that the qualitative and quantitative phenolic profile of OMWW is strictly related to olive variety and/or to the production process along with storage conditions (Aggoun et al., 2016; D’Antuono et al., 2014; Obied et al., 2008); for instance, El-Abbassì et al. (2012) have observed that OMWW generated from traditional discontinuous press processes have a higher phenolic content than OMWW which is obtained from more modern three-phase centrifugal systems. Although OMWW polyphenolic composition has been investigated in samples coming from Algerian (Azerraj, Sigoise, Chemlal), Australian (Barnea), Greek (Koroneiki, Lianolia and Asprolia) and Italian (Cellina and Coratina) olive cultivars (Aggoun et al., 2016; He et al., 2012; D’Antuono et al., 2014) there are no data about some of the most important Mediterranean productions, such as the Sicilian ones.
For a long time, OMWW have represented a serious economic and environmental issue for the olive oil producers, due to the high organic and inorganic content, responsible for
14
negative effects on soil microbial populations (Paredes et al., 1987), aquatic ecosystems (Della Greca et al., 2001) and air (Rana et al., 2003).
Several techniques have been employed to recover phenolic compounds from OMWW, including solvent extraction, membrane separation and chromatographic procedures (Alfano et al., 2018; Fava et al., 2017; Zagklis et al., 2015).
1.2 Sugars and minerals for cosmeceutical application
The term cosmeceuticals refers to substances havingboth cosmetic and therapeutic benefits, being also efficient for treatingvarious dermatologic conditions, nourishing and improving the appearance of the skin, and delivering nutrients which are necessary for healthy skin (Kadam Vaishali et al., 2013).
Literature data have demonstrated that an adequate hydration of the stratum corneum is an effective method to maintain healthy skin (Hoeksema et al., 2013). Indeed, it is well known that the lack/loss of skin water can produce various effects from dryness to more serious conditions such as reduced turgor, thickness and density; in addition, it can accelerate wrinkle formation along with other aging signs, also promoting the onset of irritation, inflammation, itchiness and sensitivity.
Sugars and minerals represent some of the hygroscopic components of natural moisturizing factor (NMF) present inside the corneocytes. These compounds play a crucial role in maintaining hydration, pH and stiffness of stratum corneum. They act as humectants in vivo, drawing water up from the dermis to the epidermis as shown in Figure 4 (Flynn et al., 2001;
15
Figure 4. Humectan moisturizers activity
In addition, in vitro studies on human keratinocytes have shown the ability of a hypertonic culture medium, sugars containing, to increase the aquaporin-3 mRNA expression, whose protein facilitates water/glycerol transport in the epidermis of normal skin (Sugiyama et al., 2001).
Therefore, sugars and minerals present in OMWW could represent useful cosmeceutical ingredients as suggested by Rodrigues et al., 2015. However, experimental researches about this specific topic are not foundin literature.
1.3 Hydroxytyrosol and its biological effects
Hydroxytyrosol, the most abundant biophenol present in OMWW (D’Antuono et al., 2014), is well known for its beneficial effects on human health (Hu et al., 2014).
A body of literature data has evidenced that hydroxytyrosol exerts antioxidant (Grasso et al., 2003), antimicrobial (Zoric et al., 2013), anti-inflammatory (Scoditti ed al., 2014), hypoglycemic (Hamden et al., 2009) and cardioprotective (Tejada et al., 2017) activities.
16
In particular, Hamden et al. (2009) have evaluated the effect of purified hydroxytyrosol from OMWW on oxidative stress and hyperglycemia in alloxan-induced diabetic rats. The administration of hydroxytyrosol in diabetic rats decreased glucose level in plasma, alongside triglycerides, total-cholesterol and HDL-cholesterol levels in serum; in addition, an increase in renal superoxide dismutase, catalase and glutathione peroxidase activities in liver and kidney was observed.
Several in vitro studies have also reported that hydroxytyrosol is able to exert anticancer effects on different breast, colon (Corona et al., 2009; López de las Hazas et al., 2017; Sun et al., 2014), liver, prostate, thyroid (Toteda et al., 2016) and pancreatic (Goldsmith et al., 2018) cancer cell lines. These data are confirmed by some in vivo studies performed on male nude BALB/c mice in which tumors were established by the subcutaneous injection of the human cholangiocarcinoma cells (TFK-1) (Li et al., 2014).
1.3.1 Effects on reactive oxygen species in cancer cells
Reactive oxygen species (ROS) are highly reactive radicals, ions or molecules due to the presence of a single unpaired electron in their outermost shell of electrons.
Under physiological conditions, the intracellular stadily maintained levels of ROS act as signaling molecules counteracting some cellular damage to the main macromolecules through non-enzymatic molecules (i.e. glutathione GSH, flavonoids, vitamins A, C and E) or antioxidant enzymes as superoxide dismutases (SOD), catalase, glutathione reductase, glutathione peroxidases and glutathione S-transferases (Figure 5) (Liou and Storz , 2010).
17
Figure 5. Equilibrium between ROS and antioxidants under physiological conditions.
Increased production of ROS and/or alterations of ROS-scavenging enzymes have long been observed in cancer cells, suggesting an aberrant regulation of redox homeostasis. Metabolic alterations, mitochondrial dysfunction, loss of functional p53, as well as activation of oncogenes, are intrinsic factors responsible for the increased ROS production in cancer cells (Trachootham et al., 2009). High ROS levels may promote tumor formation or progression, leading to cell cycle progression, increase in proliferation and survival signaling, motility, genomic instability and angiogenesis (Figure 6) (Liou et al., 2010).
In contrast, a massive increase in intracellular ROS levels can induce cell cycle arrest, senescence or cell death of cancer cells, or a redox adaptation through an overexpression of endogenous antioxidants (Figures 6 and 7) (Liou et al., 2010).
The redox adaptation can induce not only the survival of cancer cells, but also the drug resistance as shown in Figure 7 (Trachootham et al., 2009).
18
Figure 6. Generation, regulation and effects of cellular ROS (Liou et al., 2010).
19
Therefore, a combination of ROS-generating agents with compounds capable of suppressing the cellular antioxidant systems could represent a valid therapeutic approach in cancer treatment.
Bahlis et al. (2002) have already reported the clinical effectiveness of the combinations of arsenic trioxide and ascorbic acid-mediated GSH depletion in the treatment of relapsed or refractory multiple myeloma.
Several studies have highlighted hydroxytyrosol as ROS increasing molecule in different cancer cell lines (Luo et al., 2013; Sun et al., 2014). In particular, Luo et al. (2013) have demonstrated the crucial role exerted by ROS in prostate cancer cells, reporting, in in vitro model (PC-3, DU145), the hydroxytyrosol-induced decrease in cell viability and an increase in superoxide production. Similar results have been obtained on colon cancer cells (DLD1) by Sun et al. (2014).
1.3.2 Effects on cell cycle in cancer cells
It is well known that the cell cycle is controlled by numerous mechanisms as regulation of cyclin-dependent kinases (CDK) by cyclins, CDK inhibitors and phosphorylating events (Vermeulen et al., 2003).
CDK are a family of serine/threonine protein kinases which are activated through the binding of cyclins at specific points of the cell cycle as shown in Figure 8. The cyclins D bind to
CDK4 and to CDK6 and the formed complexes are essential for entry in G1 phase; the cyclin E binds to CDK2 and the complex regulates the progression from G1 into S phase; the cyclin A can bind both CDK2 and CDK1 generating complexes respectively required during S phase or to promote the entry in M phase; the cyclin B forms a complex with CDK1 regulating the mitosis (Figure 8).
20
Figure 8. CDK/cyclin complexes: sites of regulatory activity (Vermeulen et al., 2003)
In addition to cyclin binding, CDK activity is also regulated by phosphorylation on conserved threonine and tyrosine residues and by cell cycle inhibitory proteins, called CDK inhibitors (CKI), which bind to CDK alone or to the CDK-cyclin complex.
Two CDK inhibitors families have been discovered: the INK4 family and Cip/Kip family. The INK4 family - including p15, p16, p18 and p19 - specifically inactivates G1 CDK (CDK4 and CDK6), forming stable complexes with the CDK enzyme prior to cyclin binding, thus, preventing the association with cyclin D. The Cip/Kip family - including p21, p27 and p57 - is able to inactivate CDK-cyclin. In particular, p21, a small protein with 165 amino acids - whichcan be induced by both p53-dependent and p53-independent mechanisms - is able to arrest the cell cycle progression in G1/S and G2/M transitions by inhibiting respectively CDK4,6/cyclin-D and CDK2/cyclin-E (Karimian et al., 2016).
In cancer, cell cycle deregulation occurs through mutation in genes encoding CDK, cyclins, CDK-activating enzymes, CKI, CDK substrates and checkpoint proteins (Sherr 1996).
21
A body of literature data has shown that hydroxytyrosol effects in different cancer cells are also elicited by inducing an arrest of cell cycle in different phase according with cellular types. In fact, an hydroxytyrsol-induced arrest in G2/M phase has been demonstrated in human colon cancer cells, in different human liver cancer cells (HepG2, Hep3B, SK-HEP-1 and Huh-7) and in pancreatic cancer cells (MIA PaCa-2) (Corona et al., 2009; Goldsmith et al., 2018; Zhao et al., 2014). In contrast, other authors have reported that hydroxytyrosol is able to arrest cell cycle in G1 phase in colon and prostate cancer cells (López de las Hazas et al., 2017; Zubair et al., 2017).
In addition, Zubair et al. (2017) have highlighted that hydroxytyrosol can affect the expression of several cell-cycle-associated proteins in different prostate cancer cell lines (LNCaP and C4-2). In particular, they have shown that hydroxytyrosol decreases the expression of cyclins D1 and Eas well as CDK2 and CDK4, while it increases p21 and p27 in both cell lines. Similar results have been reported by Toteda et al. (2016), who have investigated on the expression of cyclin D1 and p21in terms of mRNA and protein content in thyroid cancer cells (TPC-1, FB-2 and WRO) exposed for 24 h to 324 μM of hydroxytyrosol.
1.3.3 Effects on apoptosis/necrosis in cancer cells
Apoptosis, well known as programmed cell death, plays a crucial role in many physiological processes including cell turnover and embryonic development. However, inappropriate apoptosis is a key factor in many human diseases such as cancer.
Apoptosis is characterized by specific morphological characteristics (Elmore 2007) such as cell shrinkage and chromatin condensation; moreover plasma membrane blebbing occurs followed by separation of cell fragments into apoptotic bodies, containing dense cytoplasm with tightly packed organelles, which are subsequently phagocytosed by macrophages.
22
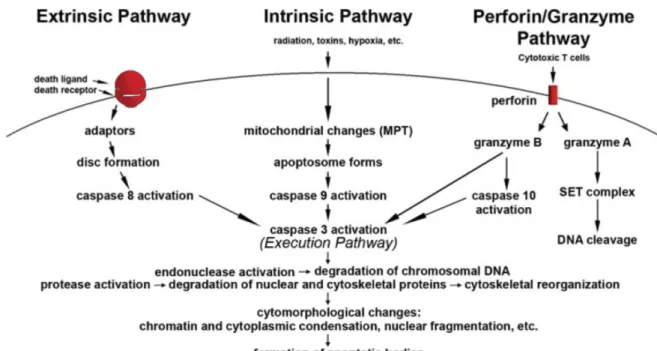
The mechanisms of apoptosis are highly complex and involve an energy-dependent cascade of molecular events (Figure 9). The extrinsic or death receptor pathway, the intrinsic or
mitochondrial pathway and granzyme B pathway converge on the same execution pathway, which is initiated by the cleavage of caspase-3 and results in DNA fragmentation, degradation of cytoskeletal and nuclear proteins, cross-linking of proteins, formation of apoptotic bodies, expression of ligands for phagocytic cell receptors and finally uptake by phagocytic cells. The granzyme A pathway activates a caspase-independent cell death pathway via single stranded DNA damage. Caspase-3, alongside caspase-7, act as “executioner” caspases, cleaving different substrates such as poly (ADP-ribose) polymerase-1 (PARP-polymerase-1). The cleavage of PARP-polymerase-1 in two fragments of 89-kD and 24-kD is considered a hallmark of apoptosis (Ganta Vijay Chaitanya et al., 2010).
The control and regulation of apoptotic mitochondrial events occur through Bcl-2 family proteins, including pro-apoptotic (10, Bax, Bak) or anti-apoptotic (2, x, Bcl-XL, Bcl-XS, Bcl-w, BAG) proteins.
23
Another form of cell death is necrosis, a passive and energy-independent process characterized by some morphological changes such as cell swelling, formation of cytoplasmic vacuoles, distended endoplasmic reticulum, condensed, swollen or ruptured mitochondria, disrupted organelle membranes, swollen and ruptured lysosomes and eventually disruption of the cell membrane (Figure 10). In humans, it has been reported that
necrosis generally occurs in response to severe changes in physiological conditions, including hypoxia, ischaemia, hypoglycemia, nutrient deprivation, extreme temperature changes as well as exposure to ROS or toxins (Elmore 2007).
Figure 10. Comparison of morphological changes during apoptosis and necrosis.
Several authors have reported that hydroxytyrosol can induce later apoptosis and necrosis in different cancer cells such as colon cancer cells (Caco-2 and HT-29) and papillary and follicular thyroid cancer cells (López de las Hazas et al., 2017; Toteda et al., 2016).
24
In addition, other authors have reported that hydroxytyrosol induces an increase in cleaved PARP1, cleaved caspase-3 and cleaved caspase-7 expression in colorectal adenocarcinoma DLD1 cells (Sun et al., 2014).
Similar results have been reported by Zubair et al., 2017, who have also shown that hydroxytyrosol induces a down-regulation of expression of anti-apoptotic proteins, Bcl-2 and Bcl-xL, in a dose-dependent manner with simultaneous induction of Bax, thereby leading to an increase in the ratio of Bax/Bcl-2 as well as Bax/Bcl-xL in prostate cancer cells.
Toteda et al., 2016 have also reported the involvement of the mitochondrial apoptotic pathway due to a significant up-regulation of caspase-9, cyt c release from the mitochondria to cytosol and an up-regulation of p53 and BAD proteins expression.
1.3.4 Epigenetic modulation
It is well known that polyphenols are able to modulate the epigenetic status (Pan et al., 2013) even if very few data on epigenetic effects induced by hydroxytyrosol are present in literature (Cetrullo et al., 2016; D’Adamo et al., 2017; Yang et al., 2017; Wang et al., 2018; Zhi et al., 2018).
The epigenetics could be defined as the study of mechanismswhich alter gene expression without altering the primary DNA sequence. Epigenetic mechanisms are heritable and reversible, and include changes in DNA methylation, in histone modifications and in the production of small non-coding microRNAs (miRNA). It has been demonstrated that aberrant epigenetic mechanisms may lead to several pathological conditions; in particular in cancer alterated methylome, both hypo- and hypermethylation have been observed (Kanwala and Gupta, 2012).
25
DNA methylation, which is essential for physiological processes, consists of the covalent addition of a methyl group from S-adenosyl-methionine (SAM) at the 5 position of the cytosine catalyzed by DNA methyltransferases (DNMTs) (Figure 11 A). Generally
5-methylcytosines are observed within CpG dinucleotides which are concentrated in large clusters called CpG islands, containing the promoter and/or the first exon region. Normally, the CpG islands are unmethylated in transcriptionally active genes, whereas they are methylated in silenced genes (Kulis and Esteller, 2010) (Figure 11 B).
In normal cells, pericentromeric heterochromatin is highly methylated; satellite sequences and repetitive genomic sequences are silenced, ensuring genomic integrity and stability. In different tumors the loss of DNA methylation of normally inactivated regions has been
26
observed, leading to mutagenesis and genomic instability (Costa et al., 2006). However, certain genes undergo inactivation as a consequence of hypermethylation of CGIs in regulatory regions, which are unmethylated in normal cells. Various tumor-suppressor genes silenced by DNA hypermethylation have been identified in tumor tissues (Greger et al., 1989).
Histone modifications are post-translational covalent additions to the N-terminal and C-terminal of histone tails; however, some modifications can occur within the globular domain. Currently, different types of histone modifications - including acetylation, methylation, phosphorylation, ubiquitination, sumoylation, ADP ribosylation, deimination, proline isomerization and propionylation - have been identified (Kouzarides, 2007).
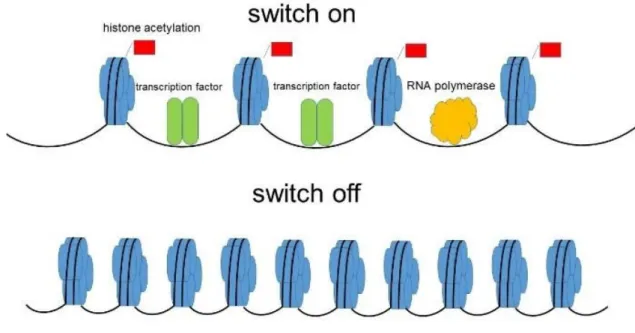
It has been reported that histone acetylation, first discovered by Allfrey et al. (1964), is an Nε-acetylation of lysine, controlled by two enzymes - histone acetyltransferases (HATs) and
histone deacetylases (HDACs). The lysine acetylation neutralizes the positive charge of histone tail, weakening histone–DNA or nucleosome–nucleosome interactions, thus facilitating the access to the DNA for different nuclear factors, such as the transcription complex. In contrast, the histone deacetylation decreases the accessibility for transcription factors between nucleosome and DNA (Figure 12). Changes in histone modifications have
also been detected in different cancer types. (Sawan and Herceg, 2010). In examining epigenetic modification induced by hydroxytyrosol-enriched fraction from OMWW in our experimental model, we chose two approaches: 1) global methyloma analysis by Comet assay; 2) sirtuins expression/activity.
27
Figure 12. Histone acetylation and deacetylation
Mammalian sirtuins, NAD+-dependent deacetylases and mono-[ADP-ribosyl] transferases,
are a family of 7 members (SIRT1-7) differing in their localization, activity and functions. In particular, SIRT1, SIRT6 and SIRT7 are mainly nuclear; SIRT2 and SIRT3 are mainly cytoplasmic and mitochondrial, respectively, although they are present in the nucleus only at low levels; SIRT4 and SIRT5 are present in the mitochondria.
Mammalian sirtuins are involved in the chromatin regulation, cell survival under stress, metabolic homeostasis regulation, and developmental and cell differentiation (Vaquero and Reinberg, 2008).Under chronic stress, SIRT1, SIRT2 and SIRT3 can protect the organism by inducing cell senescence or apoptosis (Figure 13) (Bosch-Presegué and Vaquero, 2011).
SIRT1, the most studied sirtuin, regulates both types of p53-mediated apoptosis (p53-transcriptional dependent and p53-(p53-transcriptional independent). Numerous studies have evidenced that sirtuins, especially SIRT1, have a dual role in cancer, operating as tumor suppressors or as an oncogenic factor.
28
Figure 13. Sirtuins and cell survival (Bosch-Presegué and Vaquero, 2011)
1.4 Cell lines
1.4.1 MRC-5 cell line
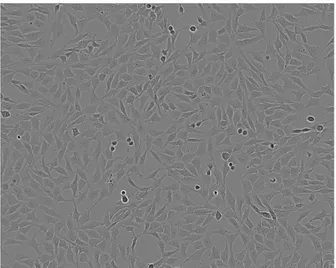
MRC-5 is a human fibroblasts cell line derived from normal lung tissue of a 14-week-old male fetus by J.P. Jacobs in September of 1966 (Figure 14). This is a diploid cell line with
normal X and Y chromosomes. The rate of polyploidy is 3.6%. MRC-5 cell line is sensitive to infection of a large variety of viruses and it is commonly used in the production of viral vaccines (Alirezaie et al., 2011; Jacobs JP. 1976; Mirchamsy et al., 1976). In addition, MRC-5 cells have already been used in cosmetic field to evaluate anti-UVA effect of different plant extracts as reported by patent US 2003/0072820 A1.
29
Figure 14. Images of MRC-5 cells.
1.4.2 1321N1 cell line
1321N1 is a human astrocytoma cell line (Figure 15) isolated in 1972 as a sub clone of the
cell line 1181N1 which in turn was isolated from the parent line U-118 MG (one of a number of cell lines derived from malignant gliomas by J Ponten (Pontén and Macintyre, 1968).
30
1321N1 has been shown to have very similar STR profile data to U-118 MG. It is well known that astrocytoma is the leading CNS tumor in children. In particular, low-grade astrocytomas are responsible for approximately one third of cases and are classified as WHO grade I (well circumscribed with only a narrow margin of infiltration into the surrounding tissues) and WHO grade II (infiltrative). High-grade astrocytomas comprise approximately 7-11% of pediatric tumors and are classified as WHO grade III (e.g. anaplastic astrocytoma) and WHO grade IV (e.g. glioblastoma) (Isaacs, 2016).
31
CHAPTER II
AIMS
Due to the importance of olive oil in the economy of Sicily, our group together with the Institute of Biomolecular Chemistry (Italian National Research Council, Catania) havebeen trying to evaluate the potential use of some fractions obtained from OMWW in cosmeceutical and nutraceutical field.
Indeed, the aims of my doctorate project were to evaluate:
1) some possible differencesbetween the chemical composition of two OMWW generated from Sicilian olive cultivar (Cerasuola and Nocellara etnea);
2) safety and the moisturizing properties of a sugars and minerals enriched fraction (SMEF), obtained from Cerasuola-OMWW, by in vitro and in vivo studies;
3) the chemotherapeutic activities in vitro exhibited by hydroxytyrosol-enriched fraction (H-EF) obtained from Cerasuola-OMWW. As control, we used hydroxytyrosol commercial standard (HTyr).
32
CHAPTER III
MATERIALS AND METHODS
3.1 Materials
Cerasuola-OMWW and Nocellara etnea-OMWW were freshly collected from three-phase olive oil mill processing systems located respectively in Menfi (Agrigento, Italy) and in Mascalucia (Catania, Italy). Folin-Ciocalteu reagent, 1-diphenyl-2-picrylhydrazyl (DPPH), 3-(4,5-dimethylthiazol-2-yl)-2,5-diphenyltetrazolium bromide (MTT), trifluoroacetic acid (TFA), activated charcoal and all standards were purchased from Sigma-Aldrich (St. Louis, MO, USA). HPLC grade solvents were purchased from Carlo Erba (Italy). Purosorb™PAD428 resin was purchased from Purolite. The TUNEL Apoptosis Detection Kit-DNA Fragmentation/Fluorescence Staining was purchased from Merck Millipore (Germany). The Nuclear Extraction Kit (ab113474) and the Universal SIRT Activity Assay Kit (ab156915) were purchased from Abcam. All other chemicals were purchased from Sigma-Aldrich (St. Louis, MO, USA) and Gibco-BRL Life Technologies (Grand Island, NY, USA).
3.2 Methods for chemical analysis of OMWW
3.2.1 OMWW pretreatment and physicochemical analysis
OMWW were centrifuged at 4000 rpm for 20 minutes and the supernatant was filtered through filter paper under vacuum condition. Filtered OMWW were stored at -20°C before use. The pH values of OMWW samples were determined by using a Mettler Toledo
33
SevenCompact pH meter. Chemical Oxygen Demand (COD), total nitrogen, total phosphorous and metals were determined according to EPA (U.S. Environmental Protection Agency) methods 410.3, 352.1, 365.3 and 200.8.
Total sugars were determined according to Dubois method (Dubois et al., 1956; Fava et al., 2017). The absorbance was measured at λ 490 nm and compared against a glucose calibration curve (R2=0.999) (Cary UV Agilent Technology). Results were expressed as g/l
of glucose.
3.2.2 Total phenolic content
The total phenolic content of OMWW samples was determined using the Folin-Ciocalteu assay (Folin, 1927; Marinova et al., 2005; Singleton and Rossi, 1965). Briefly, 10 μl of OMWW or gallic acid standard solution, appropriately diluted, were added to 90 μl of water. Folin-Ciocalteu reagent (10 μl) was added to the mixture and shaken. After 5 minutes, 100 μl of 7% (w/v) Na2CO3 were added and the obtained solution was diluted with water up to
250 μl, shaken and incubated for 90 minutes at room temperature. The absorbance was determined at λ 750 nm with a microplate spectrophotometer reader (Synergy HT multi-mode microplate reader, BioTek, Milano, Italy) and compared against a gallic acid calibration curve (y=0.002x+0.030, R2=0.9997). The total phenolic content was expressed
as g/l of gallic acid.
3.2.3 Total flavonoid content
An aliquot (25 µl) of OMWW or gallic acid standard solution, appropriately diluted, was transferred to test tube containing 100 µl of water. At time zero, 7.5 µl of 5% (w/v) NaNO2
were added; at 5 minutes 7.5 µl of 10% (w/v) AlCl3 were added; finally, at 6 minutes 50 µl
34
mixed (Salerno et al., 2014). The absorbance was measured at λ 510 nm with a microplate spectrophotometer reader (Synergy HT multi-mode microplate reader, BioTek, Milano, Italy) and compared against a catechin calibration curve (y= 0.0008x-0.0094, R² = 0,9968). The total flavonoid content was expressed as g/l of catechin.
3.2.4 HPLC-DAD analysis
The chromatographic analysis of polyphenolic compounds was performed by HPLC-DAD (HITACHI) using a Kinetex C-18 (4.6x250mm, 5µm) column (Phenomenex) with a security guard cartridge (Phenomenex), thermostated at 30°C±1°C. The samples were eluted with water (A) and acetonitrile (B) both added with 0.1% trifluoroacetic acid (TFA) according to the following gradient: 100% A as initial condition, maintained for 5 minutes; 58% A in 25 minutes; 100% B in 15 minutes, maintained for 5 minutes. The flow rate was 0.8ml/min. The chromatograms were acquired at 280nm. The polyphenolic compounds were identified by comparison of retention times and UV spectra with the corresponding commercial standards: gallic acid, hydroxytyrosol, tyrosol, hydroxybenzoic acid, 4-hydroxyphenylacetic acid (PHPA), caffeic acid, vanillic acid, floretic acid, verbascoside, p-coumaric acid, trans-ferulic acid, oleuropein, catechol, hydroxybenzoic acid, 4-methylcatechol, 3-hydroxyphenylpropionic acid, 3,4,5-trimethoxybenzoic acid and trans-cinnamic acid. A 5-points calibration curve of each standard was used for the quantification.
3.2.5 Antioxidant activity of OMWW
The antioxidant activity of OMWW was evaluated by DPPH assay (Blois 1958; Salerno et al., 2014). The reaction mixture contained DPPH radical (86 μM) and different amounts of OMWW in 1 ml of ethanol to obtain concentrations of OMWW, expressed as μM of hydroxytyrosol, ranging from 1 to 100 μM. The samples were incubated for 10 minutes at
35
room temperature, then the absorbance was measured at λ 517 nm with a microplate spectrophotometer reader (Synergy HT multi-mode microplate reader, BioTek, Milano, Italy). The results were expressed as percentage decrease in absorbance with respect to control. Hydroxytyrosol was used as standard.
3.2.6 Stability studies
The stability of OMWW samples stored in the dark at different temperatures (-20°C, 4°C and 25°C) under aerobic conditions was evaluated by measuring total phenols, total flavonoids and hydroxytyrosol content as previously described.
3.3 Methods for cosmeceutical application
3.3.1. Preparation of sugars and minerals enriched fraction (SMEF)
An aliquot of filtered Cerasuola-OMWW (500 ml) was passed through a column (80x4cm) filled with 200 g of Purosorb™PAD428 and eluted with water (700 ml) with a flow of 0.5ml/min. The aqueous fraction was lyophilized and the adsorbent was washed with ethanol, dried and stored at room temperature.
3.3.2 Chemical characterization of SMEF lyophilized fraction Chromatographic analysis of sugars
The characterization of sugars present in the lyophilized fraction was performed by HPLC-ELSD (HITACHI, High-Technologies Corporation) as reported by Shanmugavelan et al. (2013), with slight modifications. The HPLC analysis was performed using a Prevail Carbohydrates ES (250x4.6mm, 5μm) column (Alltech) thermostated at 25°C±1°C. The sample was eluted isocratically with acetonitrile/water (75/25 v/v) with a flow rate of 1
36
ml/min. Injection volume was 10 μl. Drift tube temperature was 45°C, nitrogen pressure was set to 4.1 bar.
The sugars were identified by comparison of retention times with the corresponding commercial standards (fucose, arabinose, xylose, fructose, mannose, galactose, glucose, sucrose and maltose). A second-order polynomial calibration curve of each standard (50-750 mg/l) was used for the quantification.
Metals Determination
A multiwave 3000 microwave sample preparation system equipped with 8XF100 rotor (Anton Paar GmbH, Graz, Austria, Europa) for sample mineralization was used. A total of 200 mg of each sample (SMEF lyophilized fraction and cosmetic emulsion) was loaded into fluoroplastic vessels (XF100 TFM or PFA) along with a digestion mixture containing 3.5 ml of HNO3 and 1.5 ml of H2O2 according to EPA 3052 guidance (with opportune modification)
and placed in a ceramic supporting vessel.
The mineralization program heated the samples for 30 minutes at a power of 800 W and then cooled them for 15 minutes. After cooling, the contents of the vessels were diluted to 10 ml with ultrapure water and filtered through a Whatman quantitative filter paper, ash less, grade 40. Metal concentrations were determined with an ICP/MS Nexion 300X (Perkin Elmer Inc. Waltham, Massachusetts, U.S.A) using the kinetic energy discrimination mode (KED) for interference suppression. Each determination was performed three times.
The accuracy of the analytical procedure was confirmed by measuring a standard reference material, Nist 1566B oyster tissue, without observing an appreciable difference. Before analytical measurement, appropriate calibrations were made and a “blank” was established. All concentrations are calculated as mg/kg.
37
3.3.3 In vitro study
Cell cultures and treatments
MRC-5 cells - the human fetal lung fibroblast cells - were obtained from the American Type Culture Collection (Rockville, MD, USA) and cultured in 25 cm2 flasks and/or in 6-12- or
96-multiwell microplate, according to type of assay to be performed, withEagle's Minimum Essential Medium (EMEM) supplemented with 10% Fetal Bovine Serum and (50IU/ml) penicillin/ (50μg/ml) streptomycin, and incubated at 37°C in a humidified atmosphere with 5% CO2. The treatments were performed at subconfluence and then the cells were detached
by trypsin and washed in PBS 1X by centrifugation. The cells were treated with SMEF at different concentrations (% w/w) prepared by dissolving the SMEF lyophilized fraction in culture medium at the appropriate final concentrations for each biological assay.
MTT assay
The potential cytotoxic effect of the lyophilized fraction was evaluated by MTT assay, a colorimetric method which measures the reduction of MTT, a yellow tetrazolium salt, to a purple formazan by the mitochondrial dehydrogenase enzyme of living cells (Malfa et al., 2010).
MRC-5 cells (1x10⁴ cells/well) were treated with different concentrations of lyophilized
SMEF in culture medium (0.5%, 1%, 2%, 5%, 10% w/w) for 6 and 24 hours; then 200 μl of MTT (0.5 mg/ml) in culture medium were added to each well and incubated for 3 hours at 37°C in a humidified atmosphere with 5% CO2. The optical density (OD) was measured with
a microplate spectrophotometer reader (Synergy HT multi-mode microplate reader, BioTek, Milano, Italy) at λ 550 nm. The results were expressed as percentage of cell viability with respect to untreated control viable cells, which value was equal to 100%.
38
TUNEL assay
Apoptosis was evaluated by TUNEL assay, a method which identifies apoptotic cells in situ by using terminal deoxynucleotidyl transferase (TdT) to transfer biotin-dUTP to the free 3'-OH of cleaved DNA, according manufacturer’s protocol.
The assay was performed on MRC -5 cells untreated and treated with different concentrations of SMEF lyophilized fraction in culture medium (1%, 2% and 5% w/w), both for 6 and 24 hours. For each sample ten fields, randomly selected, were analyzed using an epifluorescence microscope (Leica, Wetzlar, Germany) equipped with a camera. The apoptotic index was calculated as the number of apoptotic cells in each field.
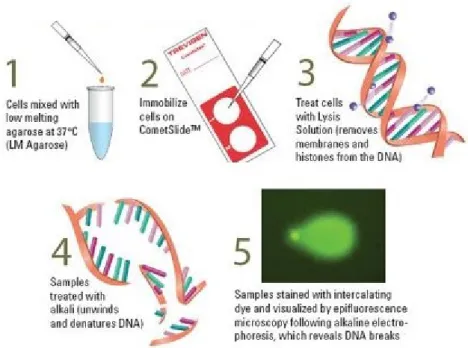
Alkaline comet assay
The potential genetoxic effect of lyophilized fraction was evaluated by single-cell gel electrophoresis, commonly called Comet assay (Figure 16).
39
It is a simple and sensitive method for assessing DNA damage at the single-cell level. According to various versions, it is possible to evidence different types of damage. For instance, the neutral comet assay allows to identify double stranded breaks; the alkaline comet assay (pH >13) is capable of detecting DNA double-strand breaks, single-strand breaks, alkali-labile sites, DNA-DNA/DNA-protein cross-linking, and incomplete excision repair sites. The inclusion of digestion of lesion-specific DNA repair enzymes in the procedure allows the detection of various DNA base alterations (Pu et al., 2015).
Alkaline comet assay was performed on MRC-5 cells untreated and treated with SMEF lyophilized fraction dissolved in culture medium (0.5%, 1%, 2% and 5% w/w), both for 6 and 24 hours, according to Malfa et al. (2010), with slight modifications. Briefly, cells embedded with 0.7% low melting point agarose (LMA) were deposited onto microscope slides pre-coated with 1% melting point agarose (NMA). After lysis and unwinding treatments, the nucleoids were electrophoresed for 20 minutes at 0.7 V/cm, washed with neutralization buffer, dried with 70% ethanol and stained with SYBR Green (1:10000). Fifty nucleoids were analyzed for each sample using an epifluorescence microscope (Leica, Wetzlar, Germany) equipped with a camera. CASP (1.2.2) image analysis software was used to evaluate DNA damage. The results were expressed as the percentage of fragmented DNA present in the comet tail (%TDNA) (Figure 17).
40
Measurement of ROS
Intracellular ROS levels were evaluated by using of DCFH-DA, a non-fluorescent molecule able to spread through the cell membrane. Once inside the cell, esterases hydrolyze the acetyl groups generating the non-fluorescent 2’,7’-dichlorofluorescin (DCFH). Intracellular ROS are able to oxidize DCFH into fluorescent dichlorofluorescein (DCF).
MRC-5 cells (5 x10⁵ cells/well) were treated with different concentrations of lyophilized
SMEF in culture medium (0.5%, 1%, 2% and 5% w/w), both for 6 and 24 hours. After collection, the cell suspension was treated with DCFH-DA 5 µM for 30 minutes at 37°C in the dark, washed with PBS 1X and then analyzed by Flow Cytometry (EPICS XL-MCL, Beckman Coulter, California–USA) equipped with a 488 nm Argon laser. Instrument settings were checked daily using Flow-Check™ Fluorospheres (Beckman Coulter) as recommended by manufacturer. For each sample, 5000 events were analyzed by Expo32™ software (Beckman Coulter) and listmode data were analyzed by Kaluza software (Beckman Coulter). The dichlorofluorescein (DCF) upon excitation at 488 nm emits green fluorescence, proportional to the ROS intracellular levels, between 500 and 550 nm (Rothe and Valet, 1990; Sarkar et al., 2005). The results were expressed as the percentage of green fluorescent cells.
Scanning Electron Microscopy (SEM) cell morphology analysis
Morphological treatment-induced (0.5%, 1%, 2% and 5% w/w for 6 hours) cell alterations were determined by SEM analysis as described by Malfa et al. (2014). The cells were washed with Sodium Cacodylate Buffer 0.1 M (pH 7.4), fixed in 2% glutaraldehyde in 0.1 M PBS (pH 7.2) for 1 hour at 4 °C, rinsed in buffer and post-fixed in 1% Osmium tetroxide (OsO4)
in Sodium Cacodylate Buffer 0.1 M pH 7.4 for 1 hour at 4˚C. Then, the cells were washed with 0.1 M Sodium Cacodylate twice for 10 minutes and dehydrated with increasing ethanol
41
concentrations (30%, 50%, 70%, 95%, 100%). The cells were critical point dried with CO2
(Emitech K850) and coated with gold. Cell morphology was examined with a scanning electron microscope (Zeiss EVO LS 10).
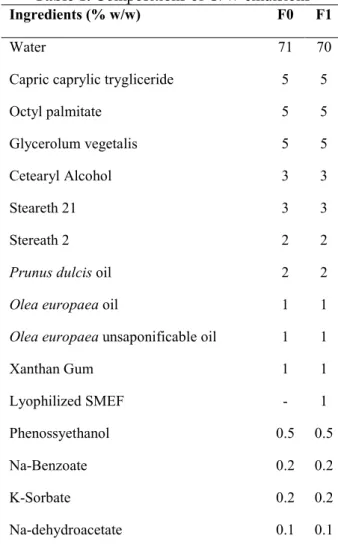
3.3.4 Formulation, metals analysis and long-term stability study
The lyophilized SMEF (1% w/w) was formulated in an oil-in-water (O/W) emulsion whose composition (F1), compared with base composition (F0) is shown in Table 1.
Table 1. Compositions of O/W emulsions
Ingredients (% w/w) F0 F1
Water 71 70
Capric caprylic trygliceride 5 5
Octyl palmitate 5 5
Glycerolum vegetalis 5 5
Cetearyl Alcohol 3 3
Steareth 21 3 3
Stereath 2 2 2
Prunus dulcis oil 2 2
Olea europaea oil 1 1
Olea europaea unsaponificable oil 1 1
Xanthan Gum 1 1 Lyophilized SMEF - 1 Phenossyethanol 0.5 0.5 Na-Benzoate 0.2 0.2 K-Sorbate 0.2 0.2 Na-dehydroacetate 0.1 0.1
F1: emulsion containing lyophilized sugars and minerals enriched fraction (SMEF) F0: base emulsion
42
Metals analysis was performed on 200 mg of F1 emulsion as described in Materials and Methods Section 2.2.2. Different aliquots F0 and F1 (10 g) were stored at 25°C±2°C with 60±5% R.H. for 12 months and at 40°C±2°C with 60±5% R.H. for 6 months at light. The pH, phase separationand appearance were evaluated, at 25°C, on fresh and stored samples as reported by Garbossa and Maia Campos, 2016.
3.3.5 In vivo evaluation of moisturizing properties
A panel of 30 healthy female volunteers (average age 28±5) were enrolled in accordance withthe Declaration of Helsinki. After giving their informed consent, they were divided in two subgroups, A and B, each of 15 volunteers. Inclusion criteria were age and skin which had not been treated in the previous five weeks. Exclusion criteria were if participants presented skin disorders such as infections, dermatitis, psoriasis, and similar. The skin conditions were selected by clinical assessment criteria currently used in practice (Springett and Merriman, 1995). The volunteers were instructed both to apply the assigned emulsion (20 mg) on forearms twice a day andnot to apply any topical products in the same area 24 hours before the beginning and throughout the test period.
We set a randomized, controlled, single-blind study where Group A applied F1 emulsion while group B applied F0 emulsion. Skin hydration was evaluated by MoistureMeterD Compact (Delfin Technologies Ltd, Finland) both before application and after 7 days. All measurements (four per area) were performed at 25°C±2°C with 35±5% R.H. The % increase of hydration for each group was calculated by this formula [(V7d - V0d)/V0d) x 100],
where V0d and V7d are the average values of skin hydration at Day 0 and after 7days,
43 3.4 Methods for nutraceutical application
3.4.1 Preparation of hydroxytyrosol-enriched fraction (H-EF)
H-EF was obtained from Cerasuola-OMWW as described by Fava et al., 2017. Briefly an aliquot of filtered OMWW (50 ml) was passed through a column (25x2.5cm) filled with 10 g of activated charcoal. The sample was eluted with water to collect the unabsorbed fraction and then with ethanol (200 ml) to collect H-EF. The ethanolic fraction was dried under vacuum using a rotary evaporator and dissolved in water (50 ml). Finally, the adsorbent was regenerated with NaOH 1M, washed with water, dried and stored at room temperature.
3.4.2 In vitro study Cell cultures
1321N1 cells, the human astrocytoma cells, were cultured withMEM supplemented with 10% Fetal Bovine Serum, 2% glutamine and (50IU/ml) penicillin/ (50μg/ml) streptomycin. The cells were cultured in 25 cm2 flasks and/or in 6- or 96-multiwell microplate, according
to type of assay to be performed and incubated at 37°C in a humidified atmosphere with 5% CO2.. The treatments with H-EF (50, 100 and 200 µM) or hydroxytyrosol commercial
standard (HTyr 100 µM) for 24 and 48 hours were performed at subconfluence and then the cells were detached by trypsin and washed in PBS 1X by centrifugation.
MTT assay
The cytotoxic effect of H-EF or Htyr was evaluated by MTT assay on 1321N1 (Malfa et al., 2010). The cells (1x10⁴ cells/well) were treated with different concentrations of H-EF (50,
100 and 200 µM) or HTyr (100 µM) for 24 and 48 hours; then the assay was performed as already described in the Section 2.3.3.
44
Wound Healing assay
The effect of H-EF on 1321N1 migration was determined in vitro by Wound Healing assay. Confluent monolayers of 1321N1 cells in 12-well plates were wounded with a pipette tip and washed with PBS 1X to remove detached cells. The wounded monolayers were treated with H-EF (50 and 100 µM) or HTyr (100 µM) for 24, 48 and 72 hours. On the external surface of the plate’s bottom, the wound area was marked with a dot as reference. The area next to the dot was photographed by a phase-contrast microscope at 24, 48 and 72 hours after wounding. Wound closure was quantified by measuring the remaining denuded area with the ImageJ software program (Version 1.43; Broken Symmetry Software, Bethesda, MD).
Cell cycle analysis
Cell cycle analysis was performed on untreated and treated cells as reported by Malfa et al., 2010. After the treatments, the cells were fixed in 75% ethanol and kept at -20°C for at least 2 hours. washed twice with PBS 1X and incubated in propidium iodide solution at 37°C for 20 minutes in the dark prior to flow cytometry analysis (EPICS XL-MCL, Beckman Coulter, California–USA), using the propidium iodide channel. Instrument settings were checked daily using Flow-Check™ Fluorospheres (Beckman Coulter) as recommended by manufacturer.
Lactic dehydrogenase release
Lactic dehydrogenase (LDH) release was measured spectrophotometrically in the culture medium and in the cellular lysates at λ 340 nm by analizing NADH reduction (Acquaviva et al., 2016). The percentage of LDH release was calculated as the percentage of the total
45
amount, considered as the sum of the enzymatic activity present in the cellular lysates and that in the culture medium.
Alkaline comet assay
Alkaline comet assay was performed on untreated and treated cells as described by Malfa et al. (2010) and already described in Section 2.3.3.
ROS determination
ROS levels were evaluated on untreated and treated cells using 2’,7’-dichlorofluorescein diacetate (Acquaviva et al., 2016). 132N1 cells were seeded in 6-well plates (about 400000 cells per well) and incubated at 37°C in a humidified atmosphere with 5% CO2.. After 24
hours, the cells were then treated with different concentrations of H-EF (50 and 100 μM) or Htyr 100 μM for 24 and 48 hours. Subsequently, the culture medium containing the treatments was removed and, after washing with PBS 1X, 500 μl of culture medium containing DCFH-DA at the final concentration of 5 μM are added to each well. After incubation at 37°C in a humidified atmosphere with 5% CO2 for 20 minutes, the medium is
transferred to a tube and centrifuged at 1350 rpm for 10 minutes; after centrifugation, the supernatant is removed and the pellet is resuspended with 500 μl of a digitonin solution (2.5 mg / mL). Then 500 μl of the digitonin solution (2.5 mg / mL) were added to each well and the content of each tube is combined with that of the respective well. After incubation for 1 hour in the dark at 4 ° C, the cells were scraped and the contents of each well were transferred to an eppendorf; subsequently the samples were centrifuged at 14000 rpm at 4 ° C for 10 minutes to eliminate the cellular residues which could interfere with the spectrofluorimetric reading. Finally, 200 μL of supernatant for each sample (or white digitonin solution) were transferred to a 96-well black plate to proceed with the spectrofluorimetric reading
λ-46
excitation = 488 nm, λ emission = 525 nm (Synergy HT multi-mode microplate reader, BioTek, Milan, Italy). The total protein content was evaluated for each sample according to Bradford (1976). The results were expressed as fluorescence intensity (FI) per mg proteins and compared with the untreated control cells.
Thiol groups determination
Thiol groups, containing predominantly reduced glutathione (GSH), were determined spectrophotometrically at λ 412 nm using 5,5′-dithiobis(2-nitrobenzoic acid) (Acquaviva et al., 2016). 132N1 cells were seeded in 6-well plates (about 400000 cells per well) and incubated at 37°C in a humidified atmosphere with 5% CO2.. After 24 hours, the cells were
then treated with different concentrations of H-EF (50 and 100 μM) or Htyr 100 μM for 24 and 48 hours. After the treatments, the cells were detached by trypsin and centrifuged at 500 g for 5 minutes. The pellet was washed with PBS 1X, centrifuged at 500 g for 5 minutes and resuspended in 100 μL of buffer (Tris base 0.25 M, EDTA 20 Mm, pH 8.2). The cells were sonicated 3 times for 10 seconds at the minimun output. DTNB solution 10 mM was prepared in ethanol and diluted1:80. Then 320 μL of DTNB solution, 60 μL of buffer and 20 μL of lysate were mixed and incubated for 20 minutes at room temperature in the dark. The blank was prepared by adding 80 μL of buffer to 320 μL of DTNB solution. Subsequently, the samples were centrifuged at 3000 g for 10 minutes at room temperature. Finally, 200 μL of supernatant from each sample was transferred to a 96-well plate to measure the absorbance at 412 nm.
The total protein content present in the lysates was evaluated for each sample according to Bradford (1976). The results were expressed as nmol GSH/mg proteins calculated referring to a glutathione calibration curve.
47
Western Blot analysis
Whole cell protein extracts were prepared according to Laemmli (1970). The primary antibodies used were: anti-GAPDH (1:50000) (Millipore, Darmstadt, Germany), anti-p53 (1:500) (Santa Cruz Biotechnology, Santa Cruz, USA), anti-p21 (1:500) (Sigma-Aldrich, St. Louis, USA), anti-sirt 1 (1:250) (Cell Signaling Technology, Denvers, USA). The proteins target by primary antibodies were detected by using secondary horseradish peroxidase-conjugated antibodies (Dako, Glostrup, Denmark), diluted 1:2000, and an ECL system (Thermo Scientific, Rockford, USA). The level of individual proteins expression was measured by densitometric analysis using the software Image J and GAPDH of each lane as reference value.
Determination of nuclear sirtuins activity
Nuclear sirtuins activity was evaluated by using Universal SIRT Activity Assay Kit (ab156915, Abcam). The absorbance was measured with a microplate spectrophotometer reader (Synergy HT multi-mode microplate reader, BioTek, Milano, Italy) at λ 450 nm. The activity for each sample was calculated according to the following formula:
* protein amount added in the reaction without inhibitor ** incubation time (90 minutes)
Nuclear extracts were obtained from untreated and treated cells by using ab113474 kit (Abcam).
48
Methy-sens Comet assay
Global DNA methylation was evaluated on untreated and treated cells by Methy-sens Comet. Two isoschizomeric restriction enzymes HpaII and MspI recognize the same tetranucleotide sequence (5’-CCGG-3’ ) but display differential sensitivity to DNA methylation:
- HpaII is inactive when any of the two cytosines is methylated, but it is able to digest the hemimethylated 5’-CCGG-3’ at a lower rate compared with the unmethylated sequences; - MspI is able to digest 5’-CmCGG-30 but not 5’- mCCGG-3’ (Wentzel et al., 2010).
After lysis overnight at 4°C in the dark, the samples were incubated with 100 µl of Fast Digest HpaII e MspI (5µl/ml) (Fermentas) for 10 minutes at 37°C. Then the assay was performed as described in the Section 3.3.3. The global methylation was measured according the following formula:
3.5 Statistical Analysis
All the results were obtained by three independent experiments each performed in triplicate and the means and standard deviations for each value were calculated. Statistical differences among different treatments were assessed by One way Anova. Post hoc comparison was performed according to Bonferroni test. We applied p<0.05 as the minimum level of significance. All the analyses were performed using Graph Prism version 5.
Furthermore, Pearson test was applied to analyze the correlations between ROS level and each other parameters evaluated for the cosmeceutical application.
49
CHAPTER IV
RESULTS
4.1 Chemical analysis of OMWW
In Table 2 are reported the data related to physicochemical characterization of
Cerasuola-OMWW and Nocellara etnea-Cerasuola-OMWW. Both Cerasuola-OMWWs had a mildly acidic pH, 4.98-5.24 respectively, and high levels of COD, sugars, nitrogen and phosphorous.
Metals analysis performed by ICP-MS showed that potassium was the most abundant element in both waters.
Table 2. Physicochemical characterization of OMWW
Unit Cerasuola-OMWW Nocellara etnea-OMWW
pH - 4.98 5.24 COD g/l 73.60 50.00 Total sugars g/l 34.00 16.04 Total nitrogen mg/l 350.00 116.00 Total phosphorous mg/l 186.00 229.00 Metal:
Sb, Hg, As, Ag, Cd, Se, Bi, Be
Mo Pb Al Cr Co Cu Zn Fe Mn Ni Na K Ca Mg mg/l < 0.01 0.01 0.03 0.30 0.02 0.02 0.60 3.00 1.99 2.17 0.11 303.34 7379.34 61.74 240.56 < 0.01 0.02 < 0.01 0.30 0.01 0.01 0.37 2.28 3.98 1.24 0.05 109.97 4732.58 42.58 161.41
50
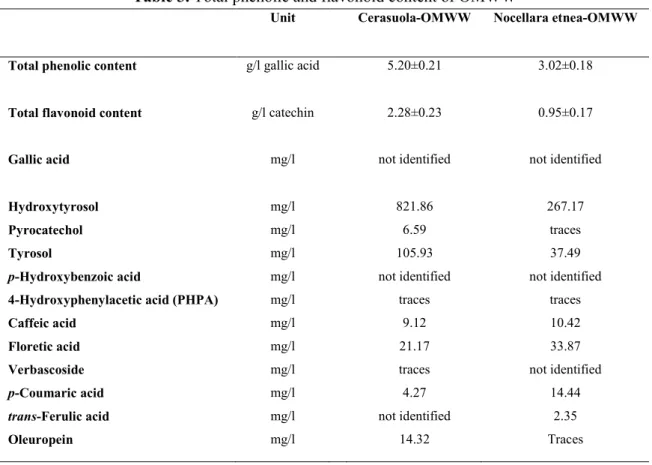
The total phenolic and flavonoid contents of Cerasuola-OMWW and Nocellara etnea-OMWW are shown in Table 3. It is worth noting that Cerasuola-OMWW had a total
phenolic and flavonoid content almost double compared to Nocellara etnea-OMWW. However, HPLC analysis evidenced that hydroxytyrosol and tyrosol were the most abundant biophenols present in both OMWW.
Table 3. Total phenolic and flavonoid content of OMWW
Unit Cerasuola-OMWW Nocellara etnea-OMWW
Total phenolic content g/l gallic acid 5.20±0.21 3.02±0.18
Total flavonoid content g/l catechin 2.28±0.23 0.95±0.17
Gallic acid mg/l not identified not identified
Hydroxytyrosol Pyrocatechol Tyrosol
p-Hydroxybenzoic acid
4-Hydroxyphenylacetic acid (PHPA) Caffeic acid
Floretic acid Verbascoside
p-Coumaric acid
trans-Ferulic acid Oleuropein mg/l mg/l mg/l mg/l mg/l mg/l mg/l mg/l mg/l mg/l mg/l 821.86 6.59 105.93 not identified traces 9.12 21.17 traces 4.27 not identified 14.32 267.17 traces 37.49 not identified traces 10.42 33.87 not identified 14.44 2.35 Traces
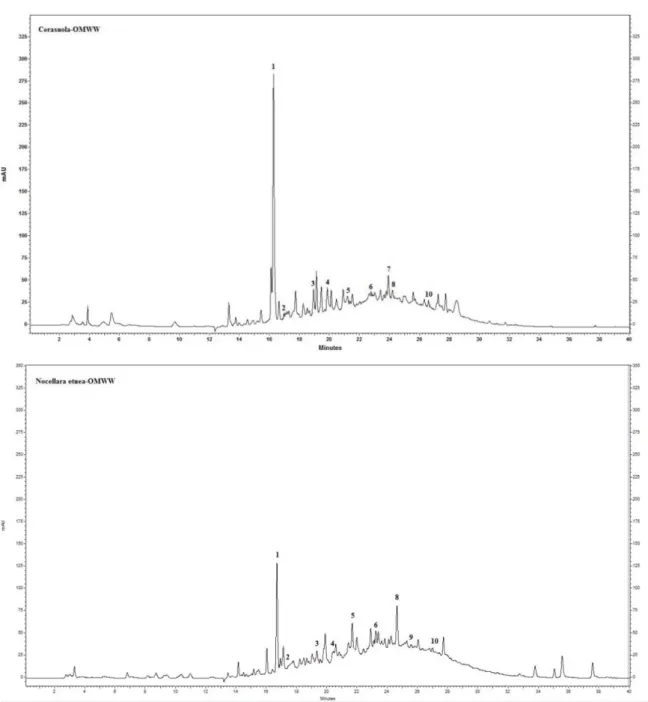
The chromatograms, shown in Figure 18, highlighted a quantitative rather than a qualitative
difference in the polyphenolic profiles of Cerasuola-OMWW and Nocellara etnea-OMWW. Moreover, a continuous low intensity band spreading along the chromatograms suggests the presence of a polyphenolic polymer as the origin of the OMWW dark pigmentation.
51
Figure 18. Chromatograms at 280 nm of Cerasuola-OMWW and Nocellara etnea-OMWW:
1) Hydroxytyrosol, 2) Pyrocatechol, 3) Tyrosol, 4) 4-Hydroxyphenylacetic acid (PHPA), 5) Caffeic acid, 6) Floretic acid, 7) Verbascoside, 8) p-Coumaric acid, 9) trans-Ferulic acid, 10) Oleuropein.
Figure 19 shows the antioxidant capabilities of Cerasuola-OMWW and Nocellara etnea-OMWW which were measured by DPPH test. The results, expressed as percentage decrease in absorbance with respect to control, evidenced the ability of the two waters in quenching, in a dose-dependent manner, the DPPH radical. In addition, both OMWW had a radical scavenging activity higher than the positive standard hydroxytyrosol (p < 0.05), probably
52
due to the synergistic effect of the other phenolic compounds present in the waters. Moreover, Cerasuola-OMWW showed a higher antioxidant activity with an IC50 value of 7.1
μM in comparison with Nocellara etnea-OMWW, as well as standard hydroxytyrosol, whose IC50 values were equal to 7.7 μM and 34.9 μM respectively.
Figure 19. Antioxidant activity of Cerasuola-OMWW and Nocellara etnea-OMWW compared to
hydroxytyrosol. The results, expressed as μM of hydroxytyrosol, are mean ± SD of three experiments each performed in triplicate. Both Cerasuola-OMWW and Nocellara etnea-OMWW values in the range 1-50 µM are significantly different (p < 0.05) vs hydroxytyrosol.
Table 4 reports the relative changes in the concentration of total phenols and flavonoids
measured in Cerasuola-OMWW and Nocellara etnea-OMWW during their45-day storage at different temperatures: 4°C and 25°C. The results evidenced a decrease of total phenols
and total flavonoids, particularly in Nocellara etnea-OMWW, in a temperature- and time-dependent manner. No significant changes were observed with respect to total phenolic, flavonoid and hydroxytyrosol content in both OMWW samples stored at -20°C for 6 months (data not shown).
0 20 40 60 80 100 1 5 10 25 50 100 D ecr em en t ( % ) μM Cerasuola-OMWW Nocellara etnea-OMWW Hydroxytyrosol